Abstract
The commissural projections between thirteen areas of cat auditory cortex (AC) were studied using retrograde tracers. Areal and laminar origins were characterized as part of a larger study of thalamic input and cortical origins of projections to each area. Cholera toxin beta subunit (CTβ) and cholera toxin beta subunit gold conjugate (CTβG) were injected separately within an area or in different areas in an experiment. Areas were identified independently with SMI-32, which revealed differences in immunoreactivity in layers III, V, and VI. Each area received convergent AC input from 3 to 6 (mean: 5) contralateral areas. Most of the projections (>75%) were homotopic, and from topographically organized loci in the corresponding area. Heterotopic projections (>1 mm beyond the main homotopic projection) constituted ~25% of the input. Layers III and V contained >95% of the commissural neurons. Commissural projection neurons were clustered in all areas. Commissural divergence, assessed by double labeling, was less than 3% in each area. This sparse axonal branching is consistent with the essentially homotopic connectivity of the commissural system. The many heterotopic origins represent unexpected commissural influences converging upon an area. Areas more dorsal on the cortical convexity have commissural projections originating in layers III and V; more ventral areas favor layer III at the expense of layer V, to its near-total exclusion in some instances. Some areas have almost entirely layer III origins (temporal cortex and area AII) whereas others have a predominantly layer V input (anterior auditory field) or dual contributions from layers III and V (the dorsal auditory zone). A topographic distribution of commissural cells of origin is consistent with order observed in thalamocortical and corticocortical projections, and which characterizes all extrinsic projection systems (commissural, corticocortical, and thalamocortical) in all AC areas. Thus, laminar as well as areal differences in projection origin distinguish the auditory cortical commissural system.
Keywords: interhemispheric, divergence, convergence, SMI-32, laminar origins, areal origins
INTRODUCTION
The commissural connections in sensory neocortex underlie the construction of unitary representations of space or the body from the independent peripheral contributions to each hemisphere (Gazzaniga, 2000). These connections follow unique rules of organization specific to each modality. Thus, in the primary visual cortex, only regions representing the vertical meridian project commissurally (Hubel and Wiesel, 1967; Segraves and Rosenquist, 1982; Miller and Vogt, 1984; Abel et al., 2000), and in primary somatic sensory cortex, the corpus callosum links proximal body representations preferentially, with distal extremities receiving lesser projections (Jones and Powell, 1968; Wise and Jones, 1976; Rouiller et al., 1994). By contrast, in the primary (AI) auditory cortex (AC) commissural connections link tonotopically and binaurally matched subregions across the representational axis of characteristic frequency (Imig and Brugge, 1978; Rüttgers et al., 1990; Rouiller et al., 1991; Morel et al., 1993) in a clustered arrangement (Code and Winer, 1985) that appears to support a modular organization, at least in primary auditory cortex (AI) (Middlebrooks et al., 1980). Despite the functional diversity of the thirteen areas of auditory cortex (Winer, 1992), the patterns organizing the interhemispheric connections are largely unknown outside of the primary fields. Thus, the commissural connections of non-tonotopic auditory areas, and their areal and laminar relations relative to those in AI, are the principal subjects of this study. A second goal is to apply measures of topography to these projections to assess their degree of order. Perhaps the commissural projections of non-primary cortex are less ordered than those in the primary areas, given the virtual absence of a regular arrangement of characteristic frequency in the non-primary regions (Schreiner and Cynader, 1984; Ehret, 1997). A third question is the pattern of interareal divergence (degree of branching) among commissural neurons and, if such cells exist, which fields are their targets.
In the primary auditory areas, commissural connections are topographic, clustered, and link homotopic regions predominantly (Code and Winer, 1986; Rouiller et al., 1991). Other, sparser input arises from similar characteristic frequency locations in tonotopic fields other than AI (Imig and Brugge, 1978; Rouiller et al., 1991; Winer, 1992), consistent with a highly parallel architecture and modest convergence from heterotopic (tonotopically or topographically mismatched) (Lee et al., 2004b). Also at issue is whether the various non-tonotopic fields are preferentially and reciprocally interconnected commissurally, as they are in the monkey (Hackett et al., 1999).
The laminar origins of these projections in each area are relevant for commissural function. In AI, these arise almost entirely from layers III and V (Code and Winer, 1985; Rouiller et al., 1991), but their sources elsewhere are unknown in the cat, even in the other primary areas. Since each layer is a potential source for information segregation, their laminar profiles can offer clues about areal sequences of processing.
To clarify area-specific differences in AC commissural connections, we investigated the contralateral cells of origin projecting to thirteen auditory areas in twenty-five experiments in which two sensitive retrograde tracers were injected either within an area or in different areas (Fig. 1B: inset). The first type of experiment assessed within-area variability, the second directly compared the connections of different areas in an experiment. The commissural labeling patterns were characterized by their areal, laminar, and topographic distribution, and these data were part of a broader study of the convergent input to each AC field (Lee and Winer, 2008a, 2008b). A final goal was to assess the proportion of double labeling, which is a metric of how commissural information is segregated and shared within and among areas.
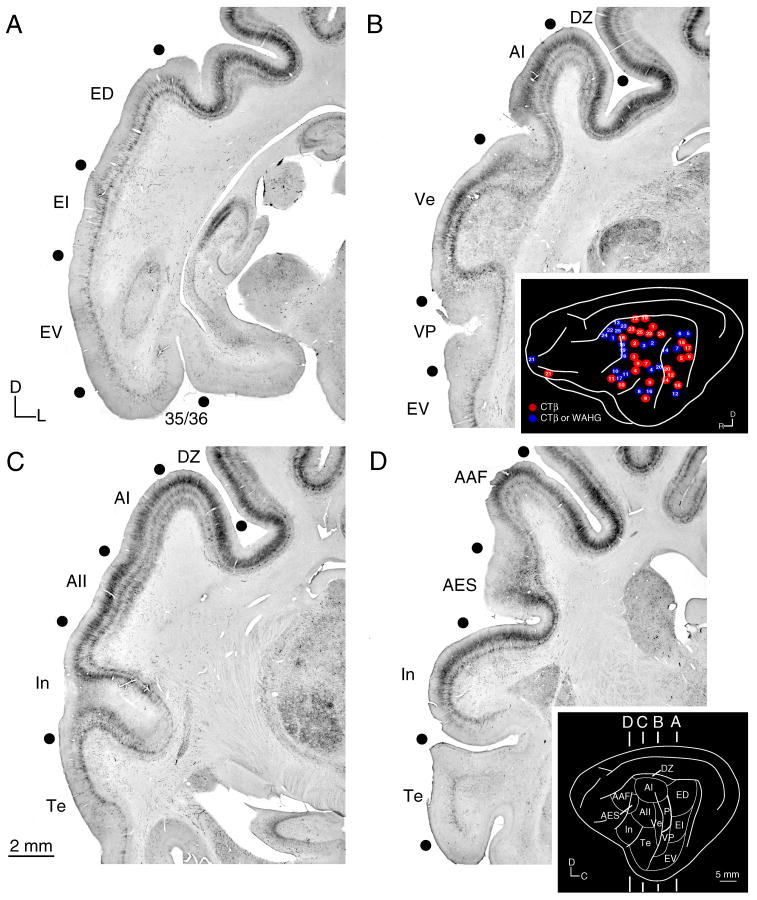
Fig. 1.
Immunoreactivity for SMI-32 in representative coronal cat auditory cortex (AC) sections. Marked differences in the laminar distribution and intensity of immunostaining distinguished areas. For example, the transition between areas In and Te (C) shows decreased layer III Te immunoreactivity. A: The posterior ectosylvian fields (ED, EI, EV) and the parahippocampal areas (35 and 36) were lightly immunoreactive, with layer V immunostaining in all areas. B: Primary cortical areas AI, Ve, and VP and adjoining area DZ immunostained more intensely in layer III than in area EV. C: Middle ectosylvian areas AI, AII, Te and nearby areas In, DZ were differentially immunostained, with dorsal areas (AI, AII, DZ) more reactive than ventral regions (Te, In). D: Rostral auditory areas AAF and AES had some of the most intense layer III staining, compared with limbic cortex areas In and Te. Black dots, areal borders. Insets, (B) summary of tracer injection locations (see Lee and Winer, 2008a), and (D) the anteroposterior location of panels A–D.
MATERIALS AND METHODS
Surgery, perfusion, and histology
Specific details of these procedures are given in the companion study (Lee and Winer, 2008a).
Data analysis
The neurons retrogradely labeled were plotted in an average series of ~36 sections/experiment to assess labeling in the hemisphere contralateral to the deposit(s); alternate series were used to verify labeling patterns. Labeled neurons from a 1:6 series were charted on a microscope with 10–25×objectives, and the labeled neurons were plotted on the Neurolucida computerized image-analysis system (MicroBrightField, Colchester, VT). The areal distribution of labeling was reconstructed using the three-dimensional solids module in the Neuroexplorer analysis software (MicroBrightField), which was corrected for shrinkage in the anterior-posterior axis by an average of ~28% based on alignment with whole brain photographs. In the cat cortex, sulcal landmarks and the steep gradient of the ventral cortical surface readily permit the alignment of sections with their relative position on the intact brain. This plot file was imported to Canvas (Deneba Software Inc., Miami, FL) and aligned with surface AC landmarks from post mortem brain photographs to superimpose areal boundaries. The laminar distribution of labeled neurons was determined by superimposing layer borders drawn with the Neurolucida from adjacent Nissl preparations. Quantitative analysis of neuronal distributions were made with Neuroexplorer and followed standard architectonic accounts and analyses of laminar borders (Rose, 1949; Sousa-Pinto, 1973; Winer, 1984a, 1984b, 1984c).
For topographical analysis, convergence, clustering, and separation were computed as in prior work (Lee and Winer, 2005). The convergence index is the ratio of the area of contralateral labeling to the area of the injection. The clustering index captures the mean distance between each labeled neuron and its closest neighbor. The separation graph is the distance between the injections sites and the mean distance between the centers of mass of the labeling. Histograms of distributions were produced with Excel (Microsoft Corp., Redmond, WA), and the statistical analysis was performed with Prism (GraphPad Software, San Diego, CA).
RESULTS
Commissural cells of origin in cat auditory cortex (AC) were labeled in twenty-five experiments with CTβ and CTβG or WAHG deposits (Fig. 1B, inset). Pairs of injections either within an area or in different areas revealed the areal and laminar distribution of input and were used to assess axonal divergence. Anatomical landmarks guided the placement of twenty-one injections, and in four others physiological mapping was used (Lee et al., 2004a); the latter results were comparable to those in unmapped experiments (Fig. 8A,B). The effective deposit site was ~1 mm, spanned all AC layers, and did not enter the white matter. Groups of 2–3 injections of the same tracer produced robust labeling from a site up to 3 mm long. Experiments with injections that entered the white matter or which crossed borders were excluded.
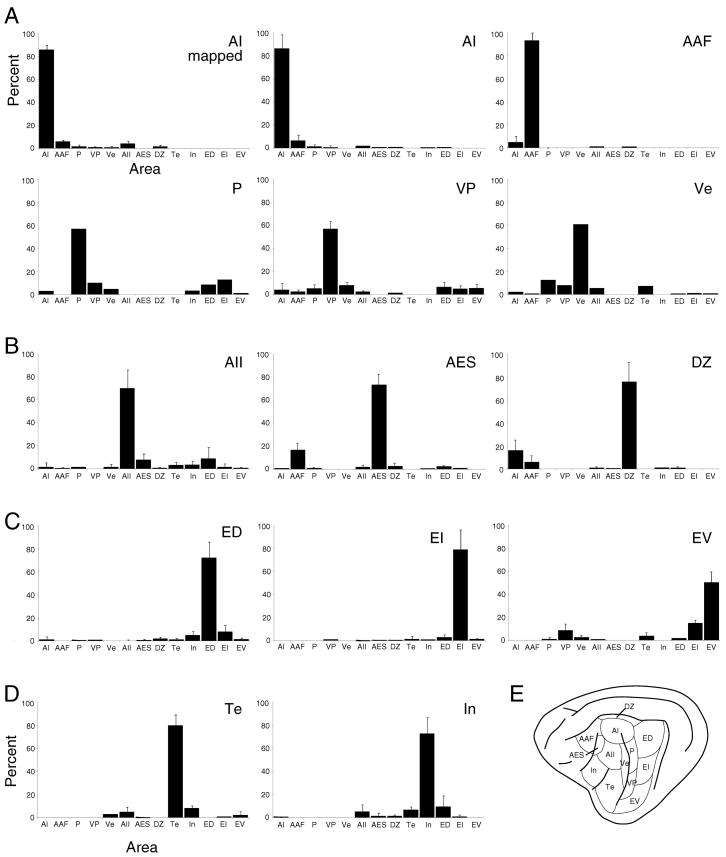
Fig. 8.
Histograms of the average commissural numerical strength in each AC area. Homotopic projections are >50%, and single heterotopic areal inputs are <5% of the input. The total heterotopic projection is ~25%. A: Projections to tonotopic areas AI, AAF, P, VP, Ve. B: Input to dorsally situated non-tonotopic areas AII, AES, DZ. C: Projections to caudal, non-tonotopic areas ED, EI, EV. D: Projections to ventral, limbic-related areas Te and In. E: The AC areas.
Architectonic subdivisions of auditory cortex
AC areas and their layers were identified by cyto- and myeloarchitectonic features in Nissl (Rose, 1949) and myelin (Gallyas, 1979) stains, acetylcholinesterase (Hedreen et al., 1985) histochemistry, and in parvalbumin (Celio, 1986) and SMI-32 antibody (Sternberger and Sternberger, 1983) immunostaining. SMI-32 was useful for revealing areal borders (Mellot et al., 2005) (Figs. 1, 2).
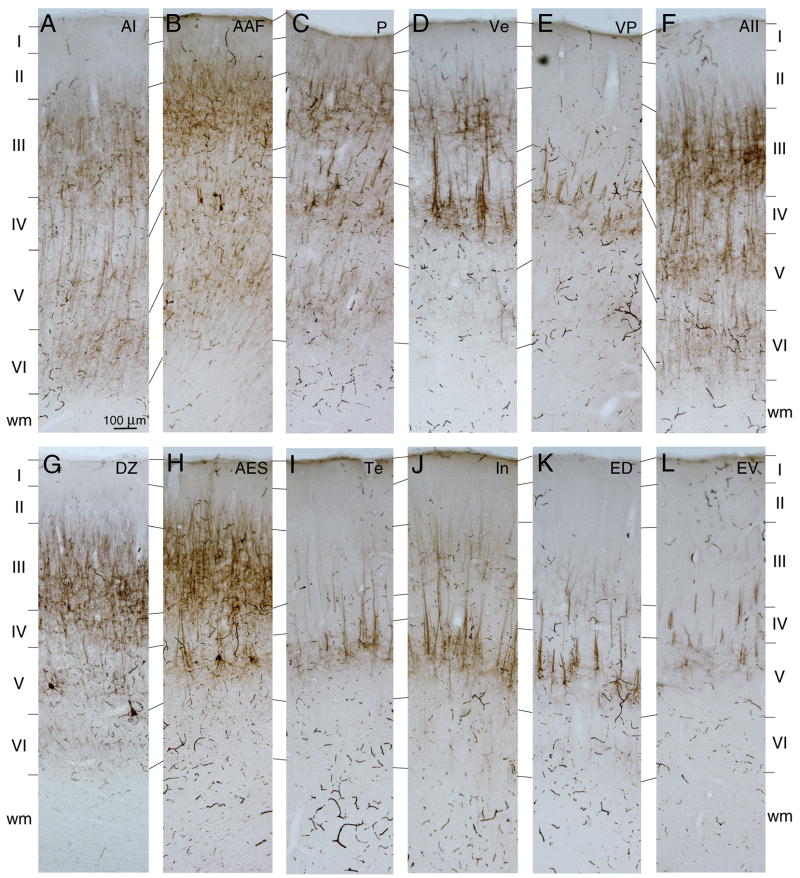
Fig. 2.
Areal and laminar patterns of SMI-32 immunostaining in AC areas. Areas have different patterns of immunoreactivity. Thus, AI (A) is distinguished from adjacent area AAF (B) by decreased staining of layer III neuropil and layer V cell bodies. Tonotopic areas (A: AI; B: AAF; C: P; D: Ve; E: VP) often had a strongly immunoreactive layer V, though in areas AI, AAF, P, and Ve, layers III and VI (AI, AAF, P) immunostained preferentially. Non-tonotopic areas (F: AII; G:DZ; H: AES) had immunostaining concentrated in layer III and V, though in AII layer VI was more intensely immunoreactive. In multisensory and limbic regions, layer V immunoreactivity was pronounced (I: Te; J: In; K: ED) or sparse (L: EV).
The SMI-32 antibody differentially labeled pyramidal cell neurofilaments in each area in layers III, V, and VI, with those in layer V most conspicuous; in control experiments without primary antibody, these were not labeled, as in previous studies (Van der Gucht et al., 2001; Mellott et al., 2005). Regional laminar differences in the pattern and intensity of immunostaining were seen at both global (Fig. 1) and local (Fig. 2) scales. Dorsal areas such as the anterior auditory field (AAF), primary auditory cortex (AI), and dorsal auditory zone (DZ), immunostained more intensely and involved more layers than ventral areas, such as the temporal field (Te), ventral posterior field (VP), and the ventral part of the posterior ectosylvian gyrus (EV) (Fig. 1). Similarly, rostral areas (AAF, AI, and insular (In) cortex) immunostained more heavily than the caudal areas in the posterior ectosylvian gyrus (ED, EI, and EV) (Fig. 1A,D). Transitions between adjacent areas were seen at low-magnification (Fig. 1), and higher-magnification showed area-specific variations in apical dendritic immunoreactivity (Fig. 2D).
Primary auditory areas (AI, AAF, the posterior field (P), VP, and the ventral (Ve) fields) had different patterns of immunostaining and were distinguished from one another and from nearby non-primary areas (Figs. 1, 2A–E). Areas AI, AAF, and P had prominent immunoreactivity in layers III, V, and VI, with decreased immunoreactivity rostrocaudally from area AAF to area P (Fig. 2A–C). Intensely immunoreactive, small- to medium-sized pyramidal cell somata common in areas AAF and P were rare in AI (Fig. 2A–C). By comparison, area Ve, along the rostral bank of the posterior ectosylvian sulcus, had robust layer III and V somatic and apical dendritic immunostaining (Figs. 1B, 2D), distinguishing it from the weaker immunostaining in areas AI (Fig. 2A) and Te (Fig. 2I). Area VP had the palest immunoreactivity of the primary fields, and this was confined to the superficial part of layer V (Fig. 2E).
Non-primary areas (the second auditory area (AII), dorsal zone (DZ), and the anterior ectosylvian sulcal (AES) area) were immunostained more intensely than primary AC, especially layer III neuron apical dendrites and the adjoining neuropil (Fig. 2F–H). This was marked at the AI borders with DZ and AII (Fig. 1C). In AII, layers III, V, and VI had the most intense dendritic immunostaining (Fig. 2F), although DZ and AES had more layer III immunoreactivity (Fig. 2G,H). Areas DZ and AES also had weaker layer V–VI immunoreactivity, with large darkly stained layer V pyramidal somata (Fig. 2G,H). Similar, smaller somata were present in layer V in areas AAF and P (Fig. 2B,C).
Multisensory (ED, EI, EV) and limbic (Te, In) areas had the palest SMI-32 immunoreactivity, which was concentrated in layer V (Fig. 2I–L). The transition between these fields and non-tonotopic and tonotopic areas was marked (Fig. 1A–C). Area In was the most intensely immunoreactive multisensory or limbic area, with moderate layer III and V immunostaining (Fig. 2J). Area Te differed, having moderate layer V immunoreactivity and little in layers I–III (Fig. 3I). The dorsal area of the posterior ectosylvian gyrus (ED) had moderate layer V somatic and dendritic staining, while layer III cells had weaker apical dendritic immunostaining (Figs. 1A, 2K). Area EI had lighter layer III and V staining, while layer VI was more immunoreactive than in ED (Fig. 1A). The ventral area EV had pale, intermittent layer V immunostaining (Fig. 2L).
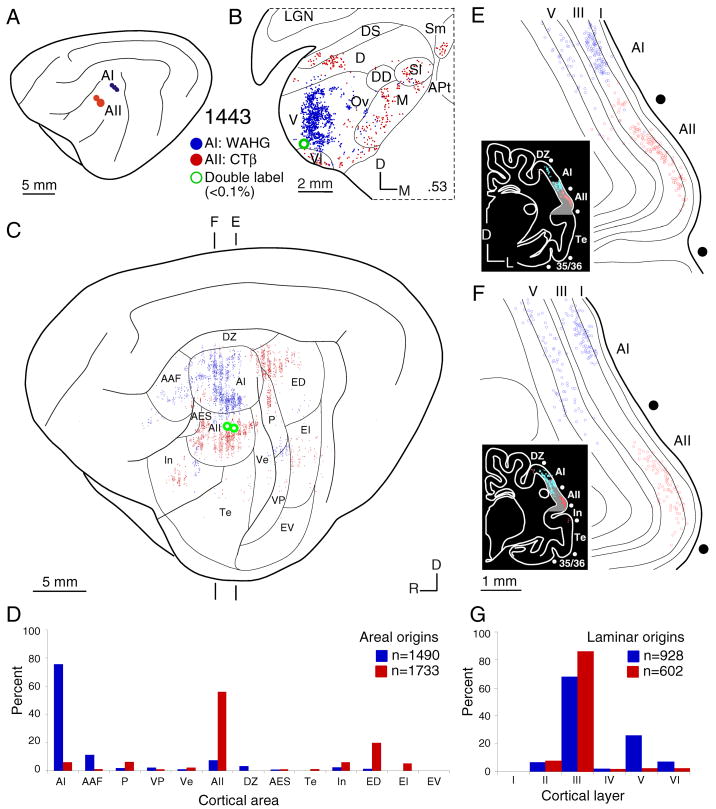
Fig. 3.
Areal and laminar distribution of commissural neurons after a WAHG deposit in primary auditory cortex (AI) (blue filled circles) and CTβ deposit in the second auditory area (AII) (red filled circles). To facilitate comparison, the right (contralateral) hemisphere (Figs. 4–6C, 7C) has been reversed to match the orientation of the left (ipsilateral) hemisphere in A. A: Locus and limits of AI and AII injections. B: Representative thalamic retrograde labeling of single- (blue and red dots) and double-labeled (green dots) neurons. The topographic separation of CTβ–and WAHG–labeled cells implies separate thalamic projection streams from the MGB ventral division to area AI and from the MGB dorsal and medial divisions to area AII, respectively. C: Areal commissural labeling shows a topographic and broad segregation of AI and AII interhemispheric projections. Vertical banding of cortical labeling (Figs. 4–6, 7) is an artifact of the reconstruction process (see Methods). Commissural projections arise from segregated and parallel groups of areas, with the main input to an area from reciprocal homotopic locations and organized topographically; these rules pertain also to thalamic input (Lee and Winer, 2008a). D: Histogram showing the quantitative strength of commissural input. Homotopic projections dominate each area (>60%), and heterotopic projections collectively contribute ~35% in each. E–F: Coronal sections showing the laminar distribution of the homotopic projections. Insets, gray shaded regions, the locations of the magnified cortical regions. G: Histogram of the laminar origins of the homotopic projections. AI has major (~70%) layer III and lesser (~30%) layer V contributions, while AII has an almost exclusively layer III projection (~95%) and little from layer V (~1%). Thus, these areas have distinct areal and laminar interhemispheric origins.
Finer distinctions within an area were seen. Insular cortex had variable layer III reactivity across the convexity (Fig. 1C,D), which may reflect regional architectonic subfields (Clascá et al., 2000). The major boundaries marked by SMI-32 correspond well with those described by physiological (Woolsey, 1960; Imig and Reale, 1980; Schreiner and Cynader, 1984; He et al., 1997; Loftus and Sutter, 2001) and anatomical (Andersen et al., 1980; Morel and Imig, 1987; Bowman and Olson, 1988a; Clarey and Irvine, 1990b; He and Hashikawa, 1998; Clascá et al., 2000) methods and are in accord with the connectional conclusions presented below. The rationale for a functional classification of areas as primary, non-primary, multisensory and limbic has been discussed elsewhere (Winer, 1992).
Areal origins
In an experiment targeting the primary auditory cortex (AI) and the second auditory cortical area (AII) (Fig. 3) largely independent projections were revealed. Thalamic projections from the tonotopic ventral division (Aitkin and Webster, 1972) and the tonotopically less organized dorsal and medial divisions (Aitkin, 1973) targeted AI and AII, respectively (Fig. 3B), in different ways. Input to AI arose from cells clustered in the ventral division (Fig. 3B:V) while AII projections arose from many more MGB divisions (Fig. 3B:D,M).
The origins of commissural projections to AI and AII were likewise distinct, and highly ordered. Clustered AI input arose principally from the contralateral homotopic AI (~80%) and from tonotopic areas AAF, P, and VP (Fig. 3C,D), whose projections likewise were clustered, and with only sparse input from non-tonotopic areas (e.g., AII) (Schreiner and Cynader, 1984). There were remarkably few cross projections between AI and AII (Fig. 3D), even after deposits <5 mm apart (Fig. 3A). In contrast, AII received input from a different set of 9 of 13 possible areas, including a broad spectrum of non-tonotopic loci in the contralateral AII (~60%), and from non-tonotopic, multisensory (ED) and limbic (In, Te) areas (Fig. 3C,D). Only modest input to AII from tonotopic areas (AAF and VP) was observed. Likewise, few neurons (<0.1%) projected to both areas as assessed by double labeling (Fig. 11C).
Fig. 11.
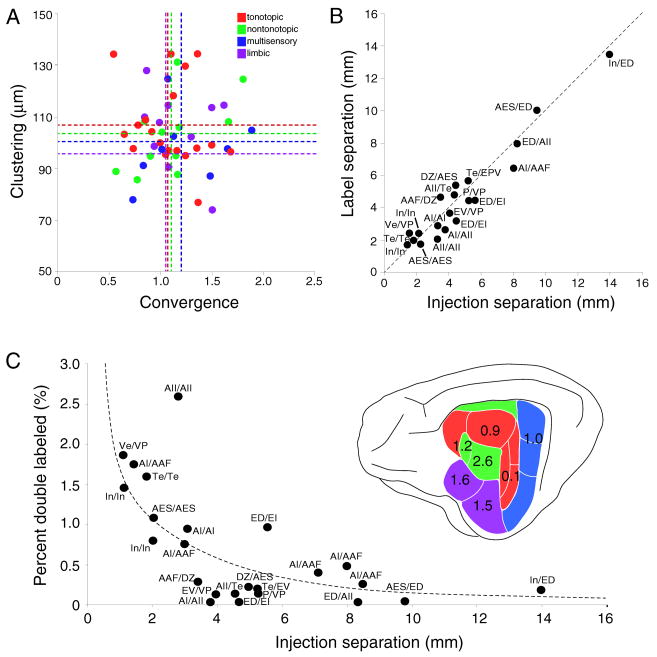
Quantitative assessment of commissural projection topography and divergence. A: The topographic homotopic precision was measured for each deposit by computing clustering, which measures the mean distance between labeled neurons, and convergence, which is the ratio of the area containing labeled neurons to the area injected. The scatter plot organizes these parameters by tonotopic (red dots), non-tonotopic (green dots), multisensory (blue dots) and limbic areas (purple dots), and these do not differ statistically (see Table 1). B: Topography was assessed further by measuring the interval between injection site centers and the labeling separation for the injection pairs in each case. Dashed line, values indicating a perfect correspondence. The close match between these values confirms a topographic and parallel arrangement of commissural connections. C: The commissural axonal divergence was measured by computing the percentage of double-labeled cells/case and plotting it against the separation of the injections. Double labeling is <3% and greater for closer deposits and among functionally related areas, consistent with limited commissural axon divergence.
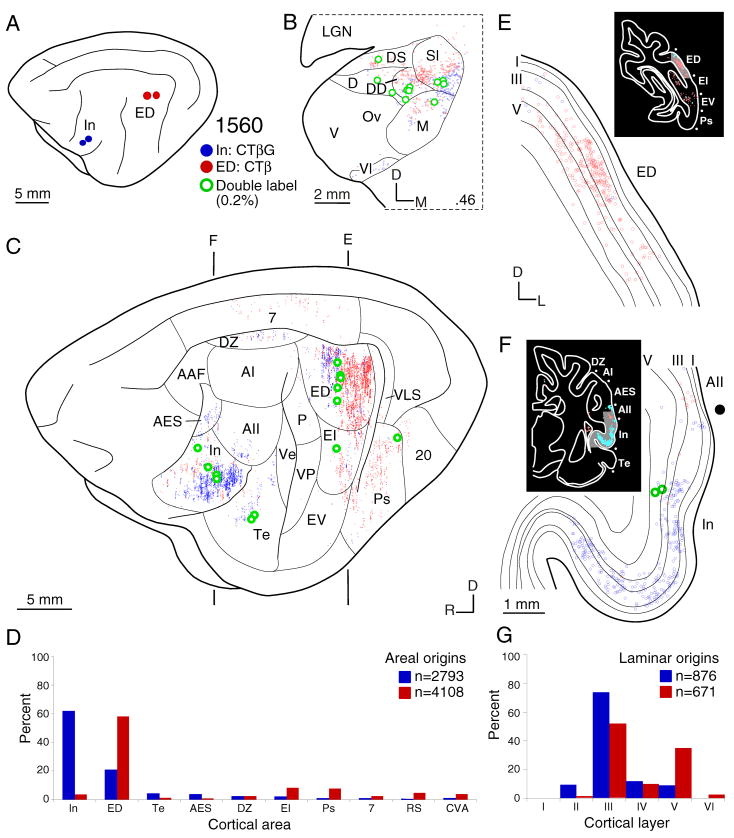
A second experiment targeted both areas ED and In, because of their presumed independence (Winer, 1992). Unexpectedly, much of the retrograde labeling originated from similar sources (Fig. 4: In, ED). Specifically, areas ED and In shared many thalamic nuclear (Fig. 4B) and commissural areal (Fig. 4C) sources of input, including the deep dorsal (Fig. 4B: DD) and suprageniculate nuclei (Fig. 4B: Sl, Sm), where the differentially projecting cells were often in close proximity.
Fig. 4.
Distribution of commissural neurons after a CTβG deposit in insular cortex (In) (blue filled circles) and a CTβ injection in the dorsal part of the posterior ectosylvian gyrus (ED) (red filled circles). A: Location and extent of In and ED deposits, respectively. B: Representative thalamic examples of retrograde single- (blue and red dots) and double-labeled (green dots) neurons. C: Widespread areal commissural origins and their topographic alignment in areas In and ED. Contralateral hemisphere orientation is reversed to match that of the ipsilateral hemisphere. Vertical banding of the labeling is a technical artifact (see Methods). These areas share similar commissural sources, much like their thalamic projections, with input from areas AII, Te, DZ and reciprocal projections with each other. D: The numerical origins of commissural areal input. Homotopic projections again dominate each area (>60%). There is a marked heterotopic area ED projection to In (~20%). E–F: Coronal sections showing the laminar origin of homotopic projections. G: Histogram of the laminar homotopic projections. ED receives layer III (~60%) and V (~40%) contributions, while In has more layer III (~80%) and less layer V input (~10%). Thus, areas with similar cortical origins have differential laminar contributions.
The commissural projections to areas In and ED were strongly homotopic, with >50% of labeled cells within this category. Areas ED and In had common (though small) heterotopic projections (areas DZ, EI, Te), and strong cross-projections with each other (Fig. 4C). Few neurons (~0.5%) had axons that spanned the 14 mm between these areas. Area ED was distinguished by its unique connections with extrastriate visual areas 7, 20, and Ps, while area In had more robust connections with surrounding fields Te, AII, and AES (Fig. 4C,D).
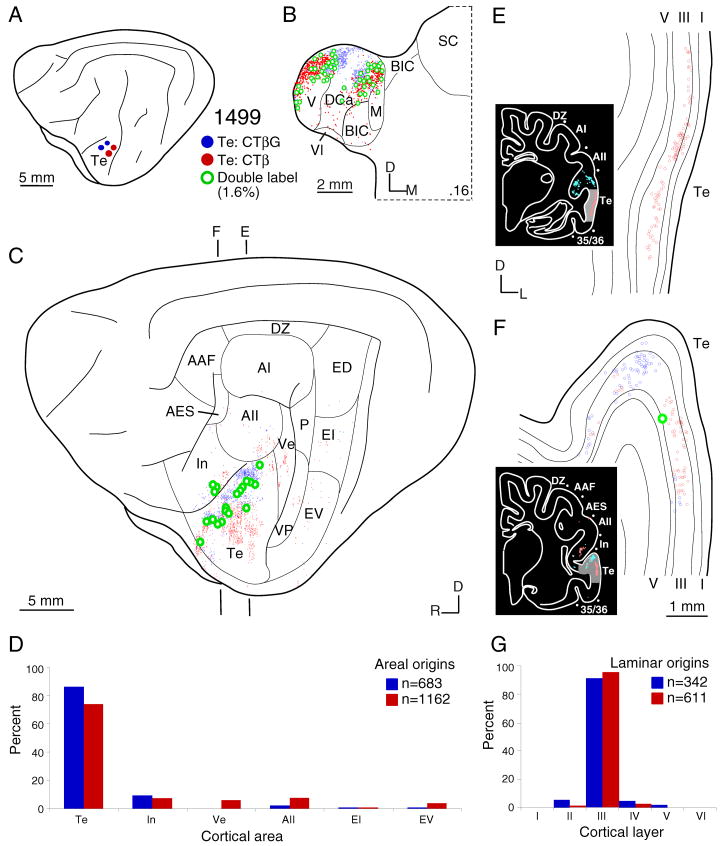
Injecting both tracers within a field (e.g. Fig. 5:Te) was done in seven experiments to probe features of intraareal connectivity. The following features observed in these experiments also were found in the interareal injections. First, the homolateral area always contained the majority of the projection cells (Fig. 5C, D). Second, projections were always and equally topographic (Fig. 11A,B). Third, input often arose from adjoining or even interdigitated groups of neurons. Fourth, despite the physical proximity of the cells of origin, few neurons projected to both areas or to different divisions within one area (Fig. 11C). Fifth, each projection had a specific pattern of laminar origin, and this was independent of the functional affiliation (tonotopic, non-tonotopic, etc.) of the area (Fig. 10).
Fig. 5.
Areal and laminar distribution of commissural neurons after topographically separated injections of CTβG (blue filled circles) and CTβ (red filled circles) in different parts of temporal (Te) auditory cortex. A: Area Te deposits. B: Representative thalamic plot of retrogradely single-(blue and red dots) and double-labeled (green dots) neurons. Distribution of CTβ– and WAHG–labeled cells in the dorsal caudal nucleus (DCa) is topographic. C: Areal commissural labeling distribution is broad and reflects the topographic separation of homotopic Te commissural projections. As in the MGB, origins are independent topographically, and arise mainly from the homotopic area, with lesser heterotopic input. D: Histogram of commissural input strength. Homotopic projection is ~80%, and heterotopic input is ~20%. E–F: Coronal plots of laminar homotopic projections. G: Laminar origins of homotopic input. Area Te resembles ventral auditory areas, with layer III contributing >95% of the projection.
Fig. 10.
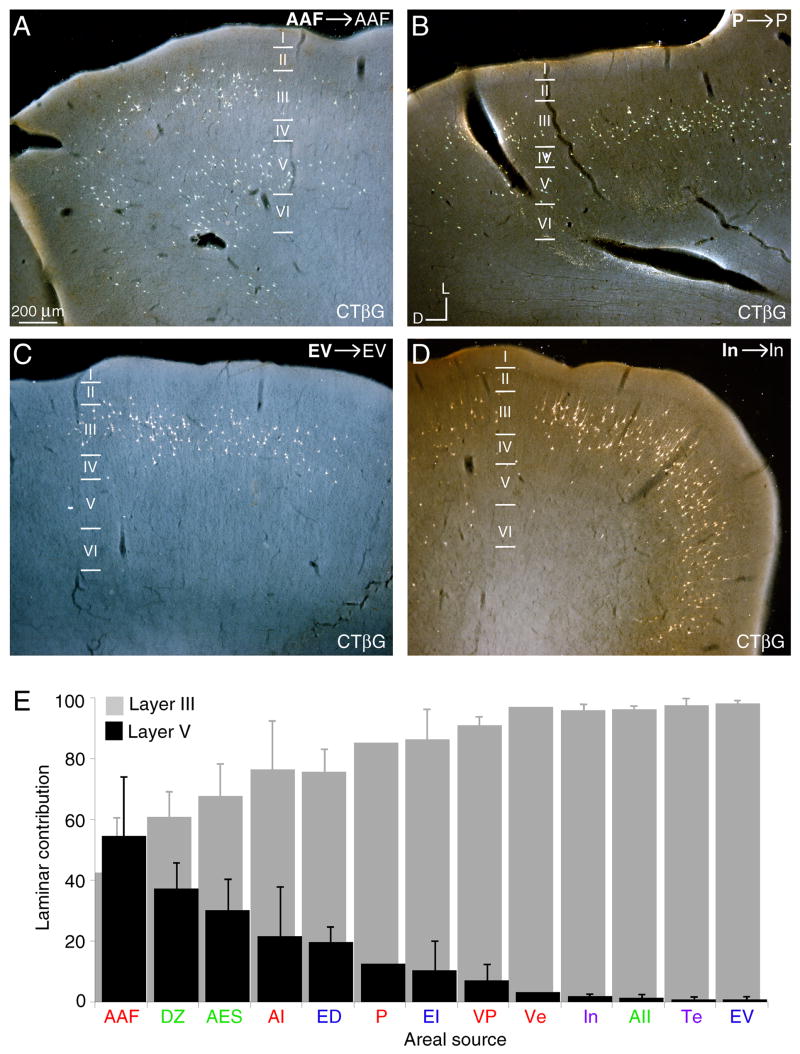
Laminar homotopic commissural origins. A–D: Photomicrographs showing the diverse laminar origins in several areas. Homotopic area AAF (A) and area P (B) projections arise preferentially in layers III and V, while those to EV (C) and In (D) are primarily from layer III. E: The relative layer III and V areal homotopic contributions. Dorsal areas receive more layer V projections than ventral areas, implying differential commissural participation for layers with subcortical projection targets.
After deposits were separated by <2 mm in area Te, the labeled MGB neurons were concentrated in the caudal dorsal and medial divisions (Fig. 5B:DCa, M); <2% were double labeled. Consistent with this, the commissural labeling arose from similar (Fig. 5D:In) but not identical (Fig. 5D:Ve,EV) areas.
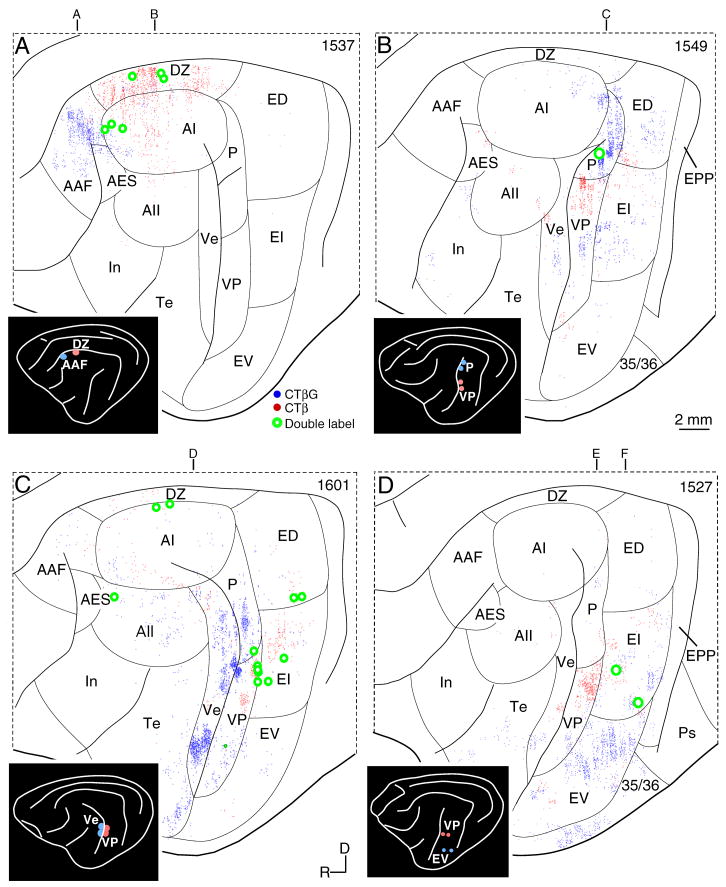
Four other experiments depicted more compactly confirm many of the patterns noted in the three cases shown more fully (Figs. 6, 7); these observations were consistent with those in the other experiments (Fig. 1B: inset). Deposits in areas DZ and AAF, respectively (Fig. 6A: inset) elicited strong homolateral labeling, as did injections in areas P and VP (Fig. 6B) and in Ve and VP (Fig. 6C) and VP and EV (Fig. 6D). Deposits in areas AI (Fig. 3C: blue) and AAF (Fig. 6A: blue) labeled fewer areas than did injections in the smaller, more caudal or ventral tonotopic areas P (Fig. 6B blue) and Ve (Fig. 6C: blue) and VP (Fig. 6B, 6D: red). Tonotopic areas on the banks of the posterior ectosylvian gyrus received the heaviest non-homotopic input of the gurus, even from area In, which has limbic relations (Colavita, 1979). Each VP deposit labeled cells in dorsal areas EI and in AII, and never in areas In or Te or AAF (Fig. 6B–D).
Fig. 6.
Areal origin of commissural projections. Insets, injection sites. The principal projection is topographic and always from the homotopic area. Sparser heterotopic projections arise from related fields. A: Projections to areas AAF (blue dots) and DZ (red dots). B: Input to areas P (blue dots) and VP (red dots). C: Projections to Ve (blue dots) and VP (red dots). D: Input to areas EV (blue dots) and VP (red dots). Letters above each panel indicate lateral sections in Fig. 7.
Fig. 7.
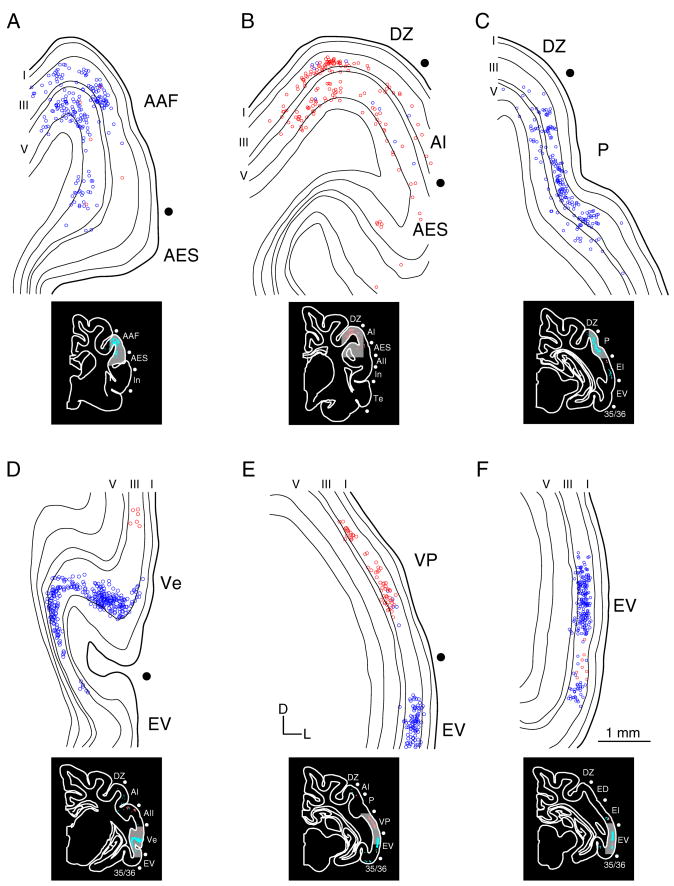
Laminar commissural origins. Sections at the anteroposterior levels indicated in Fig. 6. Dorsal regions (A–C) receive homotopic commissural projections from both layers III and V, whereas more ventral regions (D–F) receive primarily layer III input. Laminar projections to AAF (A), DZ (B), and P (C) show layer III and V labeling, with AAF receiving the largest layer V contribution. Laminar input to VP (D), Ve (E) and EV (F) involve chiefly layer III cells.
Some non-tonotopic regions shared connections with tonotopic, multisensory, and limbic areas. Thus, AII and DZ received input from AI, AAF, and ED (Figs. 3, 6A). The limbic and association areas were also highly interconnected, but shared lesser projections with adjacent non-tonotopic and tonotopic fields (Figs. 4, 5, 6D).
Homotopic and heterotopic projections
Callosal projections were principally from loci topographically in register with their contralateral targets, as injections in different parts of Te show (Fig. 5A). About 80% of commissural labeling came from homotopic loci (Fig. 5C). Many projections topographically mirrored the spatial distribution and separation of the ipsilateral retrograde labeling (Lee et al., 2004b). Surprisingly, such AC commissural dominance and homotopic specificity was as common in projections from non-primary areas (Figs. 3–6, 9) as in those from primary AC areas.
Fig. 9.
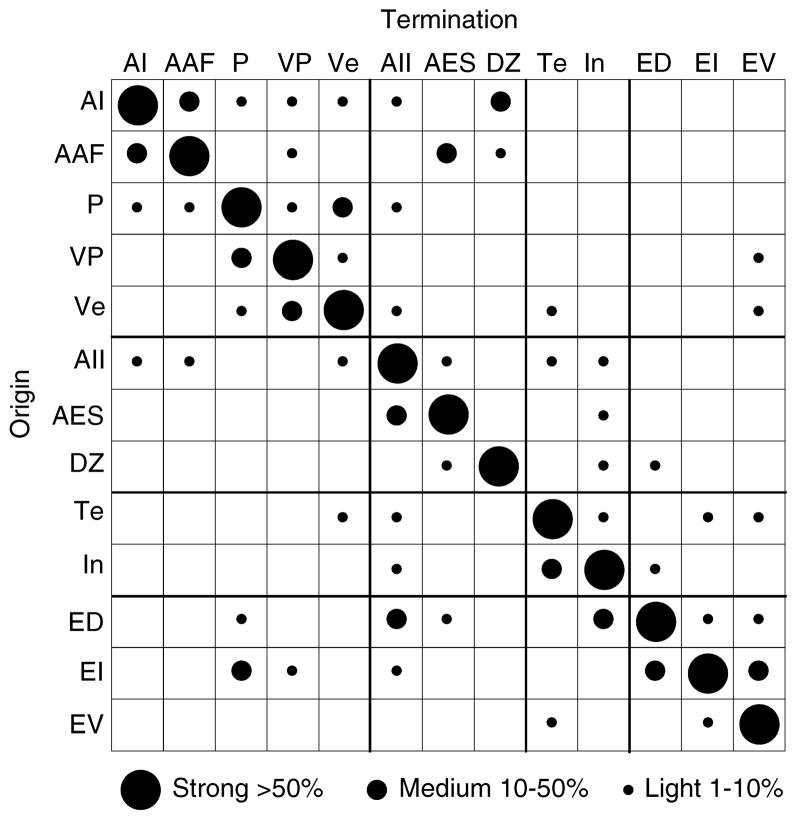
Summary of commissural projection density: strong projections (>50%; large circles), medium (5–<50%; medium-sized circles), and light (0.5–<5%; small circles). Homotopic projections predominate, and heterotopic projections link functionally related fields, often reciprocally.
Many commissural cells, especially those in tonotopically organized areas (Fig. 3: AI; Fig. 5A: AAF; Fig. 5B: P, VP; Fig. 5C,D: VP), were in close spatial register with the deposit site; however, a subset was always situated heterotopically (>1 mm from the center of densest labeling) (Lee and Winer, 2005). Even non-tonotopic areas had heterotopic projections outside the topographic homotopic core of the projection and in more remote areas, such as the area In projection to Te (Fig. 5), or the reciprocal projections between areas ED and In (Fig. 4). Whereas individual heterotopic projections from single areas were often <5%, the collective input from all heterotopic sources contributed ~25% of the total projection (Figs. 8, 9).
Measures of the areal origins of the commissural projections confirmed homotopic dominance, which always provided at least 50%, and often >70%, of the total input (Figs. 8, 9). Heterotopic areal projections were usually reciprocal, though the magnitudes of the reciprocal projections were not always equivalent (Fig. 9). These ranged from 0–20%, and averaged <5% of the total input for individual projections (Figs. 8, 9); however, the collective heterotopic projections from several areas constituted up to 40% of total commissural input in some cases (Fig. 8).
Laminar origins
The laminar sources of the homotopic commissural cells have two regional patterns organized dorsoventrally (Fig. 10). Projections from areas more dorsal (e.g. areas AAF, AI, and P) arose from neurons in layers III and V (Fig. 7A–C; 10A,B,E). In contrast, projections from more ventral fields (e.g. VP, In, and EV) involved layer III almost exclusively (Figs. 7D–F, 10C–E). Layers II, IV, and VI contributed minor projections, usually <3%, while layer I was never a source (Figs. 4–6E–G, 7, 10). This regionally specific contribution also followed a rostrocaudal axis, with the layer V input to AAF preponderant, and the smallest layer V projection from EV (Fig. 10E). Thus, the layer V contribution is regionally specific, with the largest origin dorsally and rostrally (AAF) and the smallest contribution ventral and caudally (EV) (Fig. 10E), consistent with a laminar disjunction organized as a gradient across the cortical convexity.
The laminar distribution of neurons also varied within an area. In more dorsal areas, the proportion of layer III and V contributions varied across the convexity within an area (Figs. 3F, 4E, 10A,B). For example in AI, commissural projections were found that originated from small layer V subregions, which were absent of layer III cells (Fig. 4E), and we also noted instances where layer III projections were robust and layer V projections were small. These regions surrounded the homotopic projection zone and represent an interesting heterotypic laminar input. Briefly, homotopic projections originated from diverse AC laminar sources and from finer local subregions within an area.
Hetero- and homotopic projections arose from the same layers. Quantitative population estimates of their laminar distribution were constrained by the few heterotopic neurons. Nonetheless, heterotopic projections followed the same laminar rules of origin as the homotopic projections, with dorsal areas involving layers III and V principally, and more ventral fields preferring layer III. For example, the projection from ED to In originates in layers III and V, while that from In to ED arose in layer III. Thus, some heterotopic projections had non-reciprocal laminar origins.
Interhemispheric topography
Topographic organization was assessed with three metrics: convergence, clustering, and separation (see Methods) (Fig. 11A,B) (Lee and Winer, 2005). The convergence index measured the diffuseness of the projection as a whole, while the clustering metric is an index of the spatial density. The mean values for convergence and clustering in the tonotopic and non-tonotopic projections did not differ significantly from each other or from the combined mean (p>0.05, z-test) (Fig. 11A; Table 1). Topographic separation compared the interval between the injection sites to that of the main homotopic groups of labeling. A close correspondence was found between the two measures (Fig. 11B), suggesting that the homotopic projections were highly and equally topographic throughout AC.
Table 1.
Convergence and clustering index assessed according to group. Metrics are statistically similar across groups, and indicate topographic uniformity for all commissural projections.
| Areal group | Convergence1 | Clustering2 |
|---|---|---|
| Tonotopic | 1.09±0.24 | 102.4±10.8 μm |
| Non-tonotopic | 1.10±0.38 | 103.7±15.7 μm |
| Multisensory | 1.26±0.41 | 98.9±14.5 μm |
| Limbic | 1.07±0.28 | 94.2±15.9 μm |
| All Areas3 | 1.13±0.33 | 102.7±14.0 μm |
Area of labeling/Area of injections.
Mean distance between neuron closest neighbors.
p>0.05, z-test.
Axonal divergence
Projections of AC commissural neurons to multiple fields were relatively rare, with <3% of neurons double-labeled after injections of the two retrograde tracers (Fig. 11C). Injections within an area produced the largest amount of double labeling, which was most abundant after injections within non-primary areas (Fig. 11C). As the interval between injections increased, AC double labeling decreased in both layers III and V from 3% (~2 mm) to <1% (>2 mm). At the largest separations (12–14 mm) <0.5% of neurons were double-labeled (Fig. 11C).
DISCUSSION
Defining areal boundaries
The SMI-32 antibody was used with Nissl preparations to identify cat AC areal boundaries, which is necessary since there are few studies outside the non-primary areas and therefore uncertainty as to their precise borders and no account available of their laminar arrangements. Regionally specific patterns of layer III, V, and VI pyramidal cell immunoreactivity characterized each area (Mellott et al., 2005). The laminar distribution of neocortical immunoreactivity is in close accord with prior findings in the cat (Van der Gucht et al., 2001; Mellott et al., 2005), monkey (Campbell and Morrison, 1989; Hof et al., 1995) and gerbil (Budinger et al., 2000). The laminar distribution of immunoreactive cells is consistent with previous results in visual regions of the suprasylvian and anterior ectosylvian sulci, near AC (Van der Gucht et al., 2001).
The pattern of SMI-32 immunoreactivity in AC (Mellott et al., 2005) is consistent with the areas defined in physiological (Woolsey, 1960; Imig and Reale, 1980; Schreiner and Cynader, 1984; He et al., 1997; Loftus and Sutter, 2001) and anatomical (Andersen et al., 1980; Morel and Imig, 1987; Bowman and Olson, 1988a; Clarey and Irvine, 1990b; He and Hashikawa, 1998; Clascá et al., 2000) studies. Physiologically mapped boundaries in AI and AAF (Lee et al., 2004a) were likewise in close correspondence with cytoarchitectonic estimates of boundaries. Material processed for Nissl, myelin, Gallyas, acetylcholinesterase, or parvalbumin also supported this parcellation (data not shown).
SMI-32 immunoreactivity is associated with specific classes of long- and short-range corticocortical projections, with long-range corticocortical neurons showing the most marked immunoreactivity (Hof and Morrison, 1995). Visual cortex layer III commissural neurons are highly enriched for neurofilament (Hof et al., 1997), thus corresponding to regions with long contralateral projections. We do not know if these conclusions pertain to the more dorsal AC areas. In more ventral areas (Te, In, EV), there is little correlation between the commissural projection and layer III immunoreactivity, since they have substantial layer III contralateral projections, but few SMI-32 immunoreactive neurons.
Origins of homotopic projections
The AC commissural projections from the homotopic areas (~75%) are topographic (Figs. 10, 12) (Code and Winer, 1986), with significant local discontinuities (Middlebrooks et al., 1980). This differs from the visual (Hubel and Wiesel, 1967; Segraves and Rosenquist, 1982; Miller and Vogt, 1984) and somatosensory (Jones and Powell, 1968; Wise and Jones, 1976; Rouiller et al., 1994) systems, where the central visual fields and the distal body segments, respectively, are incompletely connected. A dominant homotopic projection agrees with studies of AC callosal connectivity in rats (Rüttgers et al., 1990), ferrets (Wallace and Harper, 1997), and monkeys (FitzPatrick and Imig, 1980; Pandya and Rosene, 1993). The significance of the topographic nature of the projections in all areas is unknown.
Fig. 12.
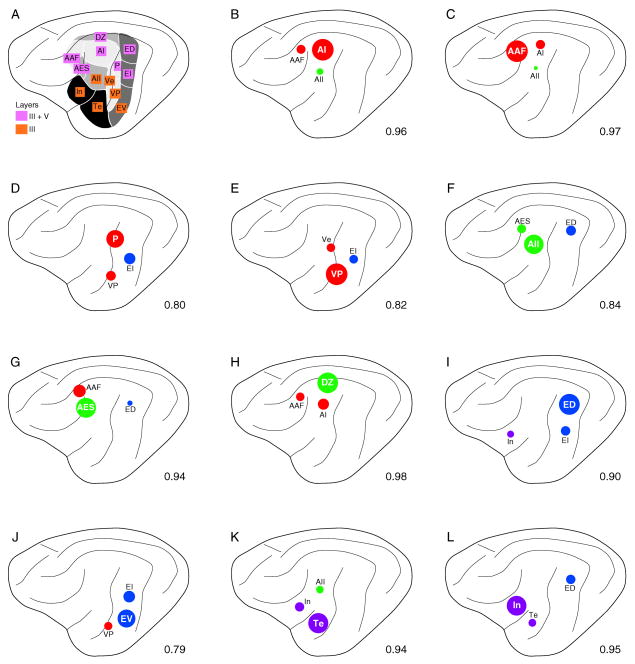
Graphical summary of three largest commissural inputs to each area. Dot sizes are proportional to projection strength. Decimals in lower right indicate total percentage of the three largest inputs. Colors, areal groupings: red (tonotopic), green (non-tonotopic), blue (multisensory), purple (limbic). Commissural target areas, bold lettering. A: AI. B: AAF. C: P. D: VP. E: Ve. F: AII. G: AES. H: DZ. I: ED. J: EV. K: Te. L: In.
Studies in AI have also reported a more periodic organization of the homotopic projections, with a banding of commissural neurons and axonal terminations orthogonal to the isofrequency axis and a pattern strongly correlated with binaural subregions (Imig and Brugge, 1978; Middlebrooks et al., 1980; Kelly and Wong, 1981; Code and Winer, 1986). We find a similar clustering in AI coronal sections (Fig. 3), though other AC areas were devoid of such banding, much as they appear to be devoid of a periodic thalamocortical terminal axonal plexus, which are continuous outside AI (Huang and Winer, 2000). If there is commissural periodicity or banding in the commissural cells of origin, it is below the resolution of our method.
Despite homotopic dominance, heterotopic projections arise in many areas (Lee et al., 2004b). This is unexpected because of the apparent commissural specificity in other studies (Rouiller et al., 1991; Imig and Reale, 1980; reviewed in Winer, 1992). Heterotopic projections preferentially link areas with similar thalamic (Lee and Winer, 2008a) and corticocortical (Lee and Winer, 2008b) affiliations, e.g., in non-primary perivisual areas such as ED and in limbic-related regions such as area In (Figs. 4, 9). Common sources of commissural input would not be predicted since In has predominantly limbic thalamic and amygdaloid relations (Clascá et al., 1997), whereas ED has mixed auditory and perivisual connections and no known limbic thalamic or cortical relation (Bowman and Olson, 1988a). Heterotopic convergence from these sources could explain the apparent physiological activation of an area by a broad array of commissural input (Bozhko and Slepchenko, 1988), which can enable commissural integration of information across many cortical areas (Lee and Winer, 2008b).
Laminar origins
Commissural projections arise almost exclusively from neurons in layers III and V (Fig. 10), as prior studies found (Imig and Brugge, 1978; Kelly and Wong, 1981; Code and Winer, 1985; Rouiller et al., 1991). However, we find robust lamina-specific origins in many areas, regional patterns of laminar origin, and a global gradient of commissural connectivity across the entire ectosylvian gyrus, an area of ~900 mm2. Thus, areas in the dorsal part of the lateral convexity have substantial layer V projections (AAF; Fig. 10A), while ventral areas have virtually no layer V input (EV; Fig. 10C).
The specific laminar origins (Fig. 10E) are diverse and perhaps species specific. Thus, in rodents, the commissural projection is largely from layers II–VI (Games and Winer, 1988; Rüttgers et al., 1990), while superficial layers dominate in monkeys (FitzPatrick and Imig, 1980; Morel et al., 1993) and ferrets (Wallace and Harper, 1997). Areas with species-specific laminar distributions could serve different functions.
The targets of projections from individual layers are not known in detail except in AI, but are presumed to be reciprocal (Code and Winer, 1986). This poses a puzzle for the heterotopic projections from dorsal to ventral areas, where there is little laminar parity in their origins, as in areas ED and In (Fig. 4). It is uncertain whether these projections are segregated by layers and not reciprocated (Fig. 12), or if other projections between layers preserve such reciprocity polysynaptically.
The differential laminar origins could allow the commissural system to engage layer V neurons differentially on an area-specific basis. Even though few AC layer V cells have dual commissural and corticocollicular roles (Wong and Kelly, 1981), the prospective physical proximity between these populations suggests a functional gradient across the cortical convexity, with more dorsal areas having a more focal commissural–corticocollicular/corticopontine relation than do more ventral areas. If the commissural and corticocollicular/corticopontine projections have no functional relationship, then these systems are interleaved in AC but independent. A clue that the systems may interact is that layer V pyramidal cell axons in most AC areas have extensive lateral branches, which could target other such cells or contribute to a lateral infragranular network (Winer and Prieto, 2001) between the commissural and corticofugal systems (Winer, 2006).
Divergence of commissural axons
Neurons having branched projections to two AC areas constitute <3% of the commissural projection, affirming the dominance of homotopic commissural origins. The maximum divergence is at separations <2 mm and it is slightly larger in non-primary areas, but may be too small to drive or establish their broader physiological tuning (Schreiner and Cynader, 1984; Clarey and Irvine, 1990a; He et al., 1997). A definitive answer would require knowledge of the distribution of single commissural axons, which is not available. Sparse projections between related areas occur at up to 14 mm (Fig. 11C). Comparably sparse branching is also found in the auditory thalamic (Lee and Winer, 2008a) and corticocortical (Lee and Winer, 2008b) pathways. Similar numerical values in physiologically-mapped cases intended to maximize double-labeling (Lee et al., 2004a) pertain for the sparse intra- and interareal divergence, and argue against false negatives as an explanation for the low values in mismatched injections. Likewise, even deposits within an area (Fig. 5) double labeled only 1.6% of neurons. This argues that sparse divergence is a general principle, and that inadvertent damage to fibers is unlikely to have contributed significantly to the proportion of double labeling. Divergent auditory forebrain connections may be rarer than in those in analogous visual (Bullier et al., 1984) and somatosensory (Spreafico et al., 1981) regions.
Functional perspective
The auditory system integrates bilateral information arising from each ear to derive a target’s spatial location (Zatorre et al., 2002), a computation distinguishing it from the visual and somatosensory commissural systems. Commissural auditory connections emerge early in the central auditory pathway and are found from the cochlear nucleus (Cant, 1992) to the midbrain (Saldaña et al., 1996) to the cortex, except in the auditory thalamus (Masterton, 1992). While each hemisphere may be responsible for contralateral sound perception, their interaction seems essential for unifying these perceptions with the sound source, as seen in the macaque (Heffner and Heffner, 1989; Heffner, 1997). It is therefore perhaps not surprising to find robust commissural connectivity in each AC area. It also implies that the many brain stem commissural connections may be responsible for localizing stimulus sources spatially, while the cortical role may embody affective and cognitive contributions.
The role of AC in sound localization remains unresolved. In the cat, callosal fiber transection (Moore et al., 1974), cortical ablations (Neff and Casseday, 1977; Cranford, 1979), electrophysiology (Stecker et al., 2005), and cooling inactivation (Malhotra et al., 2004) each demonstrate interhemispheric roles for AC areas in sound location that are not restricted to AI (Jenkins and Merzenich, 1984). Perhaps the physiology of an area differs between hemispheres, as studies of right hemisphere commissural dominance imply (Bianki et al., 1988). If such processing is asymmetric, the commissural projections might serve a unifying role.
The present results contribute to an understanding of AC areal organization besides defining the laminar organization, topography, and branching of the commissural system. Thus, two global principles define every area: all commissural cells of origin have topographically similar projection patterns (Table 1), and no area has precisely the same constellation of either commissural origins or terminations (Fig. 9) as any other. In regions such as the posterior ectosylvian gyrus, whose functional arrangement remains unsettled (Bowman and Olson, 1988a, 1988b), we found local differences in SMI-32 immunoreactivity (Figs. 1A, 2K–L) and connectivity (Fig. 9:ED, EI, EV) which imply that regional parcellation we chose is valid, and might lead to finer divisions as seen in other AC regions (Clascá et al., 1997, 2000). A further axis is suggested by the regionally specific laminar commissural origins, a pattern consistent with the idea that cortical areas embody multiple axes of representation and computation.
Acknowledgments
We thank Drs. Christoph Schreiner and Kazuo Imaizumi for their physiological expertise and for their generosity in sharing data from collaborative experiments. We are grateful to David Larue and Tania Bettis for their histological knowledge and assistance, to Dawn Sung, Richard Lee, Kristen Adams, Haleh Badakoobehi, and Esther Yoon for assistance with plotting, and to Jeffrey Mellott for his comments on the manuscript.
Supported by: National Institutes of Health grant R01 DC2319-29
ABBREVIATIONS
- AAF
anterior auditory field
- AES
anterior ectosylvian field
- aes
anterior ectosylvian sulcus
- AI
primary auditory cortex
- AII
secondary auditory cortex
- APt
Anterior pretectum
- BIC
Brachium of the inferior colliculus
- CTβ
cholera toxin beta subunit
- CTβG
cholera toxin beta subunit, gold-conjugate
- CVA
Cingulate visual area
- D
dorsal nucleus of the medial geniculate body
- DCa
Dorsal caudal nucleus of the medial geniculate body
- DD
deep dorsal nucleus of the medial geniculate body
- DS
dorsal superficial nucleus of the medial geniculate body
- DZ
dorsal auditory zone
- ED
posterior ectosylvian gyrus, dorsal part
- EI
posterior ectosylvian gyrus, intermediate part
- EPP
Posterior ectosylvian syrus, posterior part
- EV
posterior ectosylvian gyrus, ventral part
- I-VI
Layers of auditory cortex
- In
insular cortex
- L
Lateral
- LGN
lateral geniculate nucleus
- M
Medial
- M
medial division of the medial geniculate body
- Ov
ovoid part of the medial geniculate body
- P
posterior auditory cortex
- Ps
Postsylvian visual area
- R
Rostral
- RP
rostral pole division of the medial geniculate body
- RS
Retrosplenial cortex
- Sl
suprageniculate nucleus, lateral part
- Sm
suprageniculate nucleus, medial part
- Te
temporal cortex
- V
ventral division of the medial geniculate body
- Vb
ventrobasal complex
- Ve
ventral auditory area
- Vl
ventrolateral nucleus of the medial geniculate body
- VP
ventral posterior auditory area
- WAHG
Wheat germ apo-horseradish peroxidase gold conjugate
- wm
White matter
- 7
Visual area 7
- 20
Visual area 20
- 35/36
parahippocampal areas 35 and 36
References
- Abel PL, O’Brien BJ, Olavarria JF. Organization of callosal linkages in visual area V2 of macaque monkey. J Comp Neurol. 2000;428:278–293. doi: 10.1002/1096-9861(20001211)428:2<278::aid-cne7>3.0.co;2-r. [DOI] [PubMed] [Google Scholar]
- Aitkin LM. Medial geniculate body of the cat: responses to tonal stimuli of neurons in medial division. J Neurophysiol. 1973;36:275–283. doi: 10.1152/jn.1973.36.2.275. [DOI] [PubMed] [Google Scholar]
- Aitkin LM, Webster WR. Medial geniculate body of the cat: organization and responses to tonal stimuli of neurons in ventral division. J Neurophysiol. 1972;35:365–380. doi: 10.1152/jn.1972.35.3.365. [DOI] [PubMed] [Google Scholar]
- Andersen RA, Knight PL, Merzenich MM. The thalamocortical and corticothalamic connections of AI, AII, and the anterior auditory field (AAF) in the cat: evidence for two largely segregated systems of connections. J Comp Neurol. 1980;194:663–701. doi: 10.1002/cne.901940312. [DOI] [PubMed] [Google Scholar]
- Bianki VL, Bozhko GT, Slepchenko AF. Interhemispheric asymmetry of homotopic transcallosal responses of the auditory cortex in the cat. Neurosci Behav Physiol. 1988;18:315–323. doi: 10.1007/BF01185525. [DOI] [PubMed] [Google Scholar]
- Bowman EM, Olson CR. Visual and auditory association areas of the cat’s posterior ectosylvian gyrus: cortical afferents. J Comp Neurol. 1988a;272:30–42. doi: 10.1002/cne.902720104. [DOI] [PubMed] [Google Scholar]
- Bowman EM, Olson CR. Visual and auditory association areas of the cat’s posterior ectosylvian gyrus: thalamic afferents. J Comp Neurol. 1988b;272:15–29. doi: 10.1002/cne.902720103. [DOI] [PubMed] [Google Scholar]
- Bozhko GT, Slepchenko AF. Functional organization of the callosal connections of the cat auditory cortex. Neurosci Behav Physiol. 1988;18:323–330. doi: 10.1007/BF01185526. [DOI] [PubMed] [Google Scholar]
- Budinger E, Heil P, Scheich H. Functional organization of auditory cortex in the Mongolian gerbil (Meriones unguiculatus). IV. Connections with anatomically characterized subcortical structures. Eur J Neurosci. 2000;12:2452–2474. doi: 10.1046/j.1460-9568.2000.00143.x. [DOI] [PubMed] [Google Scholar]
- Bullier J, Kennedy H, Salinger W. Branching and laminar origin of projections between visual cortical areas in the cat. J Comp Neurol. 1984;228:329–341. doi: 10.1002/cne.902280304. [DOI] [PubMed] [Google Scholar]
- Campbell MJ, Morrison JH. Monoclonal antibody to neurofilament protein (SMI-32) labels a subpopulation of pyramidal neurons in the human and monkey neocortex. J Comp Neurol. 1989;282:191–205. doi: 10.1002/cne.902820204. [DOI] [PubMed] [Google Scholar]
- Cant NB. The cochlear nucleus: neuronal types and their synaptic organization. In: Popper AN, Fay RR, Webster DB, editors. Springer Handbook of Auditory Research volume 1. The Mammalian Auditory Pathways: Neuroanatomy. New York: Springer-Verlag; 1992. pp. 66–116. [Google Scholar]
- Celio MR. Parvalbumin in most gamma-aminobutyric acid-containing neurons of the rat cerebral cortex. Science. 1986;231:995–997. doi: 10.1126/science.3945815. [DOI] [PubMed] [Google Scholar]
- Clarey JC, Irvine DRF. The anterior ectosylvian sulcal auditory field in the cat: I. An electrophysiological study of its relation to surrounding auditory cortical fields. J Comp Neurol. 1990a;301:289–303. doi: 10.1002/cne.903010211. [DOI] [PubMed] [Google Scholar]
- Clarey JC, Irvine DRF. The anterior ectosylvian sulcal auditory field in the cat: II. A horseradish peroxidase study of its thalamic and cortical connections. J Comp Neurol. 1990b;301:304–324. doi: 10.1002/cne.903010212. [DOI] [PubMed] [Google Scholar]
- Clascá F, Llamas A, Reinoso-Suárez F. Insular cortex and neighboring fields in the cat: a redefinition based on cortical microarchitecture and connections with the thalamus. J Comp Neurol. 1997;384:456–482. doi: 10.1002/(sici)1096-9861(19970804)384:3<456::aid-cne10>3.0.co;2-h. [DOI] [PubMed] [Google Scholar]
- Clascá F, Llamas A, Reinoso-Suárez F. Cortical connections of the insular and adjacent parieto-temporal fields in the cat. Cereb Cortex. 2000;10:371–399. doi: 10.1093/cercor/10.4.371. [DOI] [PubMed] [Google Scholar]
- Code RA, Winer JA. Commissural neurons in layer III of cat primary auditory cortex (AI): pyramidal and non-pyramidal cell input. J Comp Neurol. 1985;242:485–510. doi: 10.1002/cne.902420404. [DOI] [PubMed] [Google Scholar]
- Code RA, Winer JA. Columnar organization and reciprocity of commissural connections in cat primary auditory cortex (AI) Hear Research. 1986;23:205–222. doi: 10.1016/0378-5955(86)90110-3. [DOI] [PubMed] [Google Scholar]
- Colavita F. Temporal pattern discrimination in cats with insular-temporal lesions. Physiol Behav. 1979;18:513–521. doi: 10.1016/0031-9384(74)90175-9. [DOI] [PubMed] [Google Scholar]
- Cranford JL. Auditory cortex lesions and interaural intensity and phase-angle discrimination in cats. J Neurophysiol. 1979;42:1518–1526. doi: 10.1152/jn.1979.42.6.1518. [DOI] [PubMed] [Google Scholar]
- Ehret G. The auditory cortex. J Comp Physiol A. 1997;181:547–557. doi: 10.1007/s003590050139. [DOI] [PubMed] [Google Scholar]
- FitzPatrick KA, Imig TJ. Auditory cortico-cortical connections in the owl monkey. J Comp Neurol. 1980;192:589–610. doi: 10.1002/cne.901920314. [DOI] [PubMed] [Google Scholar]
- Gallyas F. Silver staining of myelin by means of physical development. Neurol Res. 1979;1:203–209. doi: 10.1080/01616412.1979.11739553. [DOI] [PubMed] [Google Scholar]
- Games KD, Winer JA. Layer V in rat auditory cortex: projections to the inferior colliculus and contralateral cortex. Hear Res. 1988;34:1–26. doi: 10.1016/0378-5955(88)90047-0. [DOI] [PubMed] [Google Scholar]
- Gazzaniga MS. Cerebral specialization and interhemispheric communication: does the corpus callosum enable the human condition? Brain. 2000;123:1293–1326. doi: 10.1093/brain/123.7.1293. [DOI] [PubMed] [Google Scholar]
- Hackett TA, Stepniewska I, Kaas JH. Callosal connections of the parabelt auditory cortex in macaque monkeys. Eur J Neurosci. 1999;11:856–866. doi: 10.1046/j.1460-9568.1999.00492.x. [DOI] [PubMed] [Google Scholar]
- He J, Hashikawa T. Connections of the dorsal zone of cat auditory cortex. J Comp Neurol. 1998;400:334–348. doi: 10.1002/(sici)1096-9861(19981026)400:3<334::aid-cne4>3.0.co;2-9. [DOI] [PubMed] [Google Scholar]
- He J, Hashikawa T, Ojima H, Kinouchi Y. Temporal integration and duration tuning in the dorsal zone of cat auditory cortex. J Neurosci. 1997;17:2615–2625. doi: 10.1523/JNEUROSCI.17-07-02615.1997. [DOI] [PMC free article] [PubMed] [Google Scholar]
- Hedreen JC, Bacon SJ, Price DL. A modified histochemical technique to visualize acetylcholinesterase-containing axons. J Histochem Cytochem. 1985;33:134–140. doi: 10.1177/33.2.2578498. [DOI] [PubMed] [Google Scholar]
- Heffner HE. The role of macaque auditory cortex in sound localization. Acta Otolaryngol (Stock) Suppl. 1997;532:22–27. doi: 10.3109/00016489709126140. [DOI] [PubMed] [Google Scholar]
- Heffner HE, Heffner RS. Unilateral auditory cortex ablation in macaques results in a contralateral hearing loss. J Neurophysiol. 1989;62:789–801. doi: 10.1152/jn.1989.62.3.789. [DOI] [PubMed] [Google Scholar]
- Hof PR, Morrison JH. Neurofilament protein defines regional patterns of cortical organization in the macaque monkey visual system: a quantitative immunohistochemical analysis. J Comp Neurol. 1995;352:161–186. doi: 10.1002/cne.903520202. [DOI] [PubMed] [Google Scholar]
- Hof PR, Nimchinsky EA, Morrison JH. Neurochemical phenotype of corticocortical connections in the macaque monkey: quantitative analysis of a subset of neurofilament protein-immunoreactive projection neurons in frontal, parietal, temporal, and cingulate cortices. J Comp Neurol. 1995;362:109–133. doi: 10.1002/cne.903620107. [DOI] [PubMed] [Google Scholar]
- Hof PR, Ungerleider LG, Adams MM, Webster MJ, Gattass R, Blumberg DM, Morrison JH. Callosally projecting neurons in the macaque monkey V1/V2 border are enriched in nonphosphorylated neurofilament protein. Vis Neurosci. 1997;14:981–987. doi: 10.1017/s0952523800011688. [DOI] [PubMed] [Google Scholar]
- Huang CL, Winer JA. Auditory thalamocortical projections in the cat: laminar and areal patterns of input. J Comp Neurol. 2000;427:302–331. doi: 10.1002/1096-9861(20001113)427:2<302::aid-cne10>3.0.co;2-j. [DOI] [PubMed] [Google Scholar]
- Hubel DH, Wiesel TN. Cortical and callosal connections concerned with the vertical meridian of the visual fields in the cat. J Neurophysiol. 1967;30:1561–1573. doi: 10.1152/jn.1967.30.6.1561. [DOI] [PubMed] [Google Scholar]
- Imig TJ, Brugge JF. Sources and terminations of callosal axons related to binaural and frequency maps in primary auditory cortex of the cat. J Comp Neurol. 1978;182:637–660. doi: 10.1002/cne.901820406. [DOI] [PubMed] [Google Scholar]
- Imig TJ, Reale RA. Patterns of cortico-cortical connections related to tonotopic maps in cat auditory cortex. J Comp Neurol. 1980;192:293–332. doi: 10.1002/cne.901920208. [DOI] [PubMed] [Google Scholar]
- Jenkins WM, Merzenich MM. Role of cat primary auditory cortex for sound-localization behavior. J Neurophysiol. 1984;52:819–847. doi: 10.1152/jn.1984.52.5.819. [DOI] [PubMed] [Google Scholar]
- Jones EG, Powell TPS. The commissural connexions of the somatic sensory cortex in the cat. J Anat (Lond) 1968;103:433–455. [PMC free article] [PubMed] [Google Scholar]
- Kelly JP, Wong D. Laminar connections of the cat’s auditory cortex. Brain Res. 1981;212:1–15. doi: 10.1016/0006-8993(81)90027-5. [DOI] [PubMed] [Google Scholar]
- Lee CC, Imaizumi K, Schreiner CE, Winer JA. Concurrent tonotopic processing streams in auditory cortex. Cereb Cortex. 2004a;14:441–451. doi: 10.1093/cercor/bhh006. [DOI] [PubMed] [Google Scholar]
- Lee CC, Schreiner CE, Imaizumi K, Winer JA. Tonotopic and heterotopic projection systems in physiologically defined auditory cortex. Neuroscience. 2004b;128:871–887. doi: 10.1016/j.neuroscience.2004.06.062. [DOI] [PubMed] [Google Scholar]
- Lee CC, Winer JA. Principles governing auditory cortex connections. Cereb Cortex. 2005;15:1804–1814. doi: 10.1093/cercor/bhi057. [DOI] [PubMed] [Google Scholar]
- Lee CC, Winer JA. Connections of cat auditory cortex. I. Thalamocortical system. J Comp Neurol. 2008a;507:1879–1900. doi: 10.1002/cne.21611. [DOI] [PMC free article] [PubMed] [Google Scholar]
- Lee CC, Winer JA. Connections of cat auditory cortex. III. Corticocortical system. J Comp Neurol. 2008b;507:1920–1943. doi: 10.1002/cne.21613. [DOI] [PMC free article] [PubMed] [Google Scholar]
- Loftus WC, Sutter ML. Spectrotemporal organization of excitatory and inhibitory receptive fields of cat posterior auditory field neurons. J Neurophysiol. 2001;86:475–491. doi: 10.1152/jn.2001.86.1.475. [DOI] [PubMed] [Google Scholar]
- Malhotra S, Hall AJ, Lomber SG. Cortical control of sound localization in the cat: unilateral cooling deactivation of 19 cerebral areas. J Neurophysiol. 2004;92:1625–1643. doi: 10.1152/jn.01205.2003. [DOI] [PubMed] [Google Scholar]
- Masterton RB. Role of the central auditory system in hearing: the new direction. Trends Neurosci. 1992;15:280–285. doi: 10.1016/0166-2236(92)90077-l. [DOI] [PubMed] [Google Scholar]
- Mellott JG, Van Der Gucht E, Lee CC, Larue DT, Winer JA, Lomber SG. Subdividing cat primary and non-primary auditory areas in the cerebrum with neurofilament proteins expressing SMI-32. Assn Res Otolayngol Abstr. 2005;28:994. [Google Scholar]
- Middlebrooks JC, Dykes RW, Merzenich MM. Binaural response-specific bands in primary auditory cortex (AI) of the cat: topographic organization orthogonal to isofrequency contours. Brain Res. 1980;181:31–48. doi: 10.1016/0006-8993(80)91257-3. [DOI] [PubMed] [Google Scholar]
- Miller MW, Vogt BA. Heterotopic and homotopic callosal connections in rat visual cortex. Brain Res. 1984;297:75–89. doi: 10.1016/0006-8993(84)90544-4. [DOI] [PubMed] [Google Scholar]
- Moore CN, Casseday JH, Neff WD. Sound localization: the role of the commissural pathways of the auditory system of the cat. Brain Res. 1974;82:13–26. doi: 10.1016/0006-8993(74)90889-0. [DOI] [PubMed] [Google Scholar]
- Morel A, Garraghty PE, Kaas JH. Tonotopic organization, architectonic fields, and connections of auditory cortex in macaque monkeys. J Comp Neurol. 1993;335:437–459. doi: 10.1002/cne.903350312. [DOI] [PubMed] [Google Scholar]
- Morel A, Imig TJ. Thalamic projections to fields A, AI, P, and VP in the cat auditory cortex. J Comp Neurol. 1987;265:119–144. doi: 10.1002/cne.902650109. [DOI] [PubMed] [Google Scholar]
- Neff WD, Casseday JH. Effects of unilateral ablation of auditory cortex on monaural cat’s ability to localize sound. J Neurophysiol. 1977;40:44–52. doi: 10.1152/jn.1977.40.1.44. [DOI] [PubMed] [Google Scholar]
- Pandya DN, Rosene DL. Laminar termination patterns of thalamic, callosal, and association afferents in the primary auditory area of the rhesus monkey. Exp Neurol. 1993;119:220–234. doi: 10.1006/exnr.1993.1024. [DOI] [PubMed] [Google Scholar]
- Rose JE. The cellular structure of the auditory region of the cat. J Comp Neurol. 1949;91:409–440. doi: 10.1002/cne.900910305. [DOI] [PubMed] [Google Scholar]
- Rouiller EM, Babalian A, Kazennikov O, Moret V, Yu X-H, Wiesendanger M. Transcallosal connections of the distal forelimb representations of the primary and supplementary motor cortical areas in macaque monkeys. Exp Brain Res. 1994;102:227–243. doi: 10.1007/BF00227511. [DOI] [PubMed] [Google Scholar]
- Rouiller EM, Simm GM, Villa AEP, de Ribaupierre Y, de Ribaupierre F. Auditory corticocortical interconnections in the cat: evidence for parallel and hierarchical arrangement of the auditory cortical areas. Exp Brain Res. 1991;86:483–505. doi: 10.1007/BF00230523. [DOI] [PubMed] [Google Scholar]
- Rüttgers K, Aschoff A, Friauf E. Commissural connections between the auditory cortices of the rat. Brain Res. 1990;509:71–79. doi: 10.1016/0006-8993(90)90310-8. [DOI] [PubMed] [Google Scholar]
- Saldaña E, Feliciano M, Mugnaini E. Distribution of descending projections from primary auditory neocortex to inferior colliculus mimics the topography of intracollicular projections. J Comp Neurol. 1996;371:15–40. doi: 10.1002/(SICI)1096-9861(19960715)371:1<15::AID-CNE2>3.0.CO;2-O. [DOI] [PubMed] [Google Scholar]
- Schreiner CE, Cynader MS. Basic functional organization of second auditory cortical field (AII) of the cat. J Neurophysiol. 1984;51:1284–1305. doi: 10.1152/jn.1984.51.6.1284. [DOI] [PubMed] [Google Scholar]
- Segraves MA, Rosenquist AC. The distribution of the cells of origin of callosal projections in cat visual cortex. J Neurosci. 1982;2:1079–1089. doi: 10.1523/JNEUROSCI.02-08-01079.1982. [DOI] [PMC free article] [PubMed] [Google Scholar]
- Sousa-Pinto A. The structure of the first auditory cortex (AI) in the cat. I. — Light microscopic observations on its structure. Arch Ital Biol. 1973;111:112–137. [PubMed] [Google Scholar]
- Spreafico R, Hayes NL, Rustioni A. Thalamic projection on the primary and secondary somatosensory cortices in cat: single and double retrograde tracer studies. J Comp Neurol. 1981;203:67–90. doi: 10.1002/cne.902030107. [DOI] [PubMed] [Google Scholar]
- Stecker GC, Harrington IA, Macpherson EA, Middlebrooks JC. Spatial sensitivity in the dorsal zone (area DZ) of cat auditory cortex. J Neurophysiol. 2005;94:1267–1280. doi: 10.1152/jn.00104.2005. [DOI] [PubMed] [Google Scholar]
- Sternberger LA, Sternberger NH. Monoclonal antibodies that distinguish phosphorylated and nonphosphorylated forms of filament in situ. Proc Natl Acad Sci U S A. 1983;80:6126–6130. doi: 10.1073/pnas.80.19.6126. [DOI] [PMC free article] [PubMed] [Google Scholar]
- Van der Gucht E, Vandesande F, Arckens L. Neurofilament protein: a selective marker for the architectonic parcellation of the visual cortex in adult cat brain. J Comp Neurol. 2001;441:345–368. doi: 10.1002/cne.1416. [DOI] [PubMed] [Google Scholar]
- Wallace MN, Harper MS. Callosal connections of the ferret primary auditory cortex. Exp Brain Res. 1997;116:367–374. doi: 10.1007/pl00005764. [DOI] [PubMed] [Google Scholar]
- Winer JA. Anatomy of layer IV in cat primary auditory cortex (AI) J Comp Neurol. 1984a;224:535–567. doi: 10.1002/cne.902240405. [DOI] [PubMed] [Google Scholar]
- Winer JA. The non-pyramidal neurons in layer III of cat primary auditory cortex (AI) J Comp Neurol. 1984b;229:512–530. doi: 10.1002/cne.902290406. [DOI] [PubMed] [Google Scholar]
- Winer JA. The pyramidal cells in layer III of cat primary auditory cortex (AI) J Comp Neurol. 1984c;229:476–496. doi: 10.1002/cne.902290404. [DOI] [PubMed] [Google Scholar]
- Winer JA. The functional architecture of the medial geniculate body and the primary auditory cortex. In: Webster DB, Popper AN, Fay RR, editors. Springer Handbook of Auditory Research, volume 1, The Mammalian Auditory Pathway: Neuroanatomy. New York: Springer-Verlag; 1992. pp. 222–409. [Google Scholar]
- Winer JA. Decoding the auditory corticofugal systems. Hear Res. 2006;212:1–8. doi: 10.1016/j.heares.2005.06.014. [DOI] [PubMed] [Google Scholar]
- Winer JA, Prieto JJ. Layer V in cat primary auditory cortex (AI): cellular architecture and identification of projection neurons. J Comp Neurol. 2001;434:379–412. doi: 10.1002/cne.1183. [DOI] [PubMed] [Google Scholar]
- Wise SP, Jones EG. The organization and postnatal development of the commissural projection of the rat somatic sensory cortex. J Comp Neurol. 1976;163:313–343. doi: 10.1002/cne.901680302. [DOI] [PubMed] [Google Scholar]
- Wong D, Kelly JP. Differentially projecting cells in individual layers of the auditory cortex: a double-labeling study. Brain Res. 1981;230:362–366. doi: 10.1016/0006-8993(81)90416-9. [DOI] [PubMed] [Google Scholar]
- Woolsey CN. Organization of cortical auditory system: a review and synthesis. In: Rasmussen GL, Windle WF, editors. Neural Mechanisms of the Auditory and Vestibular Systems. Springfield, Illinois: Charles C Thomas; 1960. pp. 165–180. [Google Scholar]
- Zatorre R, Bouffard M, Ahad P, Belin P. Where is “where” in the human auditory cortex. Nat Neurosci. 2002;5:905–909. doi: 10.1038/nn904. [DOI] [PubMed] [Google Scholar]


