

Abstract
Staphylococcal immunoglobulin-binding protein, Sbi, is a 436-residue protein produced by many strains of Staphylococcus aureus. It was previously characterized as being cell surface-associated and having binding capacity for human IgG and β2-glycoprotein I. Here we show using small angle x-ray scattering that the proposed extracellular region of Sbi (Sbi-E) is an elongated molecule consisting of four globular domains, two immunoglobulin-binding domains (I and II) and two novel domains (III and IV). We further show that together domains III and IV (Sbi-III-IV), as well as domain IV on its own (Sbi-IV), bind complement component C3 via contacts involving both the C3dg fragment and the C3a anaphylatoxin domain. Preincubation of human serum with either Sbi-E or Sbi-III-IV is inhibitory to all complement pathways, whereas domain IV specifically inhibits the alternative pathway. Monitoring C3 activation in serum incubated with Sbi fragments reveals that Sbi-E and Sbi-III-IV both activate the alternative pathway, leading to consumption of C3. By contrast, inhibition of this pathway by Sbi-IV does not involve C3 consumption. The observation that Sbi-E activates the alternative pathway is counterintuitive to intact Sbi being cell wall-associated, as recruiting complement to the surface of S. aureus would be deleterious to the bacterium. Upon re-examination of this issue, we found that Sbi was not associated with the cell wall fraction, but rather was found in the growth medium, consistent with it being an excreted protein. As such, our data suggest that Sbi helps mediate bacterial evasion of complement via a novel mechanism, namely futile fluid-phase consumption.
The human pathogen Staphylococcus aureus produces an arsenal of virulence factors that aid the organism in effectively evading the immune system of the host. The ability of S. aureus to evade the adaptive immune response of the host has long been recognized (1). Staphylococcal cell wall-associated protein A (SpA),7 for instance, binds immunoglobulin G Fc fragment, and it interacts with certain Fab fragments, thus characterizing SpA as a B-cell superantigen (2, 3). The Fc binding capacity of SpA has also been found to counteract the innate immune defenses of the host by interfering with the activation of the classical pathway of the complement system (4). More recently a group of small excreted proteins has been discovered that also aid S. aureus in evading complement-mediated bacterial clearance (5-8). The discovery of new evasion molecules, and understanding the molecular basis of the mode of action of these molecules, not only leads to a better knowledge of their role in the pathophysiology of bacterial infections but is also the first step in their possible exploitation as anti-inflammatory disease therapeutics.
In addition to SpA, a second staphylococcal immunoglobulin-binding protein, Sbi, has been identified (9) that occurs in many S. aureus strains (including methicillin-sensitive and -resistant strains). Sbi is a 436-amino acid protein that contains one functional immunoglobulin-binding domain and a second predicted immunoglobulin-binding motif, both with sequence similarity to the five immunoglobulin-binding repeats (E, A, B, C, and D) of SpA (see Fig. 1a) but no other significant sequence similarity to known proteins. Recently it was shown that the second predicted immunoglobulin-binding motif of Sbi is indeed a functional IgG-binding domain and that, in contrast to SpA, Sbi only interacts with the IgG Fc fragment (10). Unlike SpA, Sbi lacks the typical Gram-positive cell wall anchoring sequence LPXTG, but it does have a predicted proline-rich cell wall-spanning segment (9). It has further been suggested that Sbi is associated with the bacterial surface through electrostatic interactions (9). Finally, Sbi has been shown to bind another plasma component, adhesion protein β2-glycoprotein I (β2-GPI), a protein that has been implicated in blood coagulation (11, 12).
FIGURE 1.
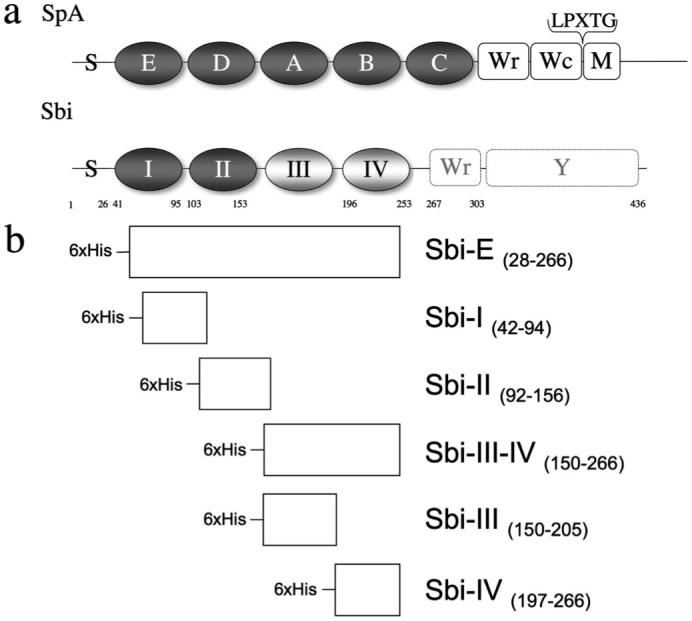
a, schematic drawing of the domain structure of Sbi compared with the structure of SpA. Extracellular domains are represented in grayscale. Indicated are the positions of the signal peptide sequence (S), ligand-binding domains (SpA: E, D, A, B, and C; Sbi: I and II in dark gray), novel domains, identified by SAXS analysis (domain III and domain IV in light gray), cell wall-spanning regions (Wr and Wc) and membrane-spanning region M. The position of the cell wall-anchoring LPXTG motif in SpA is indicated. The predicted cell wall-spanning proline-repeat region (Wr) in Sbi (9) is also shown, as is the C-terminal tyrosine-rich region (Y), which has been implicated in IgG-mediated signal transduction (48). b, schematic representation of the Sbi protein constructs used in the experiments described in this paper. The engineering of the Sbi-E, Sbi-I, and Sbi-II constructs is based on sequence homology with SpA. The boundaries of Sbi-IV are based on the minimal β2-GPI domain identified by Zhang et al. (11).
Here we reveal the putative extracellular domain organization of Sbi, determine the specific function of the individual domains, and describe the implications for their possible role in the evasion of both adaptive and innate immune systems in humans by S. aureus. To investigate the arrangement of the domains in solution, we cloned, expressed, and purified the proposed extracellular part of Sbi, adjacent to the predicted cell wall-spanning proline-rich repeat region (9) (Sbi-E, residues 28-266, Fig. 1, a and b) and subjected the fragment to small angle x-ray scattering (SAXS), a technique well suited to study flexible macromolecules in solution (13). Based on the SAXS-derived model, we then engineered five recombinant Sbi fragments, spanning the N-terminal region of the protein (Sbi-I, Sbi-II, Sbi-III-IV, Sbi-III, and Sbi-IV, as shown in Fig. 1b). Human and animal serum proteins that interact with Sbi were identified by affinity pulldown and MALDI-TOF mass spectrometry, and candidates were further investigated in direct binding assays. Follow-up functional assays have revealed a novel mechanism through which Sbi subverts the complement system.
EXPERIMENTAL PROCEDURES
Cloning and Expression of Recombinant Sbi Constructs
Six recombinant fragments of the N-terminal region of Sbi (adjacent to the polyproline region) were engineered as follows: Sbi-E (amino acids 28-266), Sbi-I (amino acids 42-94), Sbi-II (amino acids 92-156), Sbi-III-IV (amino acids 150-266), Sbi-III (amino acids 150-205), and Sbi-IV (amino acids 197-266), as shown in Fig. 1b. The Sbi gene constructs were amplified by PCR using S. aureus strain Mu50 genomic DNA as a template. The following oligonucleotide primers were used for Sbi-E, Sbi-I, Sbi-II, Sbi-III-IV, Sbi-III, and Sbi-IV, respectively: 5′-CAT GCC ATG GCG AGT GAA AAC ACG CAA CAA-3′ (forward primer) and 5′-CCG CTC GAG TCA TTA CGC CAC TTT CTT TTC AGC-3′ (reverse primer); 5′-CAT GCC ATG GGA ACT CAA AAC AAC TAC GTA ACA-3′ (forward primer) and 5′-CCG CTC GAG TCA CTA GCT GTC TTT AAG TGA TTC AGA-3′ (reverse primer); 5′-CAT GCC ATG GAC AGC AAG ACC CCA GAC CGA-3′ (forward primer) and 5′-CCG CTC GAG GAG TCA TTA ATT TTC AAT ATT TTG ACG-3′ (reverse primer); 5′-CAT GCC ATG GAA CGT CAA AAT ATT GAA AAT GCG-3′ (forward primer) and 5′-CCG CTC GAG TCA TTA CGC CAC TTT CTT TTC AGC-3′ (reverse primer); 5′-CAT GCC ATG GAA CGT CAA AAT ATT GAA AAT GCG-3′ (forward primer) and 5′-CCG CTC GAG TCA TTA AAC GAT TGC TTT TTC AAT TGA-3′ (reverse primer); 5′-CAT GCC ATG GTT TCA ATT GAA AAA GCA ATC GTT-3′ (forward primer) and 5′-CCG CTC GAG TCA TTA CGC CAC TTT CTT TTC AGC-3′ (reverse primer). All primers were obtained from MWG Biotech AG. The resulting amplified fragments were subsequently cloned into the pET-based “parallel” vector (14) (using the incorporated NcoI (forward primer) and XhoI (reverse primer) restriction sites) producing the constructs psbi-e, psbi-i, psbi-ii, psbi-iii-iv, psbi-iii, and psbi-iv, respectively.
Sbi constructs were expressed in Escherichia coli strains BL21(DE3), BL21(DE3)-Star, or Rosetta. Freshly transformed E. coli cells were grown in a shaker at 37 °C in Luria Bertani broth (LB), containing ampicillin, until they reached an extinction of 0.6 at 600 nm. Isopropyl β-d-thiogalactopyranoside (Melford) was added to a final concentration of 0.2 mm, and the cells were incubated at 28 °C for an additional 4 h. Cells from a 1-liter culture were harvested by centrifugation, resuspended in 10 ml of binding buffer (20 mm Tris-HCl, 0.5 m NaCl, 20 mm imidazole, pH 8.0), and lysed by sonication. The lysate was centrifuged at 40,000 × g for 15 min and the supernatant filtered through a 0.45-μm filter. The proteins were purified using nickel-ion chelating chromatography by either applying the filtered supernatant to a Sartobind membrane (Sartorius) or a 1-ml HiTrap column attached to an ÄKTA purifier (Amersham Biosciences). Next, the column was washed with binding buffer, and the bound proteins were eluted with a buffer containing 1 m imidazole, for the Sartobind purification, or a 0.05-1 m imidazole gradient for the HiTrap purification. Purified protein was dialyzed into a buffer solution, typically 20 mm Tris, pH 8.0, 100 mm NaCl, and stored at -80 °C until use. Protein concentration was determined using a Bradford protein assay (Bio-Rad) and absorbance at 280 nm (A280 0.1% (=1 g/liter): 0.66 for Sbi-E; 1.11 for Sbi-I; 0.80 for Sbi-III-IV; 0.77 for Sbi-III and 0.54 for Sbi-IV). All expressed Sbi constructs have a 25-residue N-terminal tag with sequence MSYHHHHHHDYDIPTTENLYFQGAM, including a 6-histidine purification tag followed by a tobacco etch virus protease cleavage site. The three tyrosines residues of the tag contribute to calculated extinction coefficients used. Molecular masses employed for calculating molar concentrations were as follows: Sbi-E, 31000; Sbi-I, 8700; Sbi-II, 11000; Sbi-III, 9000; Sbi-III-IV, 17000; and Sbi-IV, 11000. Exact predicted molecular mass values were confirmed by micro-TOF mass spectrometry analysis as follows: Sbi-E, 30867.1/30735.3; Sbi-I, 9524.4/9392.3; Sbi-II, 10776.6/10645; Sbi-III-IV, 16657.4/16525.9; Sbi-III, 9668.6/9536.2; Sbi-IV, 11074.4/10942.7 (predicted/actual molecular mass), indicating that all constructs missed the first methionine residue.
Small Angle X-ray Scattering Experiments and Data Analysis
Synchrotron radiation x-ray scattering data were collected on the X33 beam line at the EMBL, Hamburg Outstation (DORIS III storage ring at DESY). Solutions of Sbi-E were measured on a MAR345 image plate detector at protein concentrations of 2.8, 8.4, and 16.7 mg/ml and sample detector distance of 2.4 m and wavelength λ = 1.5 Å, covering the momentum transfer range 0.013 < s < 0.45 Å-1 (s = 4π sin(θ)/λ where 2θ is the scattering angle). Prior to data collection, dynamic light scattering analysis was used to ensure the monodispersity of the protein samples. To check for radiation damage, two successive 2-min exposures taken on the same sample were compared; no radiation effects were observed. The data were processed using standard procedures and extrapolated to zero solute concentration using the program package PRIMUS (15).
The forward scattering I(0) and the radius of gyration (Rg) were evaluated using the Guinier approximation (16) assuming that at very small angles (s < 1.3/Rg) the intensity is represented as I(s) = I(0) exp(-(sRg)2/3). These parameters were also computed from the entire scattering patterns using the indirect transform package GNOM (17), which also provided the intraparticle distance distribution function (p(r)) and the maximum dimension (Dmax). The molecular mass of the solute was evaluated by comparison of the forward scattering with that from reference solutions of bovine serum albumin (molecular mass = 66 kDa). The low resolution ab initio model of Sbi was constructed using the program DAMMIN (18), which represents the protein by an assembly of densely packed beads. Simulated annealing was employed to build a compact interconnected configuration of beads inside a sphere with the diameter Dmax that fits the experimental data Iexp(s) minimizing the discrepancy (Equation 1),
| (Eq. 1) |
where N is the number of experimental points; c is a scaling factor, and Icalc(sj) and σ(sj) are the calculated intensity and the experimental error at the momentum transfer sj, respectively. A dozen DAMMIN runs were performed to check the stability of solution, and the results were well superimposable with each other. These independent reconstructions were analyzed by the program DAMAVER (19) yielding the most probable model (displayed in Fig. 2b).
FIGURE 2.
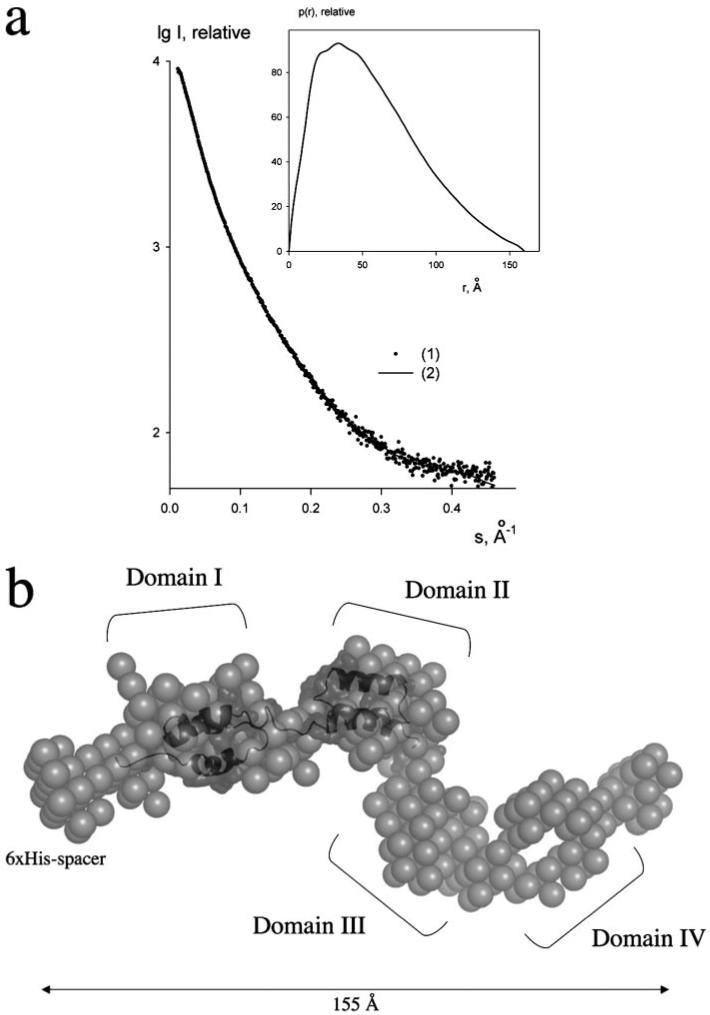
a, experimental scattering curve of Sbi-E with error bars (1) and the scattering from the ab initio model (2). The plot displays the logarithm of the scattering intensity as a function of momentum transfer s. The distance distribution function of Sbi-E calculated from the experimental data by the program GNOM is presented in the inset. b, most probable ab initio bead model of Sbi-E determined by DAMMIN (18). The four major globular domains are depicted with roman numerals. A homology model of Sbi domains I and II (shown in dark gray surface and ribbon representations) is superimposed onto the ab initio SAXS structure.
Serum Affinity Pulldown Assay
Purified Sbi-I, Sbi-II, Sbi-III-IV, Sbi-III, and Sbi-IV were each covalently coupled to a 1-ml NHS-activated Sepharose high performance column (Amersham Biosciences) according to the manufacturer’s instructions. After equilibration with phosphate-buffered saline, 5 ml of human serum (Cambrex) and serum from calf, cow, chicken, goat, horse, mouse, rabbit, or sheep (Sigma) was applied to the column. Columns were washed with phosphate-buffered saline, and bound proteins were eluted with a 0-1 m NaCl gradient over 10 ml. The binding of serum proteins by bait proteins Sbi-III-IV, Sbi-III, and Sbi-IV was analyzed using SDS-PAGE, using immobilized Sbi-I as a negative control. Size exclusion chromatography, with a Superdex-200 gel filtration column (Amersham Biosciences), was used for further purification of the bound fragments. Trypsinized protein fragments from excised gel slices were analyzed by MALDI-TOF. Protein-Lynx software was used for protein identification.
Surface Plasmon Resonance (SPR)
Complement C3/C3 derivative binding experiments were performed on a BIACore 3000 Instrument (BIACore, Life Sciences), which has four flow cells. Each experiment was run in 10 mm HEPES, pH 7.2, 3 mm EDTA, 0.01% surfactant P20 with either physiological salt (150 mm NaCl) or half-physiological salt (75 mm NaCl) at a flow rate of 20 μl/ml. Ligands molecules were covalently coupled to a CM5 sensor chip via standard amino group chemistry (BIACore), with flow cell 1 being the sham-activated and deactivated reference channel. Each experiment consisted of a 60-s analyte injection, followed by a 60-s buffer flow over the surface before the injection loop and flow cell were washed. The sensor chip surface was regenerated between experiments, with a 60-s pulse of 2 m NaCl, which brought the sensorgram signal back to base line. Each injection flowed over all four flow cell surfaces in-series and gave three sets of data (the signal of flow cell 1 being subtracted from the other sensorgrams). Control proteins C4dg, C4b, and bovine serum albumin were used to validate the specificity of C3 binding to the flow cells bearing Sbi-E, Sbi-III-IV, Sbi-III, and Sbi-IV. Affinity constants for C3dg binding to Sbi-E, Sbi-III-IV, and Sbi-IV were determined by fitting the steady-state plateau RU values of a series of C3dg analyte injections to a single-site Langmuir binding isotherm model as shown in Equation 2,
| (Eq. 2) |
using MacCurvefit version 1.5.5 nonlinear regression software.
Inhibition of the interaction between C3dg and CR2 by Sbi-III-IV was probed in saturation experiments with C3dg binding to a sensor chip bearing a recombinant two domain CR2 construct (CCP 1-2), in the absence and presence of a constant concentration (5 μm) of Sbi-III-IV as a C3dg co-analyte. The recombinant CR2 was expressed in bacteria and purified from inclusion bodies analogously to what has been described for human decay accelerating factor (20), another member of the regulators of complement activation superfamily.
Complement components used as analytes were prepared as follows: C3, purified from pooled human plasma (21), was subjected to a final chromatographic step on Mono S FPLC to separate thioester-intact native C3 from thioester-hydrolyzed conformational isoforms (22). C3b (see supplemental Fig. S1 for chain structures of the various C3 degradation fragments) was generated by limited trypsinization of native C3 (23) and conversion of C3b to iC3b employed fI (1% w/w), with fH (2% w/w) as the I-cofactor (24). To generate C3c, C3b was incubated overnight at 22 °C with fI (1% w/w) and soluble CR1 (2% w/w, a gift from Avant Immunotherapeutics, Needham, MA). Treatment of native C3 with 100 mm CH3NH2 at pH 8 for 6 h at 37 °C yields a thioester carbonyl-derivatized form of C3, denoted as C3(NHCH3), which adopts a C3b-like conformation (23). Treatment of the latter with fI and fH yields an iC3b-like species, iC3(NHCH3), in which C3a is still present. All of the aforementioned digestion products were purified via chromatography on Mono Q FPLC using previously described elution conditions (25). C3dg and C4Bdg (C4dg of the C4B isotype) were recombinantly produced in E. coli as described previously (26, 27). C3a was obtained from Calbiochem. All complement proteins used as analytes in SPR experiments were exchanged into the SPR running buffer, and separated from any minor oligomeric species formed during storage, by FPLC gel filtration on Superose 6 (Superdex 200 for C3dg and C4Bdg) within 24 h of use.
Complement Activity Assays
The Wielisa total complement system screen (Wieslab), described by Seelen et al. (28), was used to detect inhibition by recombinant fragments Sbi-E, Sbi-I, Sbi-III-IV, Sbi-III, and Sbi-IV of the classical (CP), mannose-binding lectin (MBLP), and alternative (AP) complement pathways. In this enzyme-linked immunosorbent plate-based assay of complement activation, which ultimately immunochemically detects deposition of C5b-9 onto the well, pathway-specific activation is achieved via a combination of coating the wells with pathway-selective activators and specific agents in the dilution buffers (or in the case of the classical pathway the dilution per se), which restrict initiation of complement activation to the single desired pathway. In the initial Sbi fragment screen, 1 μg of each protein was added per 1 μl of human serum (positive control serum, supplied with the kit), and assayed for complement activity after 30 min of preincubation at 37 °C. The assay was completed in duplicate, according to the manufacturer’s instructions, and included a blank, a positive control (human serum from healthy individuals), and a negative control (heat-inactivated serum). Complement activity inhibition was quantified from the absorbance at 405 nm using the equation: (sample - negative control)/(positive control - negative control) × 100%.
Assay for the Activation State of Serum C3
Purified native C3 was radioiodinated to a specific activity of ~105 cpm/μg via the lactoperoxidase method (29) using the very gentle conditions previously described for the iodination of C1q without loss of C1q functionality (30). 125I-C3 was added to undiluted fresh human serum in the ratio of 1 μl (0.3 μg) of labeled C3 to 5 μl of serum. In the initial screen, various Sbi fragments (2 mg/ml stock) were added to a final concentration of 0.63 mg/ml to aliquots of the 125I-C3-spiked serum, and these were incubated at 37 °C for 30 min, at which time EDTA was added to a final concentration of 10 mm, and the samples were placed on ice. C3 activation that was limited to the alternative pathway was assessed in the presence of 5 mm MgCl2, 10mm EGTA. Here too, complement activation was quenched by the addition of 10 mm EDTA after the incubation period. As a positive control for complement activation, heat-aggregated human IgG (10 mg/ml, 63 °C, 20 min) was added to the 125I-C3-containing serum to a final concentration of 1.4 mg/ml. After incorporation of reducing agent-containing SDS sample buffer at 100 °C for 5 min, samples were analyzed by SDS-PAGE on a “conventional” size (1.5-mm thickness, 17 cm (wide) × 14 cm (long)) 8% acrylamide gel and loading the diluted volume equivalent of 1 μl of original serum per lane to minimize gel-distortion artifacts because of very high protein concentration in the albumin region of the gel. Radioactive bands on the fixed and dried down gel were detected by PhosphorImaging.
Analysis of Covalent Adducts of 125I-C3
Two-dimensional SDS-PAGE analysis (reducing conditions, 8% acrylamide gel in both dimensions), where the second dimension follows soaking of a lane from the first dimension in 1 m NH2OH at pH 9 to cleave ester linkages, was performed as described previously (31), except that detection of radioactive spots was performed by PhosphorImaging. This analysis was performed on a 5-fold scaled-up sample of 125I-C3-containing serum that had been incubated with Sbi-III-IV and then immunoprecipitated with a rabbit polyclonal anti-Sbi-E antiserum using stringent immunoprecipitation and wash buffer conditions that sacrifice yield for specificity of antigen capture (32).
Factor I Cofactor Activity Assay
Twenty micrograms of C3(NHCH3) were incubated for 18 h at 37 °C with 0.2 μg of factor I and 2 μg of Sbi-III-IV in a volume of 40 μl of phosphate-buffered saline, pH 7.2. This quantity of Sbi-III-IV was in slight stoichiometric excess (1.15:1) relative to the target C3 derivative. Cleavage to iC3(NHCH3) (see supplemental Fig. S1 for chain structure) was assessed on reduced SDS-PAGE via the disappearance of intact α-chain, the appearance of α-40/α-43 fragments, and an increase in the intensity of the β-chain region because of the co-migration of α-76 fragment. Substitution of 0.2 μg of factor H for Sbi-III-IV served as a positive control as quantitative conversion to iC3(NHCH3) occurred using this substoichiometric amount (0.013:1) of cofactor.
Cell Fractionation and Western Immunoblot Analysis of Cellular Fractions of S. aureus Newman
Cellular fractions of S. aureus Newman and Newman spa-deficient strains were prepared as described previously (33). In brief, S. aureus Newman and Newman spa cultures were grown overnight to stationary phase in TSB with aeration (OD 1, A600 nm). Cells were harvested by centrifugation, and cell wall proteins were solubilized by incubation with lysostaphin. Protoplasts were recovered by centrifugation, and the supernatant was taken as the wall fraction. Protoplasts were lysed by vortexing and repeated pipetting, and the membrane fraction was obtained by centrifugation followed by washing and resuspension in lysis buffer. The culture supernatant was filtered through a 0.45-μm filter, and proteins were precipitated with trichloroacetic acid on ice and pelleted by centrifugation. All fractions were analyzed by SDS-PAGE and Western immunoblotting using horseradish peroxidase-conjugated rabbit IgG (Dako) at 1:15,000 dilution (140 ng/ml). F(ab′)2 fragments of rabbit polyclonal anti-Sbi-E antibodies (obtained by pepsin digestion, Pierce F(ab′)2 preparation kit) were used at a 1:1,000 dilution followed by goat antirabbit (Dako) secondary antibody at recommended dilution (1:2,000) and visualized using the chemiluminescence detection system (Roche Applied Science).
RESULTS
Domain Structure of Putative Extracellular Region of Sbi
We investigated the domain organization of the putative extracellular ligand-binding region of Sbi by SAXS using a 31-kDa construct of Sbi (Sbi-E), containing the N-terminal segment adjacent to the proline-rich region. The x-ray scattering curve for Sbi-E (Fig. 2a) yields a molecular mass estimate of 33 ± 3 kDa, indicating that the protein is monomeric in solution. The experimental Rg and the Dmax were 46 ± 1 and 160 ± 10 Å, respectively, exceeding the values expected for a compact globular protein of such molecular mass by nearly a factor of 2. The distance distribution function of Sbi-E (Fig. 2a, inset) has a skewed profile characteristic for elongated particles (13). The low resolution shape of Sbi was reconstructed ab initio using the bead modeling program DAMMIN (18). Several independent reconstructions yielded superimposable results neatly fitting the experimental data with discrepancy χ about 1.2. The most probable ab initio model, displayed in Fig. 2b, is indeed very elongated (155 Å in diameter) and depicts four bead domains connected by thinner loops. Given the low resolution of SAXS, this model should not be considered as the unique model of Sbi-E, but the elongated multidomain appearance (also observed in other independent ab initio reconstructions) clearly points to the existence of four structured domains, joined by (flexible) linkers. A homology model of the immunoglobulin-binding domains I and II of Sbi, constructed previously based on SpA domains B and E (10), superimposes well with the presented ab initio domain organization (Fig. 2b). This four-domain structure of the proposed extracellular region of Sbi has also been incorporated in Fig. 1a, with the two novel domains labeled as Sbi-III and Sbi-IV. Based on a combination of the SAXS-derived model, sequence alignments with staphylococcal SpA domains, and the minimal fragment at the C terminus of Sbi that had been shown to display binding to β2-GPI (11), we engineered five recombinant Sbi fragments spanning Sbi-E, these being Sbi-I, Sbi-II, Sbi-III-IV, Sbi-III, and Sbi-IV, respectively (Fig. 1b). As indicated in Fig. 1b, for Sbi-III and Sbi-IV 6-7-residue overlaps of putative domain boundaries were engineered into the constructs to increase the likelihood of obtaining a stably folded entity.
Fragments Sbi III-IV and Sbi-IV Bind Complement Component C3
In search of serum components that interact with Sbi (in addition to immunoglobulins and β2-GPI), an affinity pulldown assay was performed with human serum and using recombinant constructs Sbi-III-IV, Sbi-III, and Sbi-IV as bait proteins. An SDS-PAGE analysis of the serum proteins contained in the samples eluted from the Sepharose-immobilized Sbi-III-IV column is shown in Fig. 3a. An identical but fainter SDS-PAGE profile was found using a Sepharose-immobilized Sbi-IV column (Fig. 3b, left panel, lane 4). The polypeptides labeled with asterisks in Fig. 3 were identified as fragments of complement component C3 by MALDI-TOF mass spectrometry. From the SDS-PAGE profile and the origin of the peptides in the gel fractions, as identified by mass spectrometry, it appears that Sbi-III-IV binds native C3 (consisting of a 119-kDa α-chain and a 75-kDa β-chain) and some C3 cleavage products. Intriguingly, no significant protein band can be identified with a molecular weight similar to β2-GPI, the previously identified ligand for Sbi (11). The peptides originating from the C3 α-chain present in the gel fractions running at ~65 kDa, accompanied by the C-terminal α-chain fragments running at 43 and 40 kDa, suggest that Sbi binds the C3 cleavage product iC3b (see supplemental Fig. S1 for chain structures of the various C3 degradation fragments). A 29-kDa α′-chain degradation product that is the hallmark of C3c is absent from the SDS-PAGE profile. Finally, one can infer from the nonstoichiometric staining intensities of the C3-derived bands of the pulldown experiment that in addition to intact C3 and iC3b, an iC3b-like species, iC3(H2O), which originates from thioester-hydrolyzed but peptide chain-intact C3, also binds to Sbi. The presence in iC3(H2O) of an ~76-kDa chain consisting of C3a joined to α′-67 of iC3b (see supplemental Fig. S1) would contribute to the higher than expected β-chain intensity relative to α-chain, as would its α-40 chain contribute to the higher than expected intensity of this band relative to the ~65-kDa band from the iC3b that is pulled down. Because of the high relative amounts of factor I-cleaved C3 products pulled down from human serum by insolubilized Sbi-III-IV, the possibility existed that Sbi-III-IV possessed factor I cofactor activity. However, when this was assessed using thioester-cleaved C3(NHCH3) as the cleavage target for factor I, even in the presence of an equimolar concentration of Sbi-III-IV to C3(NHCH3), no factor I-mediated cleavages took place, whereas complete cleavage to iC3(NHCH3) was observed using a catalytic amount of factor H (data not shown). Thus Sbi-III-IV does not possess factor I cofactor activity.
FIGURE 3.
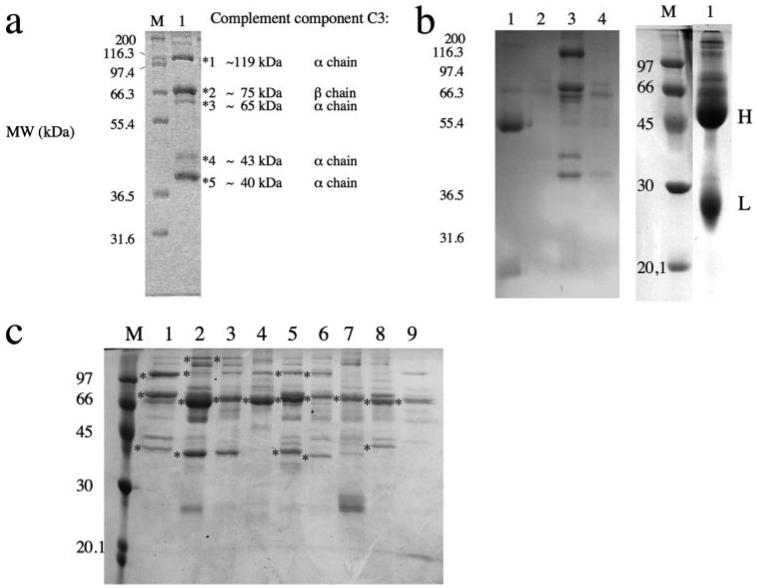
a, serum affinity pulldown assay with Sbi-III-IV. Shown in lane 1 is the SDS-PAGE analysis of the human serum protein component polypeptide chains (prey proteins) eluted from an NHS-Sepharose column with immobilized Sbi-III-IV as bait protein. Lane M shows a protein ladder of molecular weight markers. Gel bands yielding peptide fragments of complement component C3, identified by MALDI-TOF analysis, are indicated with asterisks. Also indicated is the predominant chain origin of the C3 peptide fragments. b, SDS-PAGE analysis of an affinity pulldown assay with human serum comparing Sbi-III-IV (lane 3) with NHS-Sepharose immobilized Sbi-I (left panel, lane 1), Sbi-III (left panel, lane 2), and Sbi-IV (left panel, lane 4). Shown in the right panel (lane 1) is a separate SDS-PAGE analysis of an affinity pulldown assay with human serum and Sbi-II, yielding IgG heavy (H, ~50 kDa) and light chain (L, ~25 kDa) fragments of IgG as was confirmed by MALDI-TOF analysis. c, SDS-PAGE analysis comparing affinity pulldown assays with human serum (lane 1) and sera from cow (lane 2), calf (lane 3), chicken (lane 4), goat (lane 5), horse (lane 6), mouse (lane 7), rabbit (lane 8), and sheep (lane 9), using NHS-immobilized Sbi-III-IV in all cases.
SDS-PAGE and MALDI-TOF mass spectrometry analysis of the serum proteins contained in the samples eluted from Sepharose-immobilized Sbi-I (see Fig. 3b, left panel, lane 1) and Sbi-II columns (Fig. 3b, right panel, lane 1) were identified as immunoglobulins. The latter result confirms, for the first time, the prediction by Zhang et al. (9) that Sbi-II is indeed an immunoglobulin-binding domain. Affinity pulldown experiments using a Sepharose-immobilized Sbi-III column yielded no protein bands that were identifiable with MALDI-TOF (see Fig. 3b, left panel, lane 2), localizing the C3-binding properties of Sbi to the C-terminal Sbi-IV domain (Fig. 3b, left panel, lane 4). We also found that the complement C3 binding characteristics of Sbi are not unique to human C3. C3, and its degradations products, were identified by MALDI-TOF analysis in affinity pulldown experiments with sera from cow, calf, goat, horse, mouse, and rabbit (see Fig. 3c). Intriguingly, in these experiments a weak band with a molecular weight similar to β2-GPI (~45 kDa) can be seen in some lanes on the gel shown in Fig. 3c. Although it is specifically prominent in cow serum (Fig. 3c, lane 2), it could not be identified as β2-GPI by MALDI-TOF. Interestingly, Zhang et al. (11) first discovered the interaction between Sbi and β2-GPI using bovine serum. In their paper an SDS-PAGE analysis of proteins from human serum, bound by an Sbi fragment lacking the IgG binding regions, shows a band with a high staining intensity at a molecular weight similar to C3, and several faint bands that could be C3 degradation products.
To verify the binding of Sbi to human C3 and its degradation products, and to identify its site of interaction, constructs Sbi-E, Sbi-III-IV, Sbi-III, and Sbi-IV were immobilized on biosensor chips and subjected to SPR binding experiments with native C3 and sequential proteolytic cleavage products C3b, iC3b, C3c, and C3dg (see supplemental Fig. S1 for chain structures). When approximately the same number of molecules of the constructs Sbi-III-IV, Sbi-III and Sbi-IV were immobilized in each flow cell, very little binding of C3 and its degradation products was observed with the Sbi-III construct (Fig. 4a, middle panel), confirming the results from the affinity pulldown experiments. Sbi-III-IV (Fig. 4a, left) and Sbi-IV (Fig. 4a, right) essentially display the same C3 interaction characteristics with the weakest binding to C3c and C3b and strongest to iC3b and C3dg, suggesting that the main binding site for Sbi in intact C3 may be located within C3dg and becomes more accessible in the smaller C3dg fragment. Grossly similar data to that obtained for the Sbi-III-IV and Sbi-IV channels were obtained when the C3 fragment scan was done on a chip bearing Sbi-E (see supplemental Fig. S2), except in this case there was less relative binding of native C3,. The C3 fragment specificity was further confirmed by the lack of binding of bovine serum albumin, and the human complement C4-derived fragments C4b and C4dg, the latter being a structural homologue of the binding-competent C3dg fragment (data not shown).
FIGURE 4.
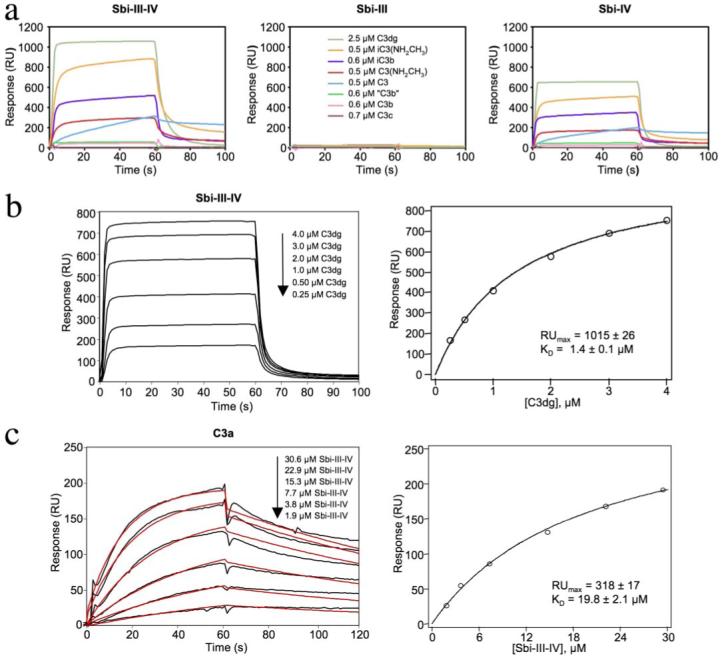
a, sensorgrams showing the relative binding between sensor chip-immobilized Sbi-III-IV (~1800 RU), Sbi-III (~800 RU), and Sbi-IV (~800 RU) with the complement C3 derivatives as follows: native C3, C3b, iC3b, C3c, C3dg, methylamine-reacted C3 (C3(NHCH3)), iC3(NHCH3), and trypsinized C3(NHCH3) (denoted as “C3b”) under physiologic NaCl concentration. The analytes were all employed at a concentration of 0.1 mg/ml, but the legend key indicates their molar concentrations. Although C3dg was used at a molar concentration that is 4-5-fold greater than the other fragments showing substantial binding, its molecular mass, and therefore signal change per molecule bound, is 4-5-fold less than that of the other fragments. The net result is that the rank order of fragment binding apparent from visual inspection of the Sbi-III-IV and Sbi-IV panels is, to a first approximation, accurate. b, steady-state analysis of the interaction of C3dg with sensor chip-bound Sbi-III-IV (~1200 RU). RU values determined from the steady-state plateau region (left panel) were plotted as a function of analyte (C3dg) concentration (right panel), and the data were fit by nonlinear regression according to the single site Langmuir binding model (Equation 2, “Experimental Procedures”). The KD value was 1.4μm. c, analysis of the direct interaction of Sbi-III-IV with sensorchip-immobilized C3a. The black curves shown (left panel) represent the net binding after the subtraction of the nonspecific binding on the sham-activated control channel. The red lines represent an attempt to globally fit the kinetic data to a 1:1 Langmuir binding model (BIAevaluation 3.0), but as is apparent from the deviation of the experimental and theoretical lines, the data could not be fit by this or any other model in the BIAevaluation analysis package (χ2 = 22.8, good fits have c2 values ≤2). Plot of the RU values at the end of the injection phase versus the concentration of the Sbi-III-IV analyte (right panel) is shown. The data were fit by nonlinear regression according to a single site Langmuir binding model (Equation 2, “Experimental Procedures”), yielding a KD value of 19.8 μm. In both panels b and c the ± values indicate the error estimates of the fitting procedure for a given parameter.
Sbi association with most C3 fragments seemed to follow two phases as follows: an initial fast binding followed by a slow binding phase. Only the binding of C3dg reached a clear steady-state plateau during the injection phase. This equilibrium state binding data could be well fit to a single-class Langmuir binding site binding model, an example of which for Sbi-III-IV is shown in Fig. 4b. The interactions with C3dg were of moderate affinity with KD values for Sbi-E of 0.9 (±0.07) μm and 1.6 (±0.13) μm at half- and full-physiological NaCl concentrations, respectively, and for Sbi-III-IV of 0.7 (±0.06) μm and 1.4 (±0.02) μm under the same two ionic strength conditions. For Sbi-IV, the interaction with C3dg had a KD of 0.8 (±0.02) μm at physiologic ionic strength (supplemental Fig. S3).
When injected at the same concentrations over sensor chip surfaces with immobilized Sbi-E, Sbi-III-IV, and Sbi-IV, all three Sbi constructs bound C3 better than C3b (data for Sbi-III-IV and Sbi-IV shown in Fig. 4a and for Sbi-E supplemental Fig. S2). Particularly noteworthy was the very slow dissociation rate displayed by native C3, suggesting that quite a stable complex had formed. The association phase kinetics were also substantially slower for native C3 than for any of the other binding-positive C3 derivatives. To explore whether the difference in binding behavior between native C3 and C3b is dependent primarily on conformation, or because of a distinct binding contribution by the C3a anaphylatoxin fragment, purified native C3 was treated with methylamine to produce a thioester-cleaved form (C3(NHCH3)) that takes on a C3b-like conformation (23) but with the C3a fragment still attached. C3(NHCH3) showed considerably higher binding than did C3b (Fig. 4a and supplemental Fig. S2), indicative of a direct role for C3a in the binding. When C3(NHCH3) is trypsinized to release C3a, this “C3b” showed poor binding analogous to C3b generated from C3. Similarly, binding of iC3b by Sbi was significantly enhanced by the presence of C3a in the methylamine-treated C3 conversion product iC3(NHCH3). Direct binding experiments with sensor chip-immobilized C3a confirmed the binding of the anaphylatoxin fragment by Sbi-III-IV (Fig. 4c, left panel). Attempts to analyze the kinetics in terms of a simple 1:1 Langmuir binding model did not yield acceptable fits, especially for the dissociation phase where some rebinding of Sbi-III-IV to the C3a surface may have been occurring. Although a steady-state plateau has not been fully reached, a plot of RU at the end of the injection phase versus concentration of Sbi-III-IV, shown in Fig. 4c (right panel), indicates that the binding is saturable. Analysis of these data in terms of a single class Langmuir binding isotherm suggests a KD of 19.8 (±2.1) μm for the interaction between Sbi-III-IV and C3a, at physiologic ionic strength, although this is likely an underestimate given that equilibrium had not been fully reached.
Sbi III-IV Binding to C3dg Inhibits Interaction of the Latter with Complement Receptor 2
The C3 derivative binding behavior of Sbi-E, Sbi-III-IV, and Sbi-IV shows similarities with complement receptor CR2, except that CR2 does not bind native C3 (34). Interestingly, the interaction between C3dg and chip-immobilized CR2 is hindered when Sbi-III-IV is present as a co-analyte (Fig. 5). Specifically, a “lag phase” in the saturation curve is observed when the molar ratio of C3dg to Sbi-III-IV is less than 1:1. At C3dg concentrations with a molar excess over Sbi-III-IV, the maximal saturation level overlaps that of the standard C3dg binding curve, indicating that the inhibitory effect of Sbi-III-IV is because of direct binding to C3dg, as opposed to an interaction between Sbi-III-IV and CR2.
FIGURE 5. Inhibition of the binding of C3dg to CR2 by Sbi-III-IV.
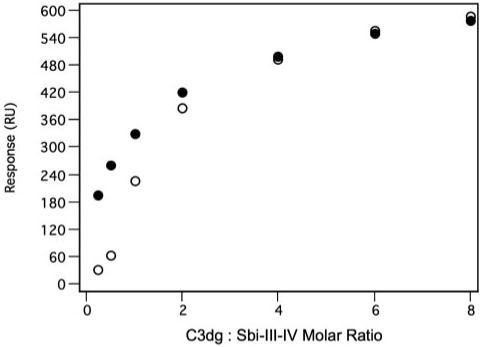
Shown is the displacement of a standard C3dg saturation curve (closed circles) binding to a sensor chip with immobilized CR2 (~1500 RU of a recombinant protein consisting of CCP domains 1 and 2) in the presence of a constant concentration (5 μm) of Sbi-III-IV as co-analyte (open circles).
Sbi-E and Sbi III-IV Inhibit All Three Pathways of the Complement System
To determine whether the C3 binding properties of Sbi interfere with complement activation, we examined the effect of the constructs Sbi-E, Sbi-III-IV, Sbi-III, and Sbi-IV, all incubated with human serum at 1 mg/ml, on activation of the CP, MBLP, and AP. Immunoglobulin binding construct Sbi-I was used as negative control in these experiments. Preincubation of human serum at 37 °C with two of the three recombinant constructs that bind C3 (Sbi-E and Sbi-III-IV) dramatically reduced the activity of all three pathways (CP, 4 and 3% residual activity; MBLP, 2 and 1% residual activity; AP, 0% residual activity with both Sbi-E and Sbi-III-IV, respectively), as is shown in Fig. 6a. The observed complement inhibition is dose-dependent for all Sbi constructs (Fig. 6b), and removal of their N-terminal tag had no effect. The strongest inhibition was observed with Sbi-III-IV, having an IC50 of ~140 nm (alternative pathway). Remarkably, in the absence of Sbi domain III, the Sbi-IV construct shows a 300-fold weaker inhibition (IC50 ~ 33 μm) but quite selective blockage of the alternative pathway, although some inhibition of the MBL and classical pathways is also observed at high concentration (Fig. 6a). Although we have not been able to show a direct interaction between Sbi domain III and complement component C3, our results suggest that the union of both domains III and IV is essential for the interference of Sbi with all three complement pathways.
FIGURE 6.
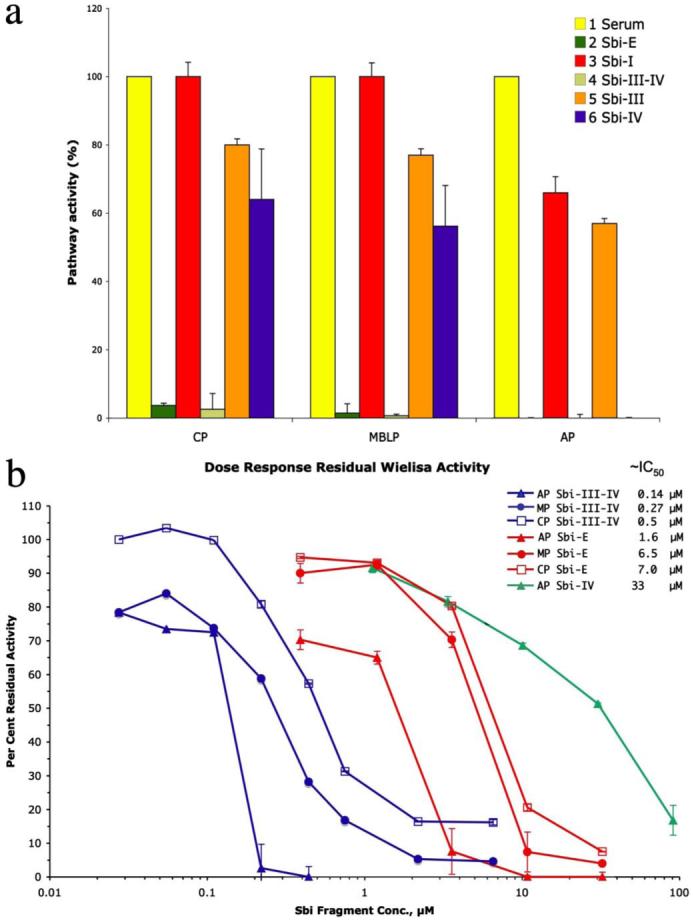
a, results from complement inhibition assays for the CP, MBLP, and AP complement pathways with constructs Sbi-E, Sbi-I, Sbi-III-IV, Sbi-III, and Sbi-IV. Human serum, preincubated with the Sbi fragments at (~1 mg/ml final concentration) for 30 min at 37 °C was assessed for residual pathway-specific complement activity using the Wielisa enzyme-linked immunosorbent assay plate-based assay. The activity detected for the positive control (untreated human serum) in all the three pathways was set at 100%. b, concentration dependence of pathway-specific complement inhibition by Sbi-E, Sbi-III-IV, and Sbi-IV, as assessed, as above, in the Wielisa assays. The concentrations estimated from interpolation of the respective dose-response curves to give 50% inhibition in (IC50) are provided in the legend key.
The above results could reflect either an inhibition of complement activation by the pathway-specific activators present on the wells of the Wielisa assay plate, or they could result from a consumption of complement during the preincubation period that preceded exposure of subsequently diluted serum samples to the respective complement-activating surfaces. To distinguish between these two possibilities, normal human serum was spiked with 125I-C3 and incubated with Sbi-E, Sbi-III-IV, Sbi-III, and Sbi-IV at 37 °C for 30 min at concentrations similar to those of the preincubation step prior to the Wielisa assays depicted in Fig. 6a. The same incubations were also done in the presence of Mg2+-EGTA, which limits complement activation to the alternative pathway, as well as in the presence of EDTA, which should inhibit all three pathways of complement activation. An SDS-PAGE autoradiographic analysis of this experiment is shown in Fig. 7a. Although C3b is the first major cleavage product of native C3, it is not stable in serum because it becomes rapidly cleaved by factor I to iC3b in the presence of cofactor H. The characteristic chains of iC3b are β, α′-67, and α-43 (which ultimately goes to α-40, see supplemental Fig. S1), of which it can be seen from the marker lanes at the right of the figure, only β and α′-67 are significant targets of label incorporation in the radioiodination procedure. This experiment clearly shows that in the case of both Sbi-E and Sbi-III-IV, the near total inhibition seen in all three pathway-specific Wielisa assays was because of consumption of complement, as in each case there was a prominent α′-67 band present and essentially no native C3 left. The latter is characterized not only by the presence of a band corresponding to intact α-chain, but also by the presence of a denaturation-induced 45-kDa autolytic cleavage fragment that is indicative of the presence of thioester bond-intact C3 (35). Even in the presence of Sbi-E and Sbi-III-IV, if EDTA is present during the incubation to prevent complement activation, the vast majority of C3 remains in the native state. The extent of C3 activation was considerably greater for both Sbi-E and Sbi-III-IV than for the “positive” control of heat-aggregated IgG. Furthermore, the results in the presence of Mg2+-EGTA indicate that activation solely via the alternative pathway is sufficient to consume all of the native C3 within the 30-min incubation period. By contrast, preincubations with Sbi-III and Sbi-IV produced a degree of C3 activation, which as judged from the relative intensity of the α′-67 band was either comparable (Sbi-III) or just slightly greater (Sbi-IV) to that observed in the sham 37 °C incubation control. The lack of C3 activation in the Sbi-III sample is consistent with both its inability to bind to any C3 derivative, as well as its lack of substantial inhibitory activity toward any complement pathway (Fig. 6a). By contrast, the strong inhibitory activity of Sbi-IV toward the alternative pathway (Fig. 6a) cannot be accounted for through its induction of a major consumption of complement. This suggests an inhibitory mechanism that either is mediated through the binding of Sbi-IV to C3 or to another alternative pathway component. Fig. 7b shows that the observed C3 consumption by Sbi-E and Sbi-III-IV, under alternative pathway conditions, is dose-dependent for both constructs (again no C3 consumption is observed with Sbi-IV). Quantification of the C3 bands in Fig. 7b is shown in supplemental Fig. S4. The concentrations of Sbi fragment resulting in 50% activation of C3 via the alternative pathway are ~1.5 and ~3 μm for Sbi-III-IV and Sbi-E, respectively. Although these values are higher than the IC50 values obtained in the Wielisa assays (Fig. 6b) for the same Sbi constructs, the Wielisa alternative pathway assays are going to be sensitive to not only the concentration of residual native C3 but also residual fB.
FIGURE 7.
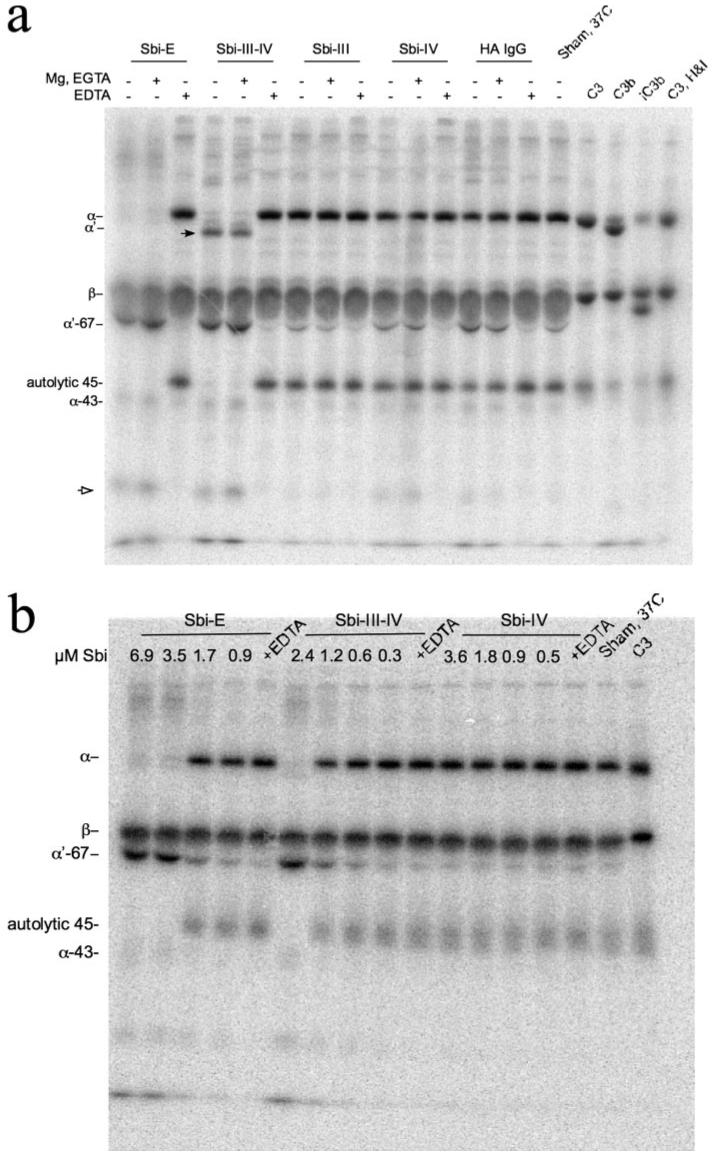
a, phosphorimage of SDS-PAGE of 125I-C3 spiked serum samples incubated with various Sbi constructs (Sbi-E, Sbi-III-IV, Sbi-III, and Sbi-IV, all at a final concentration of 0.63 mg/ml) at 37 °C for 30 min. Additives, indicated by the + symbol above a lane, were 5 mm MgCl2, 10 mm EGTA, or 10 mm EDTA. Also shown are sham 37 °C-incubated 125I-C3 spiked serum samples (no Sbi fragment added), a heat-aggregated (HA) IgG positive control (1.4 mg/ml), and standards for purified C3 and its proteolytic products C3b and iC3b. Native 125I-C3, after incubation with fH (2% w/w) and fI (1% w/w) for 2 h at 37 °C, appeared substantially the same as the untreated sample in terms of the α/β-chain intensity ratio. Had there been a significant quantity of C3(H2O) present in the radioiodinated native C3, the generation of the α-76 fragment of iC3(H2O) would have altered this ratio. The positions of the various C3 α- and β-chain proteolytic degradation products, as well as that of the autolytic 45-kDa fragment, are indicated. The black arrowhead marks a species in the Sbi-III-IV incubation lanes that migrates slightly ahead ofα′-chain and is discussed in the text. The open arrowhead likely denotes an α′-67 secondary proteolytic degradation product. b, phosphorimage of SDS-PAGE of 125I-C3 spiked serum samples incubated with various concentrations of Sbi constructs Sbi-E, Sbi-III-IV, and Sbi-IV (at 37 °C for 30 min) showing dose-dependent C3 consumption under Mg2+-EGTA conditions. The quantification of the C3 bands for the latter experiment is shown in supplemental Fig. S4.
Sbi-III-IV Is a Prominent Transacylation Target of C3
A distinctive feature of the 125I-C3 banding pattern observed when Sbi-III-IV is incubated with serum, or serum containing Mg2+-EGTA, is the presence of a prominent band (denoted in Fig. 7a by the black arrowhead) migrating slightly faster than α′-chain. Indeed, relatively faint bands corresponding in migration to residual α- and α′-chain are visible above the band marked by the arrowhead. It can also be seen in the Sbi-E and Sbi-III-IV lanes of Fig. 7a that in the respective pairs of lanes showing C3 activation, there are bands present of greater molecular mass than intact α-chain, which are distinct from any such bands present in the EDTA control lanes. We hypothesized that these C3 activation-associated bands might be covalent adducts of C3 α′-chain, and its subsequent serum degradation products. Furthermore, given that the molecular mass of Sbi-III-IV was ~17 kDa, the migration behavior of the band denoted by the black arrowhead in Fig. 7a was consistent with it being an ester-liked adduct of Sbi-III-IV to α′-67 chain. We tested this hypothesis by a combined immunoprecipitation and two-dimensional SDS-PAGE analysis that allows identification of the C3 fragment origin of ester-linked adducts.
From a time course experiment, we determined that the 125I-C3 banding pattern seen in Fig. 7a when Sbi-III-IV was incubated with serum containing Mg2+-EGTA was already present after 5 min (data not shown). This reaction was done in a scaled up fashion, and a portion of it was subjected to immunoprecipitation with either rabbit anti-Sbi-E anti-serum or with a nonimmune rabbit serum control. A one-dimensional SDS-PAGE analysis of the immunoprecipitation experiment is shown in Fig. 8a. It can be seen that the candidate Sbi-III-IV adduct band of C3 (indicated by black arrow in the pre-IP lane of Fig. 8a) is specifically brought down, together with β-chain, by the anti-Sbi-E antibody. One should also note the absence in the anti-Sbi-E lane of the α′-67 band that is prominent in the preimmunoprecipitation lane. At greater contrast adjustment than that used for optimal display of Fig. 8a, the higher molecular weight band denoted by the open arrowhead in the preimmunoprecipitation lane is also visible in the anti-Sbi-E lane. This is more clearly evident in the “reference” one-dimensional lanes at the left of Fig. 8b, this gel having been exposed to the phosphorimage screen ~2-fold longer than the experiment depicted in Fig. 8a. This band may represent the original α′-chain adduct of Sbi-III-IV.
FIGURE 8. Analysis of Sbi-III-IV adducts of C3.
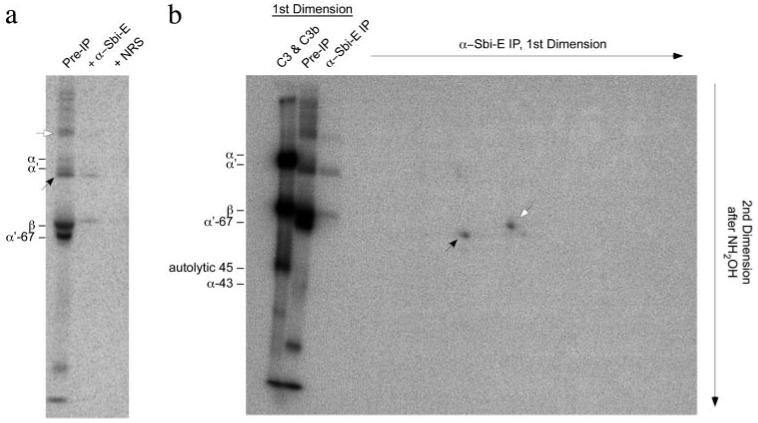
a, one-dimensional SDS-PAGE (reducing) phosphorimage (2-week exposure) of C3-derived bands immunoprecipitated by anti-Sbi-E from 125I-C3-spiked serum, made with 5 mm MgCl2, 5 mm EGTA, and incubated with Sbi-III-IV (0.63 mg/ml, 5 min, 37 °C). Also shown is the sample prior to immunoprecipitation, as well as an immunoprecipitation done with a nonimmune rabbit serum (NRS). The two major candidate Sbi-III-IV adduct bands in the pre-IP lane are denoted by the black and open arrowheads. b, two-dimensional SDS-PAGE (reducing) phosphorimage analysis (4-week exposure) of anti-Sbi-E-immunoprecipitated (IP) material from an equivalent sample to that used in a. The off-diagonal spot corresponding to α′-67 is denoted by the black arrowhead. The on-diagonal spot corresponding to β-chain is denoted by the open arrowhead. Reference one-dimensional lanes, before and after specific immunoprecipitation with anti-Sbi-E, are shown on the left. The far left one-dimensional lane is of a 1:1 mix of purified 125I-C3 and 125I-C3b meant to mark the positions of α- and α′-chains. Unfortunately, because of the disproportionately high signal strength in this lane, the α-/α′-doublet bands have merged.
Having established the specificity of the immunoprecipitation, a first dimension lane equivalent to the anti-Sbi-E immunoprecipitation lane of Fig. 8a was soaked in 1 m NH2OH at pH 9 to cleave any ester bonds. If radioactive C3 bands were originally ester-linked to Sbi-III-IV, they will migrate “off diagonal” in the second dimension of SDS-PAGE. The results of this two-dimensional experiment are shown in Fig. 8b and indicate that the major off-diagonal spot (indicated by black arrow) migrates at a position in the second dimension corresponding to C3 α′-67, thus confirming the hypothesis that nascently activated C3b transacylates onto Sbi-III-IV but subsequently gets degraded to an iC3b adduct of Sbi-III-IV.
Sbi Is Not Associated with the S. aureus Cell Wall
If Sbi is indeed associated with the S. aureus cell surface, as was suggested previously (9), the ability of the extracellular region of Sbi to activate the human alternative pathway would be deleterious for the organism. To elucidate this paradox we re-examined the cellular fractions of S. aureus for the presence of Sbi. Two strains of S. aureus were used in this analysis as follows: a wild type Newman strain in which both SpA and Sbi would be present as IgG-binding proteins, and an spa-deficient Newman strain in which Sbi is the only IgG-binding protein synthesized. Western blot analysis of fractionated cells from both strains, and using horseradish peroxidase-conjugated rabbit IgG as the probe for the presence of Sbi and SpA, is shown in Fig. 9. It can be seen that for the spa-deficient Newman strain of S. aureus no Sbi is observed in the cell wall fraction (Fig. 9b). By contrast, the same fractionation procedure of the wild type Newman strain of S. aureus clearly showed probe binding to the cell wall fraction, reflecting the presence of SpA in this fraction (Fig. 9a). Although the Sbi protein is abundantly present in the total protoplast and protoplast membrane fractions of the spa-deficient strain, it is also readily detectable in the culture supernatant. Similar results showing the absence of Sbi in the cell wall fraction, and its presence in the secretions, were obtained in an independent experiment in which the various fractions from the spa-deficient Newman strain were assessed by Western blot using an F(ab′)2 derivative of a rabbit anti-Sbi-E as the primary antibody (data not shown). Unlike SpA, Sbi only binds antibody Fc fragments (10), and thus detection of Sbi by the F(ab′)2 must be antibody combining site-mediated. In the F(ab′)2 experiment, a dilution series of Sbi-E was also run, which in turn allowed the concentration of secreted Sbi in the medium to be estimated at ~50 ng/ml, corresponding to ~1nm.
FIGURE 9. Western immunoblot analysis of cellular fractions of S. aureus Newman and Newman spa for IgG binding.
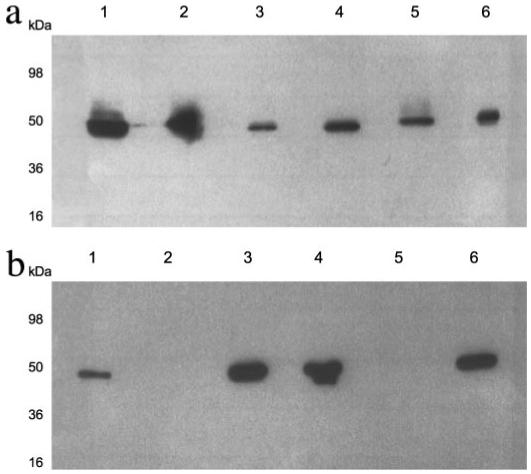
Cell envelopes of S. aureus Newman (a) or Newman spa (b) were separated into cell wall (lane 2), protoplasts (lane 3), protoplast membranes (lane 4), and cytoplasm fractions (lane 5) and analyzed by SDS-PAGE. A whole cell lysate (lane 1) and a concentrated supernatant representing secreted proteins (lane 6) were also included. Gels were analyzed by Western blotting with peroxidase-conjugated rabbit IgG. Approximate molecular weights are indicated.
DISCUSSION
By promoting phagocytosis and local inflammatory responses, the complement system is one of the key components of the innate immune defense against microbial pathogens. Recent studies have identified a number of relatively small excreted protein factors that are expressed by the human pathogen S. aureus and that prevent complement-mediated defense mechanisms against this microorganism (36). Interestingly, these excreted staphylococcal proteins have different modes of action, perhaps reflecting the evolutionary pressure on the microorganism to subvert the microbial clearance mechanisms of complement at multiple levels. To illustrate this point, a few examples are given here. Staphylococcal superantigen-like protein 7 (SSL7) binds C5 and in so doing inhibits the complement-mediated bactericidal activity of human serum (8), probably by preventing its cleavage by C5 convertases. The chemotaxis inhibitory protein of S. aureus (6) binds to the C5a receptor on phagocytes in a way that prevents signaling via the potent complement inflammatory agent C5a. Staphylococcal complement inhibitor (7) binds to the classical (C4b2a) and alternative (C3bBb) pathway C3 convertases at a bacterial surface and thereby inhibits their enzymatic activity. This prevents the deposition of C3b at the bacterial surface, which in turn would have normally facilitated attachment of the bacterium to CR on phagocytes. Finally, the extracellular fibrinogen-binding protein Efb and its recently discovered homologue Ehp recognize the C3d region within not only C3b but also in native C3 (5, 37, 38). It has recently been suggested that when bound to native C3, both Efb and Ehp induce a conformation that can no longer participate in the downstream activation processes of complement (37, 38). Our current study on Sbi establishes that this excreted S. aureus protein not only interferes directly with the adaptive immune system via two N-terminally located immunoglobulin-binding domains but also utilizes domain Sbi-IV, with some ancillary role played by Sbi-III, to interact with complement component C3, thereby joining the group of molecules excreted by S. aureus that target C3, the central molecule of all pathways of complement.
There appear to be multiple potential mechanisms through which Sbi might contribute to the evasion by the microorganism of complement-mediated clearance. Based on our in vitro binding data, Sbi interacts with C3 minimally via contacts in subfragments C3dg and C3a, which in turn correspond roughly to the thioester (TED/C3d) and anaphylatoxin domains visible in the x-ray structure of native human C3 (39). Sbi binding to C3dg in the context of iC3b could interfere with the attachment of iC3b-opsonized bacteria to CR3 and CR4 on macrophages and neutrophils. Poor binding of Sbi to the C3b fragment likely precludes a role for it in blocking the interaction between C3b-opsonized S. aureus and CR1 on both phagocytes and on human red cells, the latter acting as transporters of C3b-opsonized complexes from the bloodstream to the Kupffer cells of the liver. However, the truly novel complement evasion mechanism that our study has uncovered for Sbi is that of a “futile” consumption of complement, predominantly via the fluid-phase activation of the alternative pathway. This was readily seen with Sbi-E and with Sbi-III-IV but not with Sbi-IV (Fig. 7). Because Sbi-IV was nevertheless strongly inhibitory in an assay measuring alternative pathway activation (Fig. 6), its mechanism of action seems to be somewhat similar to those of the staphylococcal Efb and Ehp proteins, the other excreted proteins with binding specificity for the C3d region and, similar to Sbi, also having a binding preference for native C3 over C3b (37, 38).
When Sbi-III-IV is incubated with serum, a surprisingly large fraction of the total C3 activated ends up as a covalent adduct of Sbi-III-IV (Figs. 7a and 8). Although the predominant adduct band seen is that of α′-67 of iC3b, the initial Sbi-III-IV adduct must have been to the α′-chain of nascently activated C3b, as only this molecule is capable of undergoing the covalent binding reaction (40). It is possible that as an adduct of Sbi-III-IV, the rate at which C3b is converted to iC3b by the regulatory enzyme fI, and its fH cofactor, is slowed relative to C3b in the fluid phase. This is indeed what occurs when C3b forms a covalent adduct with IgG (41). A delay in the inactivation of C3b would in turn allow it to act as a subunit of the properdin-stabilized alternative pathway C3 convertase, C3bBbP, leading to the consumptive cleavage of many molecules of native C3. The fact that neither C3 consumption nor covalent adduct formation occurred in the absence of the non-C3-binding Sbi-III domain being linked to Sbi-IV on the one hand indicates a correlation between C3b-Sbi adduct formation and C3 consumption, and on the other hand suggests that the Sbi-III may contribute the transacylation target hydroxyl group.
Because of the very short lifetime of the transacylation-capable form of nascent C3b, estimated to be <100 μs (42), in order for a particular molecule to be a dominant transacylation target, either the C3 convertase needs to be associated with the transacylation target or the native C3 substrate of the convertase has to be preassociated with its transacylation target. Because Sbi-III-IV was shown to bind native C3, and because the alternative pathway is always initiating via the formation of C3(H2O)Bb species in serum (43), proteolytic cleavage by the latter of the C3 preassociated with Sbi-III-IV may be the initiating trigger of the futile complement consumption. An alternative possibility, suggested in part by the slower association phase kinetics of native C3 binding to Sbi-III-IV (Fig. 4a), is that the binding of native C3 to Sbi-III-IV induces a conformational change. Rather than inactivating the molecule, as appears to be the case when either Efb or Ehp bind C3 (37, 38), Sbi-III-IV binding to C3 actually induces an fB-binding conformation. In such a scenario the convertase forms in association with the Sbi-III-IV, and when this cleaves a molecule of native C3, because of proximity, the Sbi-III-IV becomes a preferred transacylation target.
Sbi-E added to serum would recruit immunoglobulin G via its binding sites for the latter in domains Sbi-I and Sbi-II. Because IgG is a good transacylation target for nascent C3b, and because IgG-C3bBbP has a prolonged lifetime relative to C3bBbP (41, 44), some of the covalent adducts might be to IgG rather than to the Sbi-E molecule. Distributing the C3b adducts, and their subsequent degradation fragments, between two types of molecules may account for the lack of a dominant radioactive adduct band when serum was incubated with Sbi-E, rather than Sbi-III-IV. Unfortunately, the IgG binding property of Sbi-E precluded the identification of Sbi-E adducts of C3 activation, and secondary degradation products, via use of the immunoprecipitation approach that was successful in identifying the Sbi-III-IV adducts of C3 α′-67 chain.
The ability of the extracellular region of Sbi to activate the human alternative pathway poses an important question: if, as earlier reported by Zhang et al. (9), Sbi is tethered to the cell surface of S. aureus, how would it be advantageous to the microorganism to have a C3 (and ultimately a C5) convertase in essence specifically targeted to its own surface? Here we present data that throw doubt on the claim that Sbi is an S. aureus surface protein by showing that Sbi is present in the protoplast and in the culture growth medium but not in the cell wall fraction (Fig. 9). This implies that S. aureus may deploy Sbi as an “anti-missile flare” decoy, causing futile complement consumption in the environs of the bacteria during invasion of the host. Our finding that most of Sbi is present in the protoplast membrane fraction indicates that although the expression of Sbi is sufficient in the stationary growth phase, secretion of the amount of protein necessary for maximal C3 consumption (at ~1000× higher Sbi concentration than found in extracellular fraction) may require a different growth phase and/or interaction with host proteins during infection or with host elements that limit diffusion of Sbi during infection. This question will be the subject of future studies.
It is now accepted that the interaction of antigen-associated C3dg (or iC3b) with CR2 on B-cells and follicular dendritic cells is necessary for an optimal antibody response and for the induction of immunological memory (45, 46). Our finding that the binding of Sbi-III-IV to C3dg inhibits the ability of the latter to bind to CR2 suggests a disruption of this crucial bridge linking the innate and adaptive immune systems and thus provides yet another mechanism through which S. aureus can evade the human immune system. Recently, the x-ray crystal structure of the C3d-binding C-terminal domain of the S. aureus excreted protein Efb (Efb-C) has been published, both as a free entity and in complex with human C3d fragment (38). Efb-C is a three-helix bundle protein in which the side chains of a series of mostly basic residues (plus one crucial asparagine side chain) that are derived from helix 2 form the primary contacts with C3d. These residues interacted with an acidic residue-lined pocket on the concave surface of the dome-shaped C3d formed by two separate clusters of amino acids, Asp-1029, Glu-1030, Glu-1032, and Asp-1156, Glu-1159, Glu-1160. Mutagenesis studies had previously identified Glu-1030, Glu-1032, Asp-1156, and Glu-1159 (C3d numbering: Glu-37, Glu-39, Asp-163, and Glu-166) as being vital for the ability of iC3b and C3dg to bind to CR2 (47). If Sbi-IV were to interact with C3d within the same region, it would explain our observations regarding the ability of Sbi-III-IV to competitively inhibit the binding of C3dg to CR2 (Fig. 5). This question will be the subject of future studies.
Insights gained here regarding the architecture of the Sbi molecule, the localization of its IgG and C3-binding sites, its characterization as a secreted molecule, and the characterization of a novel mechanism through which Sbi subverts the complement system will impact our understanding of S. aureus infections and immune evasion in humans and in animals of economic importance, as well as advance the design of S. aureus vaccines. Our observations on the inhibition of the human alternative pathway of complement activation by Sbi-IV may offer a promising lead for development of therapies for complement-mediated acute inflammatory diseases.
Acknowledgments
We thank Jenna Slinn at University of West England, Bristol, UK, for MALDI-TOF analysis and Dr. Anneke Lubben for micro-TOF mass spectrometry analysis. Prof. M. C. Enright (Imperial College London, UK) is gratefully acknowledged for providing Staphylococcus aureus genomic DNA. We also thank Amardeep Rana (University of Toronto, Canada) for generously providing recombinant CR2. We are grateful to Drs. Eric Yang and Daniel J. Dumont of the Centre for Proteomic and Genomic Studies, Sunnybrook Health Sciences Centre, Toronto, Canada, for generous access to their Biacore 3000 instrument. Access to the DESY-EMBL beam lines was supported by the European Community-Research Infrastructure Action under the FP6 “Structuring the European Research Area Programme” Contract RII3/CT/2004/5060008.
Footnotes
This work was supported in part by Biotechnology and Biological Sciences Research Council Research Grant BBS/B/12121 (to J. M. H. v. d. E.), Canadian Institutes of Health Research Grant MOP-7081 (to D. E. I.), and Wellcome Trust grant 076124 (to S. B.). The costs of publication of this article were defrayed in part by the payment of page charges. This article must therefore be hereby marked “advertisement” in accordance with 18 U.S.C. Section 1734 solely to indicate this fact.
The on-line version of this article (available at http://www.jbc.org) contains supplemental Figs. S1-S4.
- SpA
- Staphylococcus protein A
- Sbi
- Staphylococcus aureus binder of immunoglobulin
- Efb
- extracellular fibrinogen-binding molecule
- SAXS
- small angle x-ray scattering
- CP
- classical pathway
- MBLP
- mannose-binding lectin pathway
- AP
- alternative pathway
- RU
- response units
- CR
- complement receptor
- MALDI-TOF
- matrix-assisted laser desorption ionization time-of-flight
- SPR
- surface plasmon resonance
- NHS
- N-hydroxysuccinimide
- β2-GPI
- β2-glycoprotein I
REFERENCES
- 1.Foster TJ. Nat. Rev. Microbiol. 2005;3:948–958. doi: 10.1038/nrmicro1289. [DOI] [PubMed] [Google Scholar]
- 2.Sasso EH, Silverman GJ, Mannik M. J. Immunol. 1991;147:1877–1883. [PubMed] [Google Scholar]
- 3.Silverman GJ, Goodyear CS, Siegel DL. Transfusion (Bethesda) 2005;45:274–280. doi: 10.1111/j.1537-2995.2004.04333.x. [DOI] [PubMed] [Google Scholar]
- 4.Goward CR, Scawen MD, Murphy JP, Atkinson T. Trends Biochem. Sci. 1993;18:136–140. doi: 10.1016/0968-0004(93)90021-e. [DOI] [PubMed] [Google Scholar]
- 5.Lee LY, Liang X, Hook M, Brown EL. J. Biol. Chem. 2004;279:50710–50716. doi: 10.1074/jbc.M408570200. [DOI] [PubMed] [Google Scholar]
- 6.de Haas CJ, Veldkamp KE, Peschel A, Weerkamp F, Van Wamel WJ, Heezius EC, Poppelier MJ, Van Kessel KP, van Strijp JA. J. Exp. Med. 2004;199:687–695. doi: 10.1084/jem.20031636. [DOI] [PMC free article] [PubMed] [Google Scholar]
- 7.Rooijakkers SH, Ruyken M, Roos A, Daha MR, Presanis JS, Sim RB, van Wamel WJ, van Kessel KP, van Strijp JA. Nat. Immunol. 2005;6:920–927. doi: 10.1038/ni1235. [DOI] [PubMed] [Google Scholar]
- 8.Langley R, Wines B, Willoughby N, Basu I, Proft T, Fraser JD. J. Immunol. 2005;174:2926–2933. doi: 10.4049/jimmunol.174.5.2926. [DOI] [PubMed] [Google Scholar]
- 9.Zhang L, Jacobsson K, Vasi J, Lindberg M, Frykberg L. Microbiology. 1998;144:985–991. doi: 10.1099/00221287-144-4-985. [DOI] [PubMed] [Google Scholar]
- 10.Atkins KL, Burman JD, Chamberlain ES, Cooper JE, Poutrel B, Bagby B, Jenkins ATA, Feil EJ, van den Elsen JMH. Mol. Immunol. 2008;46:1600–1611. doi: 10.1016/j.molimm.2007.10.021. [DOI] [PubMed] [Google Scholar]
- 11.Zhang L, Jacobsson K, Strom K, Lindberg M, Frykberg L. Microbiology. 1999;145:177–183. doi: 10.1099/13500872-145-1-177. [DOI] [PubMed] [Google Scholar]
- 12.Bouma B, de Groot PG, van den Elsen JM, Ravelli RB, Schouten A, Simmelink MJ, Derksen RH, Kroon J, Gros P. EMBO J. 1999;18:5166–5174. doi: 10.1093/emboj/18.19.5166. [DOI] [PMC free article] [PubMed] [Google Scholar]
- 13.Svergun DI, Koch MHJ. Rep. Progr. Phys. 2003;66:1735–1782. [Google Scholar]
- 14.Sheffield P, Garrard S, Derewenda Z. Protein Expression Purif. 1999;15:34–39. doi: 10.1006/prep.1998.1003. [DOI] [PubMed] [Google Scholar]
- 15.Konarev PV, Volkov VV, Sokolova AV, Koch MHJ, Svergun DI. J. Appl. Crystallogr. 2003;36:1277–1282. [Google Scholar]
- 16.Guinier A. Ann. Phys. (Paris) 1939;12:161–237. [Google Scholar]
- 17.Svergun DI. J. Appl. Crystallogr. 1992;25:495–503. [Google Scholar]
- 18.Svergun DI. Biophys. J. 1999;76:2879–2886. doi: 10.1016/S0006-3495(99)77443-6. [DOI] [PMC free article] [PubMed] [Google Scholar]
- 19.Volkov VV, Svergun DI. J. Appl. Crystallogr. 2003;36:860–864. [Google Scholar]
- 20.White J, Lukacik P, Esser D, Steward M, Giddings N, Bright JR, Fritchley SJ, Morgan BP, Lea SM, Smith GP, Smith RA. Protein Sci. 2004;13:2406–2415. doi: 10.1110/ps.03455604. [DOI] [PMC free article] [PubMed] [Google Scholar]
- 21.Hammer CH, Wirtz GH, Renfer L, Gresham HD, Tack BF. J. Biol. Chem. 1981;256:3995–4006. [PubMed] [Google Scholar]
- 22.Pangburn MK. J. Immunol. Methods. 1987;102:7–14. doi: 10.1016/s0022-1759(87)80003-0. [DOI] [PubMed] [Google Scholar]
- 23.Isenman DE, Kells DI, Cooper NR, Muller-Eberhard HJ, Pangburn MK. Biochemistry. 1981;20:4458–4467. doi: 10.1021/bi00518a034. [DOI] [PubMed] [Google Scholar]
- 24.Isenman DE. J. Biol. Chem. 1983;258:4238–4244. [PubMed] [Google Scholar]
- 25.Becherer JD, Lambris JD. J. Biol. Chem. 1988;263:14586–14591. [PubMed] [Google Scholar]
- 26.Nagar B, Jones RG, Diefenbach RJ, Isenman DE, Rini JM. Science. 1998;280:1277–1281. doi: 10.1126/science.280.5367.1277. [DOI] [PubMed] [Google Scholar]
- 27.van den Elsen JM, Martin A, Wong V, Clemenza L, Rose DR, Isenman DE. J. Mol. Biol. 2002;322:1103–1115. doi: 10.1016/s0022-2836(02)00854-9. [DOI] [PubMed] [Google Scholar]
- 28.Seelen MA, Roos A, Wieslander J, Mollnes TE, Sjoholm AG, Wurzner R, Loos M, Tedesco F, Sim RB, Garred P, Alexopoulos E, Turner MW, Daha MR. J. Immunol. Methods. 2005;296:187–198. doi: 10.1016/j.jim.2004.11.016. [DOI] [PubMed] [Google Scholar]
- 29.Marchalonis JJ. Biochem. J. 1969;113:299–305. doi: 10.1042/bj1130299. [DOI] [PMC free article] [PubMed] [Google Scholar]
- 30.Wright JF, Shulman MJ, Isenman DE, Painter RH. J. Biol. Chem. 1988;263:11221–11226. [PubMed] [Google Scholar]
- 31.Law SK, Levine RP. Proc. Natl. Acad. Sci. U. S. A. 1977;74:2701–2705. doi: 10.1073/pnas.74.7.2701. [DOI] [PMC free article] [PubMed] [Google Scholar]
- 32.Cole FS, Auerbach HS, Goldberger G, Colten HR. J. Immunol. 1985;134:2610–2616. [PubMed] [Google Scholar]
- 33.Downer R, Roche F, Park PW, Mecham RP, Foster TJ. J. Biol. Chem. 2002;277:243–250. doi: 10.1074/jbc.M107621200. [DOI] [PubMed] [Google Scholar]
- 34.Kalli KR, Ahearn JM, Fearon DT. J. Immunol. 1991;147:590–594. [PubMed] [Google Scholar]
- 35.Sim RB, Sim E. Biochem. J. 1981;193:129–141. doi: 10.1042/bj1930129. [DOI] [PMC free article] [PubMed] [Google Scholar]
- 36.Rooijakkers SH, van Kessel KP, van Strijp JA. Trends Microbiol. 2005;13:596–601. doi: 10.1016/j.tim.2005.10.002. [DOI] [PubMed] [Google Scholar]
- 37.Hammel M, Sfyroera G, Pyrpassopoulos S, Ricklin D, Ramyar KX, Pop M, Jin Z, Lambris JD, Geisbrecht BV. J. Biol. Chem. 2007;282:30051–30061. doi: 10.1074/jbc.M704247200. [DOI] [PubMed] [Google Scholar]
- 38.Hammel M, Sfyroera G, Ricklin D, Magotti P, Lambris JD, Geisbrecht BV. Nat. Immunol. 2007;8:430–437. doi: 10.1038/ni1450. [DOI] [PubMed] [Google Scholar]
- 39.Janssen BJ, Huizinga EG, Raaijmakers HC, Roos A, Daha MR, Nilsson-Ekdahl K, Nilsson B, Gros P. Nature. 2005;437:505–511. doi: 10.1038/nature04005. [DOI] [PubMed] [Google Scholar]
- 40.Law SK, Dodds AW. Protein Sci. 1997;6:263–274. doi: 10.1002/pro.5560060201. [DOI] [PMC free article] [PubMed] [Google Scholar]
- 41.Fries LF, Gaither TA, Hammer CH, Frank MM. J. Exp. Med. 1984;160:1640–1655. doi: 10.1084/jem.160.6.1640. [DOI] [PMC free article] [PubMed] [Google Scholar]
- 42.Sim RB, Twose TM, Paterson DS, Sim E. Biochem. J. 1981;193:115–127. doi: 10.1042/bj1930115. [DOI] [PMC free article] [PubMed] [Google Scholar]
- 43.Pangburn MK, Muller-Eberhard HJ. Springer Semin. Immunopathol. 1984;7:163–192. doi: 10.1007/BF01893019. [DOI] [PubMed] [Google Scholar]
- 44.Lutz HU, Jelezarova E. Mol. Immunol. 2006;43:2–12. doi: 10.1016/j.molimm.2005.06.020. [DOI] [PubMed] [Google Scholar]
- 45.Nielsen CH, Leslie RG. J. Leukocyte Biol. 2002;72:249–261. [PubMed] [Google Scholar]
- 46.Rickert RC. Curr. Opin. Immunol. 2005;17:237–243. doi: 10.1016/j.coi.2005.03.001. [DOI] [PubMed] [Google Scholar]
- 47.Clemenza L, Isenman DE. J. Immunol. 2000;165:3839–3848. doi: 10.4049/jimmunol.165.7.3839. [DOI] [PubMed] [Google Scholar]
- 48.Zhang L, Rosander A, Jacobsson K, Lindberg M, Frykberg L. FEMS Immunol. Med. Microbiol. 2000;28:211–218. doi: 10.1111/j.1574-695X.2000.tb01479.x. [DOI] [PubMed] [Google Scholar]