

Abstract
While the majority of children with febrile seizures have an excellent prognosis, a small percentage are latter discovered to have cognitive impairment. Whether the febrile seizures produce the cognitive deficits or the febrile seizures are a marker or the result of underlying brain pathology is not clear from the clinical literature. We evaluated hippocampal and prefrontal cortex function in adult rats with a prior history of experimental febrile seizures as rat pups. All of the rat pups had MRI brain scans following the seizures. Rats subjected to experimental febrile seizures were found to have moderate deficits in working and reference memory and strategy shifting in the Morris water maze test. A possible basis for these hippocampal deficits involved abnormal firing rate and poor stability of hippocampal CA1 place cells, neurons involved in encoding and retrieval of spatial information. Additional derangements of interneuron firing in the CA1 hippocampal circuit suggested a complex network dysfunction in the rats. MRI T2 values in the hippocampus were significantly elevated in 50% of seizure-experiencing rats. Learning and memory functions of these T2-positive rats were significantly worse than those of T2-negative cohorts and of controls. We conclude that cognitive dysfunction involving the hippocampus and prefrontal cortex networks occur following experimental febrile seizures and that the MRI provides a potential biomarker for hippocampal deficits in a model of prolonged human febrile seizures.
Keywords: seizures, hippocampus, magnetic resonance imaging, water maze, febrile seizures, cognition, learning, memory, biomarker, epilepsy
Introduction
Seizures associated with fever, termed “febrile seizures” are the most common seizure variant in young children, occurring in 2–5% of individuals before age 5 years (Hauser, 1994;Huang et al., 1999a;Shinnar and Glauser, 2002). Epidemiological clinical studies suggest that most children with febrile seizures have normal development and intelligence (Annegers et al., 1987;Chang et al., 2001;Verity et al., 1998). However, some children with prolonged febrile seizures are at risk for long-term cognitive disturbances. For example, in a prospective study, Chang et al. (Chang et al., 2001), who examined hippocampus-mediated learning and memory function in children, found that infants who had febrile seizures before the age of one year had deficits in this realm. These authors examined cognitive function at age six years in children who did not develop epilepsy after febrile seizures. Therefore, these data suggest that complex febrile seizures in themselves might affect normal neuronal function within the hippocampal circuit (Baram and Shinnar, 2001).
To investigate the effect of febrile seizures on cognitive function we employed a well established model of prolonged experimental febrile seizures (EFS) (Dube et al., 2000;Dube et al., 2006). In this model rat pups at postnatal day 10 develop generalized seizures after exposure to a stream of heated air to approximately 41°C. The seizures occur at the age where hippocampal development is equivalent to that of human infants. These EFS: (i) are limbic in semiology and involve the hippocampal formation (Dube et al., 2000); (ii) induce transient neuronal injury but no cell death (Toth et al., 1998;Bender et al., 2003a); (iii) cause profound and enduring alterations in the expression of several channel genes (Brewster et al., 2002;Brewster et al., 2005); (iv) enhance hippocampal excitability long-term (Dube et al., 2000); and (v) result in spontaneous seizures and interictal epileptiform activity (Dube et al., 2000). The model therefore mimics the human condition in many regards.
MRI scans were performed on the rats following the EFS to determine if there was evidence of brain injury. We then assessed learning and memory in he rats once they reached adulthood using both behavioral and electrophysiological techniques. We focused on “place cells,” a subset of CA1 pyramidal cells that fire preferentially at particular locations (firing fields) in the space available to the animal (O’Keefe, 1973;Muller, 1996). Action potential frequency of these place cells is high only when the head of a freely moving rat is in the cell-specific region of the space (Foster et al., 1989;Muller and Kubie, 1989). Place fields form within minutes of being placed in an environment and persist for months if the environment remains stable (Muller and Kubie, 1987;Muller et al., 1987;Thompson and Best, 1989;Thompson and Best, 1990), suggesting that hippocampal place cells encode the salient features of spatial experience. This rapid and persistent neuronal encoding is a crucial step toward the formation of long-term spatial memory (Shapiro, 2001). Thus, place cells serve as reliable surrogate marker for assessing spatial memory (Holmes and Lenck-Santini, 2006;Zhou et al., 2007).
We report here that EFS result in impaired prefrontal and hippocampal function and that increased MRI T2 signal changes following prolonged EFS are associated with such cognitive impairment at both the behavioral and cellular level.
Materials and Methods
Animals and induction of EFS
Sprague-Dawley-derived rats were born and maintained in quiet facilities under controlled temperatures and light schedule. Cages were monitored every 12 hours for the presence of pups and the date of birth was considered as day 0. On postnatal day (P) 2, litters were culled to male pups. When weaned (on P21), rats were housed 2–3 per cage. Only male rats were used in the study. Experimental procedures were approved by Institutional Animal Care Committees and conformed to NIH guidelines.
EFS were elicited as previously described (Toth et al., 1998;Dube et al., 2000;Dube et al., 2004;Dube et al., 2006). Briefly, on P11, pups (n = 10) were placed in a glass container and their core temperature increased using a regulated stream of heated air to approximately 41°C (simulating high fever). Core temperatures were measured at baseline, seizure onset, and every 2 minutes during the seizures, and maintained in a narrow range. Hyperthermia (40.2–41.5°C) was maintained for 30 minutes resulting in seizures (Toth et al., 1998;Dube et al., 2000;Bender et al., 2003b;Brewster et al., 2002). The seizures were self-limited and ended spontaneously. The control group included littermates of the experimental group that were removed from the cage (to control for potential stress) and their core temperatures maintained within the normal range for age (n = 10).
MRI procedure
MRIs were performed on a 7 Tesla, Oxford 300/150 horizontal magnet with an inner bore size of 150 mm. Baseline scans were performed on P10 in control rats and in rats in whom seizures were evoked on P11. All animals were imaged one month later. Two seizure-experiencing rats did not survive the anesthesia for the imaging, and results are provided for the survivors (n = 8).
Rats were anesthetized using isoflurane. For each scan the animal was positioned prone inside the radio-frequency birdcage coil on a hand-made support. T2 weighted images were acquired using 2D-Multi-Echo-Spin-Echo Sequence (2D-MESE): TR: 3500 ms, 5 echo-times (30, 60, 90, 120, 150 ms), field of view (FOV): 38 mm, matrix size 256 × 256, number of averages 6. Absolute T2 relaxation time values (ms) were calculated on a pixel-by-pixel basis, and T2 maps were generated. Coronal brain scans included 20 sections (500 μm) with a 100 μm gap. Posterior cuts of interest corresponded to antero-posterior (AP) −6.5 mm (referring to bregma; (Paxinos and Watson, 1998) for entorhinal cortex visualization; the most anterior cuts corresponded to AP −2.0 mm, at the septal level.
MRI analysis
Images were analyzed by an investigator without knowledge of group, and regions of interest were delineated manually from anatomical images. The regions and the respective coordinates included: medial frontal (motor) cortex (AP: −2.2 to − 3.2 mm; 1–2 mm lateral, L), lateral frontoparietal (sensory) cortex (AP: −2.2 to −4.0 mm; L:~2–6.5 mm lateral), amygdala (basolateral and lateral nuclei combined, AP: −2.2 to −4.0 mm; L: 4–5.5 mm), dorsal hippocampus (AP: −2.2 to −4.0 mm; L: 0.5–5 mm), piriform cortex (AP: −2.2 to −4.0 mm; L: 4–6.5 mm), posterior hippocampus (AP: −4.6 to −6.5 mm; L: 1–6.5 mm), entorhinal cortex (AP: −4.6 to −6.5 mm; L: 5.5–7.5 mm), mediodorsal (AP: −2.2 to −3.6; L: 0.2–2 mm) and ventroposterolateral (AP: −2.2 to −4.0 mm; L: 2.25–4 mm) nuclei of the thalamus, corpus callosum (AP: −2.2 to −6.5 mm) and external capsule (AP: −2.2 to −6.5 mm) (Paxinos and Watson, 1998).
In addition to generating absolute T2 values, we calculated the mean and standard deviation of the control values, and compared the T2 values of each rat in the EFS group to those of the control group. We then calculated difference in T2 values of a region of interest in an individual rat compared to the mean of the control population, and determined whether or not this deviation from the control values was significant. Data were stored and analyzed in the PRISM software (GraphPad, San Diego).
Volume measurements
From the T2 weighted images (n = 20), brains were digitally segmented in 3D using the AMIRA software (Mercury Computer Systems Inc., Chemsford, MA). Volumes of the hippocampus and lateral ventricle for each hemisphere were measured for each experimental rat, and the most posterior sections were excluded in all rats because of sinus artifacts. All analyses were performed without knowledge of treatment group, and involved manual tracing of regions of interest: The border of the hippocampus was drawn at its juncture with the corpus callosum and the fimbria, and the lateral ventricles were delimited by the fimbria, the corpus callosum, the external capsule and the caudate/putamen complex.
Volumes of the hippocampus and lateral ventricle for each hemisphere were measured for each experimental rat (excluding the most posterior sections because of venous sinus artifacts). The regions of interest were traced manually by a ‘blinded’ investigator: The border of the hippocampus was drawn at its juncture with the corpus callosum and the fimbria, and the lateral ventricles were delimited by the fimbria, the corpus callosum, the external capsule and the caudate/putamen complex.
Hippocampal volume values were correlated to the volume of the ipsi- and contralateral ventricles, as well as to the absolute T2 values. Correlation coefficients were calculated using PRISM software (GraphPad, San Diego).
Water maze
Following completion of the MRI scans rats were transferred to Dartmouth Medical School. Rats were quarantined for one month prior to any studies.
Rats underwent Morris water maze testing on P90 using techniques previously described in our laboratory (Liu et al., 2003;Rutten et al., 2002). This test measures both working memory (particularly on the first testing day) and reference memory (on testing days 2–4). Working memory is measured by the ability of the rat to find the escape platform during a single testing session whereas reference memory is a measure of how well the rat does on subsequent testing days. Working memory is served by frontal cortex (Jones, 2002;Ragozzino et al., 1998) and reference memory by the hippocampus (Morris, 2006;Morris, 2007a). We further assessed prefrontal cortex function by testing the rat’s ability to make a strategy switch, by switching escape platform location after the rats learned the location of the original placement. All testing was done by an investigator blinded to treatment group.
A stainless-steel circular swimming pool (2 m in diameter, 50 cm high) was filled to a depth of 25 cm with water. White paint was added to make the water opaque and prevent the rats from seeing the platform. Room cues visible from the water surface were constant from day to day. Four points on the perimeter of the pool were designated north (N), south (S), east (E), and west (W), thus dividing the pool into four quadrants (NW, NE, SE, SW). A clear plexiglass escape platform 8 cm in diameter was positioned in the center of one of the quadrants, 1 cm below the water surface. For four hours prior to each testing session and during the test the rats were visually observed or videotaped to exclude spontaneous seizures. The test procedure lasted for seven days. On Day 1, each rat was placed in the pool for 60 seconds without the platform; this free swim enabled the rat to become habituated to the training environment. At the start of each trial, the rat was held facing the perimeter and dropped into the pool to ensure immersion. On Days 2–6, rats were trained for 24 trials (6 trials a day) to locate and escape onto the submerged platform. For each rat, the quadrant in which the platform was located remained constant for the duration of the experiment, but the point of immersion into the pool varied between N, E, S, and W in a random order for each trial so that the rat was not able to predict the platform location from the point at which it was placed in the pool. The latency from immersion into the pool to escape onto the platform was recorded for each trial, and the observer also manually recorded the route taken by the rat to reach the platform. All trials were also videotaped for subsequent analysis of swimming path. After reaching the platform, the rats were given a 30 seconds rest period, after which the next trial was started. If the rat did not find the platform in 120 seconds, it was placed on the platform for a 30 seconds rest.
One day after completion of the last latency trial (Day 7), the platform was removed and animals were placed in the water maze in the quadrant opposite that in which the platform had previously been located. The path and time spent in the quadrant where the platform had previously been placed were recorded. In this part of the water maze, termed the probe test, normal animals typically spend more time in the quadrant where the platform had been previously located than in the other quadrants. On testing day 8 the platform was moved to a new location and the rats were tested six times per day for two days. On day 10 the platform was again moved to a new location and the rats were tested for six trials per day for two additional days.
Place Cell Recordings
Following water maze testing (P110) all rats underwent place cell recordings using methods described previously (Liu et al., 2003;Zhou et al., 2007). The recordings and analysis were done by an investigator blinded to treatment group. The techniques are briefly described.
Recording chamber and training
The recording area was a gray cylinder 76 cm diameter and 51 cm high placed on a piece of gray paper that was replaced between each session (Fig. 1). A sheet of white cardboard occupied 90° of inside arc of the cylinder and was the only polarizing stimulus. Food deprived rats were trained to travel to all areas of the cylinder by chasing 20 mg food pellets dropped randomly about the cylinder from an overhead feeder at an average rate of about 3/minute. Training was completed when the rat spent a minimum of 12 of the 16 minutes walking.
Figure 1.
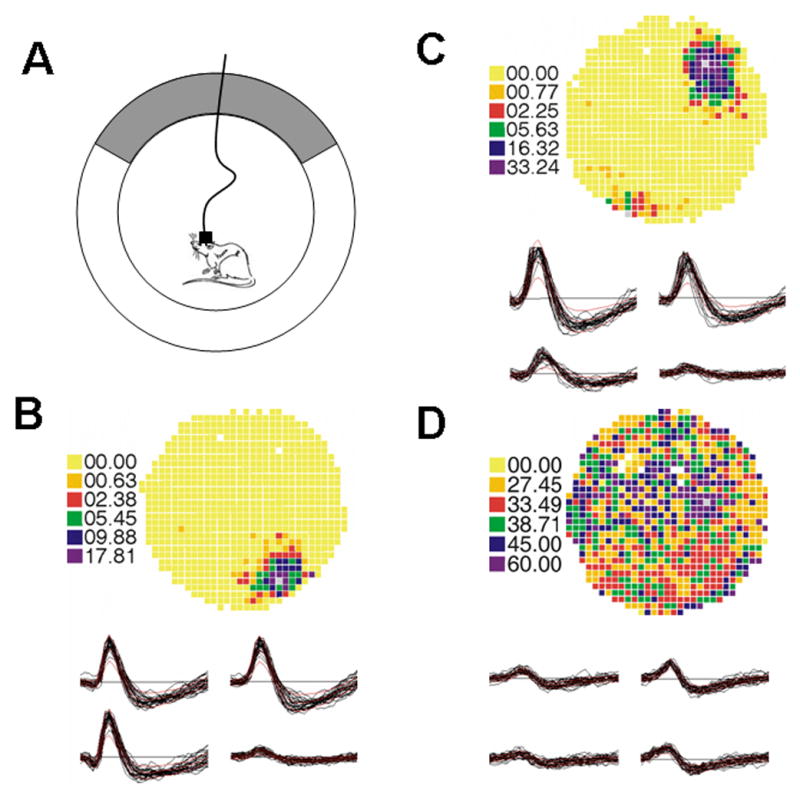
Place cell recording chamber and examples of two place cells and an interneuron. (A) Cartoon of recording chamber with rat connected to cable. A cue card, designated as gray, occupies one region of the recording chamber wall. (B) Example of place cell. Pixel rates were coded in the sequence: yellow, orange, red, green, blue and purple, in order from lowest to highest firing frequency. The firing rate was exactly zero for yellow pixels. The firing field was located at approximately 5 o’clock. Waveforms of the action potentials from the tetrode were displayed before the rate map. Each tracing was from a single electrode in the tetrode. (C) Place cell with maximum firing field at approximately 1 o’clock. (D) Example of interneuron. Interneurons have higher firing rates than place cells and fire do not demonstrate preferential location firing.
Electrode implantation
Following training, electrode microdrives were surgically implanted with stereotaxic techniques previously described (Zhou et al., 2007). We used special microdrives (Rivard et al., 2004) driving eight tetrodes (a group of four 25 μm nichrome electrode wires twisted together) and four EEG electrodes in CA1. Electrode tips were placed in the dorsal CA1 region of the right hippocampus. The initial placement of the electrode tips was 3.8 mm posterior to bregma, 2.5 mm lateral to midline and 1.5 mm below dura, directly above the dorsal hippocampus (Paxinos and Watson, 1998). Tetrodes allowed excellent signal detection and cell discrimination and allowed us to record from several cells simultaneously (Jung et al., 1998). Waveforms were acquired using a bandwidth of 300–9000 Hz. Tetrodes could be individually advanced. Each electrode was checked for waveforms of sufficient amplitude. If none were detected, the tetrode was advanced 20 μm and the rat was returned to its home cage for 4 to 6 hours. This sequence was repeated until one or more pyramidal cells with > 150 μV were isolated.
Four nichrome, formvar isolated 100 μm EEG electrodes were stereotaxically positioned so that two crossed the pyramidal cell layer and the other two remained in the stratum oriens. Differential EEG recordings were made above and below the cell layer using a bandwidth of 1–475 Hz. For single unit recording, the signal coming from the headstage preamplifiers was differentially amplified 10,000 times, acquired at 32 kHz, and recorded (Cheetah® recording system; Neuralynx, Inc.). The acquired waveforms were sorted offline using a computer program (Plexon®, Inc.).
Tracking position
The position of a light-emitting diode (LED) on the head was tracked with an overhead TV camera at 60 Hz in a 64 × 64 array of square pixels 2.7 cm on a side. The total time the LED was detected in each pixel and the number of spikes fired in each pixel was accumulated. A time-averaged firing rate distribution was calculated by dividing the number of spikes in each pixel by the dwell time in that pixel. Color-coded firing rate maps were used to visualize positional firing distributions (Fig. 1). Pixel rates were coded in the sequence: yellow, orange, red, green, blue and purple, in order from lowest to highest firing frequency. The firing rate was exactly zero for yellow pixels. Unvisited pixels in the cylinder and pixels outside the cylinder were coded white.
Electrophysiological Recording
All of the rats reported here underwent a minimum of four recording sessions of 16 minutes each. All rats were visually observed or videotaped to determine if any spontaneous seizures occurred in the four hours prior to place cell recordings. The intervals between sessions 1 and 2 and between sessions 3 and 4 were 2–3 minutes, and between sessions 2 and 3 were 5–6 hours. Discriminated waveforms were classified as arising from pyramidal cells if the action potentials fired in complex spike bursts (decrementing spike sequences with interspike interval <10 ms) had a negative initial phase >300 μs, and showed silent intervals lasting at least 1 second in duration. Because information content and coherence can be inaccurate for cells with very low firing rates, we required that all cells have >100 action potentials per session. The following parameters were measured for pyramidal neurons:
Firing rate: The firing rate averaged over all pixels in the field.
Field center rate: For each pixel in the field, the average of its rate and the rate in its 8 nearest neighbors is calculated. The peak rate is that in the pixel for which this average is greatest.
Coherence: This is a two-dimensional nearest-neighbor autocorrelation. It is calculated by listing the firing rate in each pixel and the average firing rate in its eight nearest neighbors. Coherence is the z-transform of the correlation between these lists and estimates the local smoothness of the positional firing pattern.
Information content: This is a measure of the amount of information conveyed about spatial location by a single action potential emitted by a single cell (Skaggs et al., 1993).
Total Spikes: The total number of action potentials recorded for the place cell during the recording session.
Interneurons, which have a faster firing rate and narrower waveform than place cells, were also recorded. Interneurons do not have preferential place firing (Fig. 1).
All measurements of place cell and interneuron function were done using software developed by Robert U. Muller, PhD, State University of New York, State University of New York-Health Science Center at Brooklyn, New York. Based on positional firing rate distributions, CA1 pyramidal cells were categorized as place cells or pyramidal cells without spatial firing characteristics. To be classified as a place cell the coherence was required to be >0.30 and the area of the largest field had to be <70% of the apparatus (Rotenberg et al., 1996;Rotenberg et al., 2000).
Histology
Following completion of the experiment, all rats were sacrificed, and the brains were removed for histological assessment. Coronal sections through entire extent of the hippocampus were cut at 40 μm on a freezing microtome. Sections were stored in phosphate buffered saline (pH 7.3). Every fourth section was stained with thionin for cell loss. We used sections between the septal area where the two blades of the dentate are equal and form a V shape starting at 2.8 mm posterior to the bregma to a point approximately 3.8 mm posterior to the bregma (Paxinos and Watson, 1998). Unbiased stereological cell counts were performed by using the optical dissector method (West and Gundersen, 1990;West et al., 1991). A 20X lens was used with a numerical aperture of 0.75 and depth of field of 2.5 μm. A counting box of 50×50 μm divided into 100 equal squares with an area 25 μm2 was used for cell counts. Cells were counted in a 4 × 4 sector (400 μm2) for CA3 and a 2 × 4 (200 μm2) for CA1. The bottom plane of the counting box was 5 μm above the bottom plane of the tissue section while the top plane of the counting box was 5 μm below the top plane of the tissue. Only cells with a nucleus coming into focus when focusing from the bottom to the top of the counting box were counted. Cells were counted in the entire hilus at 10× magnification. Cells were counted from five specimens per rat. Both left and right hippocampi were analyzed.
A Timm score was obtained by using a semi-quantitative scale for mossy fiber sprouting in the CA3 and the supragranular region. This scale is a modification of one proposed by Cavazos et al. (Cavazos and Sutula, 1990;Cavazos et al., 1991) which has previously been used in our laboratory (Holmes et al., 1998;Holmes et al., 1999;Huang et al., 1999b) and ranges from 0 to 5. Timm scores in the CA3 region and the supragranular region were assessed on each section from the septal area where the two blades of the dentate were equal and formed a V shape (2.8 mm posterior from the bregma) to a point approximately 3.8 mm posterior to the bregma. This was the same region that cell counts were obtained. Assessment of the Timm score in the supragranular region was done in the infrapyramidal blade of the dentate gyrus, avoiding the tip and crest of the gyrus. As with the cell loss score, the investigator evaluating the Timm stains (GLH) was blinded to treatment group. Five sections on both sides per rat were scored. A mean score for both the supragranular region of the dentate gyrus and pyramidal cell layer of CA3 were obtained.
Statistical Analysis
The significance of differences in MRI T2 signals was evaluated using Student’s t-test or one-way ANOVA, followed by Bonferroni’s post-hoc test, as appropriate. Student’s t-tests were used to compare place cell firing frequency, coherence, information content, and stability at baseline and following EFS. Effects of the seizures were evaluated using ANOVA with repeated measures with post hoc analysis by the Tukey’s multiple comparison tests for water maze performance and cell loss scores. Values are reported as means±SEM. Significance was set at p = 0.05. Timm staining was compared across groups using the non-parametric Kruskal-Wallis test.
Results
Behavioral features of EFS
The behavioral seizures of the EFS were stereotyped, consisting of a sudden arrest of heat-induced hyperkinesias, together with facial automatisms. These movements were then followed by body flexion. The behavioral seizures lasted approximately 24 minutes. These behavioral events have previously been shown to correlate with electrographic hippocampal seizures. None of the controls had any behavioral seizures noted.
T2 values in a subset of rats experiencing experimental prolonged febrile seizures are abnormal
MRI studies were performed a month after the EFS, a time-point when spontaneous seizures were not observed in any of the rats. The imaging demonstrated abnormal T2 signal in a subgroup of seizure-experiencing rats (Fig. 2). Specifically, coronal sections at the level of the hippocampal formation demonstrated visually apparent increased intensity in one or both hippocampi, generally conforming to the distribution of area CA1. There was commonly an inter-hemispheric variability in the presence or the degree of T2 signal abnormalities in EFS-experiencing rats with greater signal changes in the right than left hippocampus.
Figure 2.
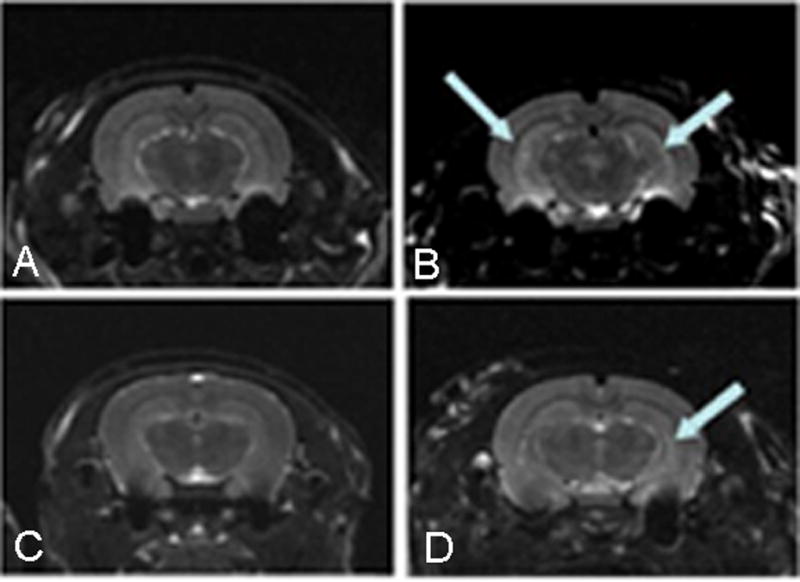
T2-weighted magnetic resonance images of two control (A,C) and two rats that sustained EFS (B,D), one month after the seizures. T2-weighted images were acquired using a 7 Tesla magnet (see methods for further details). Increased T2 signal intensities in both hippocampi are apparent in one of the EFS rats (B)(arrows, top right) and were quantified by calculating T2 relaxation time values on a pixel-by-pixel basis. A more asymmetrical increase of T2 signal was apparent in a second EFS rat (D) (arrow, bottom right), compared to littermate control rats (Top and bottom left panels).
When MRI signals of the right posterior hippocampus of EFS (n = 8) and control rats (n = 10) were analyzed using absolute T2 maps, values of the controls were 52.80±0.7 ms whereas for EFS rats, T2 values were significantly higher (55.9±0.3 ms; p = 0.0025; Fig. 2A). Similar values were found for the dorsal hippocampus (controls: 51.4±0.47 ms; EFS: 54.9±0.9 ms; p = 0.007). Further analysis demonstrated that the EFS rats segregated into two groups: in the first, T2 values of the hippocampus did not differ significantly from those of the controls: (Fig. 3B, n = 4 for each group), and therefore this group was termed “T2-negative”. In contrast, hippocampi of the second subset of rats had T2 values that were significantly higher than those of the controls, and of the T2-negative group (p = 0.03). Therefore, this group was classified as “T2-positive” for the behavioral and electrophysiological studies described below. The asymmetry of the T2 signal changes in the right versus the left hippocampi was quantified as the degree of divergence of the right or left hippocampal T2 values from the control T2 values (Fig. 3C and see Methods). As shown in the figure, experimental prolonged febrile seizures, though often lacking clear lateralizing behavioral phenomena, commonly impacted one hippocampus selectively or to a greater extent compared to the other, similar to findings described after prolonged human febrile seizures (Lewis et al., 2002;VanLandingham et al., 1998).
Figure 3.

Effects of EFS on MRI absolute T2 relaxation times (ms) and volume changes in hippocampus and lateral ventricles. (A) Absolute hippocampal T2 values of controls (n = 10) and of rats that had experienced experimental prolonged febrile seizures (n = 8). Seizures were induced on postnatal day 10, and rats were imagined a month later. T2 values of the EFS rats as a group were significantly higher than those of controls (p = 0.025). (B). EFS rats segregated into two groups, with significantly different T2 values in the hippocampus and other regions. T2 values of T2-positive rats (n = 4), were significantly higher than those of control as well as the values of the T2-negative group (p = 0.03). The T2 values of the negative group were not significantly different from the controls. (C) Asymmetry of increased T2 values in EFS experiencing rats. The difference between raw T2 values in the right or left hippocampus of a T2-positive rat and the mean values of the controls (ΔT2) are plotted (see Methods). The presence of this asymmetry and the preponderance of right hippocampal changes are apparent. (D) An inverse correlation of the volume of the hippocampi involved in abnormal T2 signal and the volume of the ipsilateral ventricle was found in the EFS group (n = 8).). (E) A correlation of hippocampal volume and the absolute MRI T2 values demonstrates a strong association of increased T2 signal with a reduction in the volume of the involved hippocampus in individual rats with EFS. (F) Correlation of the ventricular volume ipsilateral to a T2-positive hippocampus of individual rats experiencing EFS, with the T2 signal values in the same hippocampus.
The abnormal hippocampal T2 values were associated with significant alterations of ipsilateral hippocampal and ventricular volumes. First, an inverse correlation was observed between the volume of the hippocampus involved in the abnormal T2 signal and the volume of the ipsilateral ventricle (r = −0.71; p = 0.06; Fig. 3D). In addition, T2 signal values correlated with reduced hippocampal volume (r = −0.67; Fig. 3E). Finally, the absolute T2 values correlated positively with the volume of the ipsilateral ventricle (r = 0.93, p = 0.002; Figure 3F), but not with the volumes of the contralateral or third ventricles (not shown). Taken together, these data suggest that the abnormal T2 signal in the hippocampus of a subset of EFS-experiencing rats was associated with volume loss of this hippocampus and a compensatory increase in ventricular volume.
Notably, rats with abnormal T2 values in hippocampus often had increased T2 values also in other limbic regions including amygdala, and entorhinal and piriform cortices (Figure 4A), whereas in ‘T2-negative’ rats, T2 values of these regions were normal (Figure 4B). In addition, elevated T2 values were not observed for either group in regions that are not directly involved in the hippocampal or ‘limbic’ circuit, such as the ventral thalamus.
Figure 4.

Examples of T2 relaxation time values in limbic and non-limbic brain regions of “T2-positive” and “T2- negative” EPS rats (defined by hippocampal signal changes, see text). (A) An example of an EPS rat with significant elevation of hippocampal T2 values: “EFS #15 (+T2)”. Significant elevation of T2 values occurred throughout the limbic circuit of this rat (* = p < 0.05), but not in ‘the ventral posterior thalamus, an ‘extra-limbic’ region. (B) T2 values on MRI of an EPS rat with no significant change in hippocampal T2 values “EFS # 11 (−T2)”. Note the absence of significant T2 increase in most of the limbic structures. Hipp = hippocampus, Cx = cortex, VPM Thal = ventral posterior-medial nucleus of the thalamus. Values are presented as the difference between raw T2 values in the structure of interest of an individual EFS rat and the mean values of the control values for the same structure (ΔT2), all in the right hemisphere (see Methods).
In summary, following EFS, a subset of rats developed abnormal hippocampi on MRI, with increased signal and reduced volume, often associated with abnormal signal also within other regions of the limbic circuit, but the functional significance of these changes was unclear. Therefore, we next examined the possibility that these changes denoted neuronal dysfunction in these regions that subserve learning and memory functions. To address this possibility, we used in vivo learning and memory tasks, followed by hippocampal place cell physiology.
Water maze performance is abnormal following EFS
No rats were observed to have spontaneous seizures either during water maze testing or during the four hours preceding the testing. All rats successfully completed the water maze testing, and there were no differences in swimming speed between the EFS and control groups (t(16) = 0.1947, p = 0.195). Tested as a group (Fig. 5A), rats subjected to EFS differed significantly from the controls. Analysis of variance of the escape latency to reach the platform revealed a significant effect of EFS or no EFS (F(1,56) = 6.211, p = 0.016) as well as a significant day/EFS or no EFS interaction (F(1,56) = 5.25, p = 0.002). No differences were noted between the EFS and control rats in the probe test (t(16) = 0.6757, p = 0.509). There was also a significant difference between the EFS and controls in mean time to reach the escape platform following the first platform switch (t(16)= 2.447, p = 0.028)
Figure 5.

Comparison of water maze performance in the controls and EFS groups. (A) Comparison of all the EFS rats with controls. There was a group difference with the EFS rats showing greater latencies during the four testing days to the escape platform than the control rats. EFFS rats differed significantly from the control rats when the platform was switched. (* = p< 0.05). (B) Comparison of EFS rats segregated as to whether hippocampal T2 signals were present or absent. The rats with the T2 signal abnormalities performed significantly more poorly than the rats without such signal changes with greater latencies to the escape platform during the four testing days. No differences were noted between groups with either of the two platform switches.
As a group, rats with EFS required a longer time to reach the platform than the controls and also were impaired in the platform switch. We then compared latencies among rats with T2 signal changes and those without such changes. This analysis showed segregation between rats with and without T2 signal abnormalities (Fig. 5B). A repeated ANOVA demonstrated that rats with T2 signal abnormalities had significantly greater latencies to the escape platform than those without T2 changes (F(1,12) = 7.402, p = 0.019). As shown in Figure 5B, no differences were seen between the EFS rats with and without signal abnormalities in the platform switch. These results indicate that T2 signal changes are associated with impaired spatial learning and memory, functions governed by the hippocampus, but not of impaired strategy-switching, a function subserved by the prefrontal cortex.
Function of individual hippocampal place cells and interneurons correlates with MRI signal changes in rats experiencing experimental prolonged febrile seizures
We next sought to understand the cellular basis for the EFS-induced hippocampal impairments. To this end we compared hippocampal place cell function among the controls and EFS rats. We recorded 129 place cells from control rats and 74 place cells from rats with EFS. We recorded the cells several times to determine stability of position. The basic features of place cell firing presented here are derived from the first recording session only.
As shown in Figure 6, some place cell characteristics differed significantly among the groups. Coherence was lower in the EFS experiencing rats (F = 12.79(2,202), p<0.0001) Field sizes differed between groups (F = 4.,795(2,198), p=0.009) with the EFS rats having smaller fields than the controls. Likewise, central firing rate was reduced in the EFS rats (F = 3.547(2,198), P=0.030) (Fig. 6A–C). Several parameters of place cell function were not affected by the seizures: overall firing rate (F(2,199) = 2.184, p = 0.115), total action potentials (F(2,201) = 0.8333, p = 0.4361), and information content (F(2,202) = 0.3721, p = 0.690) were not altered in the EFS group. No differences were found in place cell firing characteristics in the four rats coded as having increased T2 signal in the hippocampus compared to the rats without such signal abnormalities. We also recorded 169 interneurons from the control rats (n = 88) and EFS rats (n = 81). Interneuron firing rate was significantly lower in the EFS rats than the controls (t(167) = 3.122, p = 0.0021). As shown in Figure 6D, interneuron firing was significantly lower in the EFS rats with T2 signal changes than rats without such abnormalities (t(57) = 2.165, p = 0.035).
Figure 6.

Place cell and interneuron firing characteristics. (A) Coherence, (B) Field Size, (C) Center Firing Rate. In all three measures, rats with EFS had impaired firing patterns. No differences were noted between the EFS rats with T2 signal changes and those without T2 signal changes. (D) Rats with EFS had significantly reduced interneuron firing compared to the controls. This difference is primarily accounted by the rats with T2 signal abnormalities. Rats with T2 signal abnormalities had significantly lower firing rates than rats without T2 signal abnormalities. (* = p< 0.05).
Place cell stability, an inherent and important property of these neurons in enabling spatial memory, was assessed by using four recording sessions: time intervals between recordings was either short (S1S2, S3S4) with 2–3 minutes inter-session intervals or long (S2S3, S1S4) with 5 hours between sessions Stability was calculated between each session. As shown in Figure 7A, place cell stability was lower in rats with EFS than the controls. Rats with T2 signal changes had worse stability than rats without T2 signal changes (Fig. 7B). These results suggest that T2 signal changes following EFS are a predictor of poor stability. Figure 8 provides examples of serial recordings of place cells from the three groups.
Figure 7.

Place cell stability. Stability of the field was assessed by using four recording sessions (S1–S4). Time between recording sessions 1 and 2, 3 and 4 was 2–3 minutes; the time between S2 and S3 was 5 –6 hours. For sessions S1S3, S3S4, and S1S4 there was a significant difference between the EFS and control rats, with the EFS rats showing poorer stability than the controls (A). (B) Rats with T2 signal changes had significantly poorer stability than the rats without T2 signal changes. (* = p <0.05)
Figure 8.
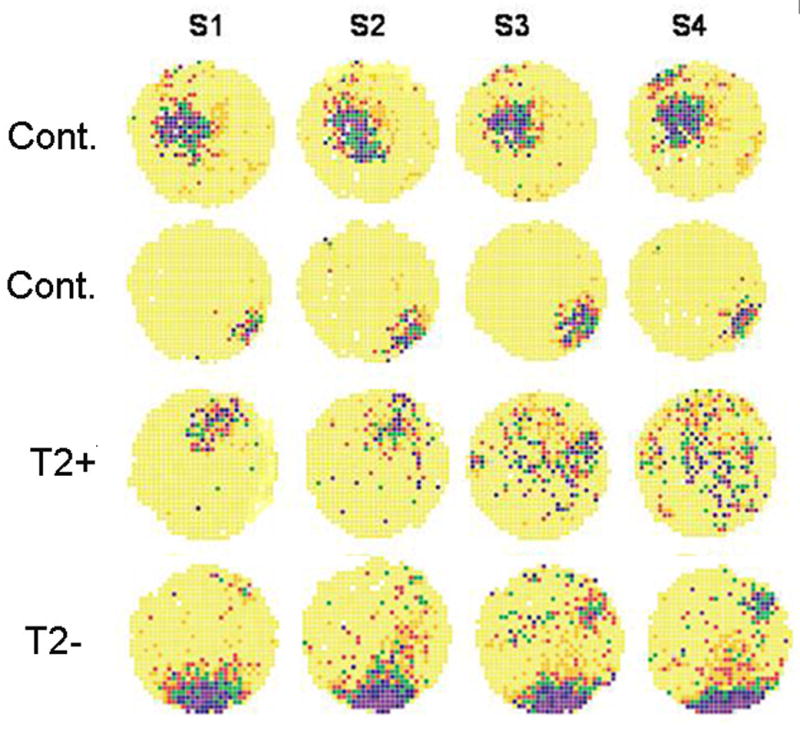
Examples of place cell stability. Each row is from four different rats. The first two rows are from control rats while the third row is from an EFS rat without T2 signal changes and the fourth row from a rat with T2 signal changes. Note the change in place cell field across sessions in the rat with the T2 signal changes. Coherences of the place cell field for the first session were (0.69, 0.75, 0.45, and 0.69, respectively from the top to bottom row).
While rats were not monitored 24 hours a day, they were visually monitored during the four hour period prior to the place cell recordings. During the place cell recordings the electroencephalogram was monitored for epileptiform activity. No spontaneous seizures were seen in any of the rats. Therefore, the water maze performance and place cell recordings do not appear to be influence by ongoing spontaneous seizures.
Histology
No macroscopic lesions were seen in either the controls or rats with group. Cell counts (per field) were similar in CA1 (Cont. = 69.88±2.93; EFS + T2 = 71.00±3.91; EFS − T2 = 65.90±3.07 ; p >0.05); CA3 (Cont. = 91.04±4.56; EFS + T2 = 95.30±5.827; EFS − T2 = 101.0±6.72; p >0.05); and hilus (Cont. = 100.2±5.94; EFS + T2 = 102.2±6.72; EFS − T2 = 110.9±6.94; p >0.05). There were no significant differences in Timm scores in the control and two EFS groups in either the supragranular region of the dentate gyrus (Cont. 0.68±0.11; EFS − T2 = 1.00±0.11; or EFS +T2 = 0.85±0.09, P > 0.05) or CA3 region (Cont. 0.38±0.10; EFS − T2 = 0.19±0.08; or EFS +T2 = 0.37±0.11, p > 0.05).
Discussion
The principal findings of these experiments are: (1) Prolonged experimental febrile seizures are associated with impairment in hippocampal-dependent learning and memory and prefrontal cortex-dependent strategy switching when the rats are tested as adults; (2) T2 weighted MR imaging delineates two outcomes after early-life EFS: a subgroup of rats with abnormal T2 signal in hippocampus, and a second population with T2 values that do not differ significantly from those in the controls. Rats with T2 signal changes in the hippocampus were associated with impaired hippocampus-mediated, but not prefrontal cortex-dependent, learning and memory; (2) Several measures of place cell and interneuron physiology are abnormal in rats experiencing EFS; (3) Hippocampal cell numbers are not appreciably reduced in EFS rats, despite a modest loss of volume, Taken together, these finding indicate that EFS result in long-standing cognitive impairment as measured by behavioral and single cell recordings. Furthermore, our results suggest that T2 MRI signal changes in the hippocampus may be an indicator of cognitive dysfunction, at both the behavioral and single cell levels.
There is now overwhelming evidence that the integrity of the hippocampal formation and its afferent and efferent connections is required for the acquisition and consolidation of information for spatial navigation (Morris, 2007b;D’Hooge and De Deyn, 2001). The Morris water maze is now a widely used test to study hippocampal-dependent memory. The basic task is straightforward. Rats are required to escape from the water tank onto a hidden platform whose location can normally be identified only using spatial memory since there are no local cues indicating where the platform is located. Conceptually, the task derives from place cells, since these cells also identify points in space that cannot be derived from local cues (Morris, 2007b). EFS were associated with impairment in both water maze performance and place cell function. In the water maze, animals had longer latencies to the escape platform over four days of testing. Paralleling these deficits were two defects of place cell activity: i) The coherence (precision) of firing fields was lower, field center firing rates were reduced, and the field size was smaller; and ii) Place field locations were less stable than those prior to the recurrent seizures. In addition, interneuron firing rates were reduced in the EFS rats. The reduced coherence, lower firing rates, and reduced information content of place cells suggest that on a single cell level, cells provided less information to the rat about location. The decreased stability further suggests that field reproducibility decays as a function of time, implying a forgetting process. Reduction in firing rates of GABAergic interneurons indicates impaired inhibition which likely contributes to the abnormal output of the place cells. The lack of an increase in place cell firing in lieu of reduced interneuron firing is another indication of pathological changes in place cell physiology following EFS.
In addition to behavioral and single cell evidence of impaired hippocampal function, the EFS group showed deficits in finding the platform when the location was changed after the animals learned the task. Strategy switching is considered to be a prefrontal cortex rather than hippocampus function (Ragozzino et al., 1999). However, it should be cautioned that both the hippocampus and prefrontal cortex are not isolated, functioning structures. Both structures engage with other brain structures to mediate effective performance. Nevertheless, at the very least, our results suggest that EFS have adverse effects that involve multiple brain areas.
To assess whether MRI findings following EFS were related to long-standing cognitive and place cell function we divided MRI scans into two groups depending upon T2 signal intensity. Rats with abnormally high T2 signal characteristics were significantly slower in regards to escape latency in the water maze than rats with lower T2 signals. However, the “strategy switching” impairment was not related to whether there were T2 changes in the hippocampus. These findings suggest that the T2 changes in the hippocampus are specific, predicting deficits in hippocampal function, but not function from other cortical regions.
T2 signal changes were also associated with place cell stability. While basic place cell firing patterns, such as coherence and center firing rate, were impaired in rats with EFS regardless of T2 signal intensity, place cell fields were less stable in the T2-positive rats, whereas those in T2-negative rats were indistinguishable from those of controls. Stability of place cell firing when a rat is in a given location in space typically decays as a function of time, implying a forgetting process. Therefore, the specific reduction in place cell stability in T2-positive rats indicates a propensity to forget spatial cues and relationships and provides strong neurobiological support for the impaired memory of these rats in the water maze. Similarly, increased T2 signal was associated with greater impairment of interneuron firing.
Our findings are of interest in view of the findings in children with prolonged febrile seizures. In scans performed during the first days to months following the prolonged febrile seizure, increased T2 signal as well as volume changes have been reported (Scott et al., 2002;Scott et al., 2003;VanLandingham et al., 1998). Also a large prospective analysis of MRI changes after prolonged febrile seizures has recently been initiated in a large cohort of children with febrile status epilepticus (Lewis et al., 2005;Shinnar et al., 2005), and both T2 signal changes as well as volume loss within months after the seizures have been found in a small subset. However, the relationship of MRI changes to cognitive function of the children is unknown. Here we found an association of MRI changes with cognitive dysfunction, specifically related to tasks subserved by the hippocampus. In addition, the increased T2 signal in hippocampus was associated with modest reduction of hippocampal volume and increased ipsilateral ventricle volume. In an individual rat, hippocampal changes were associated with abnormal signal in other limbic regions classically involved in the propagation of limbic seizures such as the amygdala, entorhinal and piriform cortices, suggesting that the limbic circuit of this rat was ‘affected’ by the seizures. Absence of hippocampal abnormalities in other individual animals correlated with lack of T2 changes elsewhere in the limbic circuit. Both the similarity of the rat finding and human data and the clustering of T2 changes in rats with cognitive impairment indicate that T2 signal changes predict seizure-related dysfunction of limbic regions.
The basis for the increased T2 and modest volume loss on MRI in a subset of EFS-experiencing rats remains unknown. We have previously demonstrated that acute MRI changes after these seizures did not indicate cell death (Dube et al., 2004), and cell counting failed to reveal obvious neuronal loss as the basis of the MRI abnormalities one month after the seizures. An alternative possibility is suggested by our previous work, demonstrating significant, yet transient, injury of hippocampal neurons after EFS (Toth et al., 1998). These earlier studies found that cells in CA1, CA3 and the dentate gyrus hilus, including both pyramidal cells and interneurons, were more silver-stain reactive 1–14 days after the seizures, but did not proceed to die. The injury to these neurons might have resulted in dendritotoxicity (Olney et al., 1983;Jiang et al., 1998), an early consequence of excitotoxicity related to seizures in both humans and animal models (Isokawa and Levesque, 1991;Zeng et al., 2007). While speculative at this point, dendritotoxicity, in turn, could account for both the loss of neuropil volume found on MRI, and to dysfunction of both hippocampal principal cells and interneurons.
It is also of interest that the MRI findings were lateralized to one temporal lobe despite the observation that the rats had generalized seizures. Why rats, like children (Lewis et al., 2002;VanLandingham et al., 1998) have primarily unilateral T2 signal changes following EFS is not known. Lateralization of modality-specific behaviors do not occur in the hippocampus of rats and thus it is not possible to determine if the unilateral MRI findings corresponded to specific behavioral deficits.
While or results demonstrate that experimental febrile seizures in rats can result in long-term cognitive consequences, extrapolation to the clinical situation must be done carefully and judiciously. The seizures in the rats used in this study were significantly longer than seen in typical febrile seizures (Sofijanov et al., 1992) and were caused by hyperthermia, not an endogenous fever secondary to an infection. In addition, the cognitive deficits and place cell dysfunction, while statistically significant were relatively modest. This study does not contraindicate the vast amount of work showing that brief, typical febrile seizures are benign in regards to developmental and intelligence (Shinnar and Glauser, 2002).
In summary, these findings indicate that a prolonged febrile seizure in a rat pup can produce long-standing cognitive impairment with impaired hippocampal single cell firing patterns. MRI studies and specifically T2 signal changes in the hippocampal formation may provide a biomarker for enduring cognitive deficits at both the behavioral and single cell level after experimental prolonged febrile seizures, with potential implication to children with prolonged febrile seizures.
Acknowledgments
We thank J. Calara for expert editorial help. Supported in part by NIH grants: NS044296 (GLH), R21 NS49618 (GLH & TZB) and R37 NS35439 (TZB).
Footnotes
Publisher's Disclaimer: This is a PDF file of an unedited manuscript that has been accepted for publication. As a service to our customers we are providing this early version of the manuscript. The manuscript will undergo copyediting, typesetting, and review of the resulting proof before it is published in its final citable form. Please note that during the production process errors may be discovered which could affect the content, and all legal disclaimers that apply to the journal pertain.
Reference List
- Annegers JF, Hauser WA, Shirts SB, Kurland LT. Factors prognostic of unprovoked seizures after febrile convulsions. N Engl J Med. 1987;316:493–498. doi: 10.1056/NEJM198702263160901. [DOI] [PubMed] [Google Scholar]
- Baram TZ, Shinnar S. Do febrile seizures improve memory? Neurology. 2001;57:7–8. doi: 10.1212/wnl.57.1.7. [DOI] [PMC free article] [PubMed] [Google Scholar]
- Bender RA, Dube C, Gonzalez-Vega R, Mina EW, Baram TZ. Mossy fiber plasticity and enhanced hippocampal excitability, without hippocampal cell loss or altered neurogenesis, in an animal model of prolonged febrile seizures. Hippocampus. 2003a;13:399–412. doi: 10.1002/hipo.10089. [DOI] [PMC free article] [PubMed] [Google Scholar]
- Bender RA, Soleymani SV, Brewster AL, Nguyen ST, Beck H, Mathern GW, Baram TZ. Enhanced expression of a specific hyperpolarization-activated cyclic nucleotide-gated cation channel (HCN) in surviving dentate gyrus granule cells of human and experimental epileptic hippocampus. J Neurosci. 2003b;23:6826–6836. doi: 10.1523/JNEUROSCI.23-17-06826.2003. [DOI] [PMC free article] [PubMed] [Google Scholar]
- Brewster A, Bender RA, Chen Y, Dube C, Eghbal-Ahmadi M, Baram TZ. Developmental febrile seizures modulate hippocampal gene expression of hyperpolarization-activated channels in an isoform- and cell-specific manner. J Neurosci. 2002;22:4591–4599. doi: 10.1523/JNEUROSCI.22-11-04591.2002. [DOI] [PMC free article] [PubMed] [Google Scholar]
- Brewster AL, Bernard JA, Gall CM, Baram TZ. Formation of heteromeric hyperpolarization-activated cyclic nucleotide-gated (HCN) channels in the hippocampus is regulated by developmental seizures. Neurobiol Dis. 2005;19:200–207. doi: 10.1016/j.nbd.2004.12.015. [DOI] [PMC free article] [PubMed] [Google Scholar]
- Cavazos JE, Golarai G, Sutula TP. Mossy fiber synaptic reorganization induced by kindling: time course of development, progression, and permanence. J Neurosci. 1991;11:2795–2803. doi: 10.1523/JNEUROSCI.11-09-02795.1991. [DOI] [PMC free article] [PubMed] [Google Scholar]
- Cavazos JE, Sutula TP. Progressive neuronal loss induced by kindling: a possible mechanism for mossy fiber synaptic reorganization and hippocampal sclerosis. Brain Res. 1990;527:1–6. doi: 10.1016/0006-8993(90)91054-k. [DOI] [PubMed] [Google Scholar]
- Chang YC, Guo NW, Wang ST, Huang CC, Tsai JJ. Working memory of school-aged children with a history of febrile convulsions: a population study. Neurology. 2001;57:37–42. doi: 10.1212/wnl.57.1.37. [DOI] [PubMed] [Google Scholar]
- D’Hooge R, De Deyn PP. Applications of the Morris water maze in the study of learning and memory. Brain Res Brain Res Rev. 2001;36:60–90. doi: 10.1016/s0165-0173(01)00067-4. [DOI] [PubMed] [Google Scholar]
- Dube C, Chen K, Eghbal-Ahmadi M, Brunson K, Soltesz I, Baram TZ. Prolonged febrile seizures in the immature rat model enhance hippocampal excitability long term. Ann Neurol. 2000;47:336–344. [PMC free article] [PubMed] [Google Scholar]
- Dube C, Richichi C, Bender RA, Chung G, Litt B, Baram TZ. Temporal lobe epilepsy after experimental prolonged febrile seizures: prospective analysis. Brain. 2006;129:911–922. doi: 10.1093/brain/awl018. [DOI] [PMC free article] [PubMed] [Google Scholar]
- Dube C, Yu H, Nalcioglu O, Baram TZ. Serial MRI after experimental febrile seizures: altered T2 signal without neuronal death. Ann Neurol. 2004;56:709–714. doi: 10.1002/ana.20266. [DOI] [PMC free article] [PubMed] [Google Scholar]
- Foster TC, Castro CA, McNaughton BL. Spatital selectivity of rat hippocamapal neurons: dependence on preparedness for movement. Science. 1989;244:1580–1582. doi: 10.1126/science.2740902. [DOI] [PubMed] [Google Scholar]
- Hauser WA. The prevalence and incidence of convulsive disorders in children. Epilepsia. 1994;35(Suppl 2):S1–S6. doi: 10.1111/j.1528-1157.1994.tb05932.x. [DOI] [PubMed] [Google Scholar]
- Holmes GL, Gairsa JL, Chevassus-Au-Louis N, Ben-Ari Y. Consequences of neonatal seizures in the rat: morphological and behavioral effects. Ann Neurol. 1998;44:845–857. doi: 10.1002/ana.410440602. [DOI] [PubMed] [Google Scholar]
- Holmes GL, Lenck-Santini PP. Role of interictal epileptiform abnormalities in cognitive impairment. Epilepsy Behav. 2006;8:504–515. doi: 10.1016/j.yebeh.2005.11.014. [DOI] [PubMed] [Google Scholar]
- Holmes GL, Sarkisian M, Ben-Ari Y, Chevassus-Au-Louis N. Mossy fiber sprouting after recurrent seizures during early development in rats. J Comp Neurol. 1999;404:537–553. doi: 10.1002/(sici)1096-9861(19990222)404:4<537::aid-cne9>3.0.co;2-#. [DOI] [PubMed] [Google Scholar]
- Huang CC, Wang ST, Chang YC, Huang MC, Chi YC, Tsai JJ. Risk factors for a first febrile convulsion in children: a population study in southern Taiwan. Epilepsia. 1999a:719–725. doi: 10.1111/j.1528-1157.1999.tb00769.x. [DOI] [PubMed] [Google Scholar]
- Huang L, Cilio MR, Silveira DC, McCabe BK, Sogawa Y, Stafstrom CE, Holmes GL. Long-term effects of neonatal seizures: a behavioral, electrophysiological, and histological study. Brain Res Dev Brain Res. 1999b;118:99–107. doi: 10.1016/s0165-3806(99)00135-2. [DOI] [PubMed] [Google Scholar]
- Isokawa M, Levesque MF. Increased NMDA responses and dendritic degeneration in human epileptic hippocampal neurons in slices. Neurosci Lett. 1991;132:212–216. doi: 10.1016/0304-3940(91)90304-c. [DOI] [PubMed] [Google Scholar]
- Jiang M, Lee CL, Smith KL, Swann JW. Spine loss and other persistent alterations of hippocampal pyramidal cell dendrites in a model of early-onset epilepsy. J Neurosci. 1998;18:8356–8368. doi: 10.1523/JNEUROSCI.18-20-08356.1998. [DOI] [PMC free article] [PubMed] [Google Scholar]
- Jones MW. A comparative review of rodent prefrontal cortex and working memory. Curr Mol Med. 2002;2:639–647. doi: 10.2174/1566524023361989. [DOI] [PubMed] [Google Scholar]
- Jung MW, Qin Y, McNaughton BL, Barnes CA. Firing characteristics of deep layer neurons in prefrontal cortex in rats performing spatial working memory tasks. Cereb Cortex. 1998;8:437–450. doi: 10.1093/cercor/8.5.437. [DOI] [PubMed] [Google Scholar]
- Lewis DV, Barboriak DP, MacFall JR, Provenzale JM, Mitchell TV, VanLandingham KE. Do prolonged febrile seizures produce medial temporal sclerosis? Hypotheses, MRI evidence and unanswered questions. Prog Brain Res. 2002;135:263–278. doi: 10.1016/s0079-6123(02)35025-8. [DOI] [PubMed] [Google Scholar]
- Lewis DV, Bello JA, Chan S, Pellock JM, Nordli DR, Frank LM, MacFall J, Provenzale JM, Hesdorffer DC, Marmarou A, Shinnar S FEBSTAT study team. Hippocampal abnormalities subsequent to febrile status epilepticus: findings on early post-ictal. MRI imaging. 2005:52. [Google Scholar]
- Liu X, Muller RU, Huang LT, Kubie JL, Rotenberg A, Rivard B, Cilio MR, Holmes GL. Seizure-induced changes in place cell physiology: relationship to spatial memory. J Neurosci. 2003;23:11505–11515. doi: 10.1523/JNEUROSCI.23-37-11505.2003. [DOI] [PMC free article] [PubMed] [Google Scholar]
- Morris R. Theories of hippocampal function. In: Andersen P, Morris R, Amaral D, Bliss T, O’Keefe J, editors. The Hippocampus Book. Oxford: Oxford University Press; 2007b. pp. 581–713. [Google Scholar]
- Morris R. Theories of hippocampal function. In: Andersen P, Morris R, Amaral D, Bliss T, O’Keefe J, editors. The Hippocampus Book. Oxford: Oxford University Press; 2007a. pp. 581–713. [Google Scholar]
- Morris RG. Elements of a neurobiological theory of hippocampal function: the role of synaptic plasticity, synaptic tagging and schemas. Eur J Neurosci. 2006;23:2829–2846. doi: 10.1111/j.1460-9568.2006.04888.x. [DOI] [PubMed] [Google Scholar]
- Muller R. A quarter of a century of place cells. Neuron. 1996;17:813–822. doi: 10.1016/s0896-6273(00)80214-7. [DOI] [PubMed] [Google Scholar]
- Muller RU, Kubie JL. The effects of changes in the environment on the spatial firing patterns of hippocampal complex-spike cells. J Neurosci. 1987;7:1951–1968. doi: 10.1523/JNEUROSCI.07-07-01951.1987. [DOI] [PMC free article] [PubMed] [Google Scholar]
- Muller RU, Kubie JL. The firing of hippocampal place cells predicts the future position of freely moving rats. J Neurosci. 1989;9:4101–4110. doi: 10.1523/JNEUROSCI.09-12-04101.1989. [DOI] [PMC free article] [PubMed] [Google Scholar]
- Muller RU, Kubie JL, Ranck JB., Jr Spatial firing patterns of hippocampal complex-spike cells in a fixed environment. J Neurosci. 1987;7:1935–1950. doi: 10.1523/JNEUROSCI.07-07-01935.1987. [DOI] [PMC free article] [PubMed] [Google Scholar]
- O’Keefe J. Place units in the hippocampus of freely moving rats. Exp Neurol. 1973;51:78–109. doi: 10.1016/0014-4886(76)90055-8. [DOI] [PubMed] [Google Scholar]
- Olney JW, De Gubareff T, Sloviter RS. Epileptic” brain damage in rats induced by sustained electrical stimulation of the perforant path. II. Ultrastructural analysis of acute hippocampal pathology. Brain Res Bull. 1983;10:699–712. doi: 10.1016/0361-9230(83)90038-2. [DOI] [PubMed] [Google Scholar]
- Paxinos G, Watson C. The Rat Brain in Stereotaxic Coordinates. San Diego: Academic Press; 1998. [Google Scholar]
- Ragozzino ME, Adams S, Kesner RP. Differential involvement of the dorsal anterior cingulate and prelimbic-infralimbic areas of the rodent prefrontal cortex in spatial working memory. Behav Neurosci. 1998;112:293–303. doi: 10.1037//0735-7044.112.2.293. [DOI] [PubMed] [Google Scholar]
- Ragozzino ME, Wilcox C, Raso M, Kesner RP. Involvement of rodent prefrontal cortex subregions in strategy switching. Behav Neurosci. 1999;113:32–41. doi: 10.1037//0735-7044.113.1.32. [DOI] [PubMed] [Google Scholar]
- Rivard B, Li Y, Lenck-Santini PP, Poucet B, Muller RU. Representation of objects in space by two classes of hippocampal pyramidal cells. J Gen Physiol. 2004;124:9–25. doi: 10.1085/jgp.200409015. [DOI] [PMC free article] [PubMed] [Google Scholar]
- Rotenberg A, Abel T, Hawkins RD, Kandel ER, Muller RU. Parallel instabilities of long-term potentiation, place cells, and learning caused by decreased protein kinase A activity. J Neurosci. 2000;20:8096–8102. doi: 10.1523/JNEUROSCI.20-21-08096.2000. [DOI] [PMC free article] [PubMed] [Google Scholar]
- Rotenberg A, Mayford M, Hawkins RD, Kandel ER, Muller RU. Mice expressing activated CaMKII lack low frequency LTP and do not form stable place cells in the CA1 region of the hippocampus. Cell. 1996;87:1351–1361. doi: 10.1016/s0092-8674(00)81829-2. [DOI] [PubMed] [Google Scholar]
- Rutten A, van Albada M, Silveira DC, Cha BH, Liu X, Hu YN, Cilio MR, Holmes GL. Memory impairment following status epilepticus in immature rats: time-course and environmental effects. Eur J Neurosci. 2002;16:501–513. doi: 10.1046/j.1460-9568.2002.02103.x. [DOI] [PubMed] [Google Scholar]
- Scott RC, Gadian DG, King MD, Chong WK, Cox TC, Neville BG, Connelly A. Magnetic resonance imaging findings within 5 days of status epilepticus in childhood. Brain. 2002;125:1951–1959. doi: 10.1093/brain/awf202. [DOI] [PubMed] [Google Scholar]
- Scott RC, King MD, Gadian DG, Neville BG, Connelly A. Hippocampal abnormalities after prolonged febrile convulsion: a longitudinal MRI study. Brain. 2003;126:2551–2557. doi: 10.1093/brain/awg262. [DOI] [PubMed] [Google Scholar]
- Shapiro M. Plasticity, hippocampal place cells, and cognitive maps. Arch Neurol. 2001;58:874–881. doi: 10.1001/archneur.58.6.874. [DOI] [PubMed] [Google Scholar]
- Shinnar S, Glauser TA. Febrile seizures. J Child Neurol. 2002;17(Suppl 1):S44–S52. doi: 10.1177/08830738020170010601. [DOI] [PubMed] [Google Scholar]
- Shinnar S, Lewis DV, Bello JA, Chan S, Pellock JM, Nordli DR, Frank LM, MacFall J, Provenzale JM, Hesdorffer DC, Marmarou A FEBSTAT study team. T2 signal intensity distribution in hippocampus following febrile status epilepticus. 2005:262. [Google Scholar]
- Skaggs WE, McNaughton BL, Gothard KM, Markus EJ. An information-theoretic approach to deciphering the hippocampal code. In: Hanson SJ, Cowan JD, Giles CL, editors. Advances in Neural Information Processing Systems. San Francisco: Morgan Kaufmann; 1993. pp. 1030–1037. [Google Scholar]
- Sofijanov N, Emoto S, Kuturec M, Dukovski M, Duma F, Ellenberg JH, Hirtz DG, Nelson KB. Febrile seizures: clinical characteristics and initial EEG. Epilepsia. 1992;33:52–57. doi: 10.1111/j.1528-1157.1992.tb02282.x. [DOI] [PubMed] [Google Scholar]
- Thompson LT, Best PJ. Place cells and silent cells in the hippocampus of freely-behaving rats. J Neurosci. 1989;9:2382–2390. doi: 10.1523/JNEUROSCI.09-07-02382.1989. [DOI] [PMC free article] [PubMed] [Google Scholar]
- Thompson LT, Best PJ. Long-term stability of the place-field activity of single units recorded from the dorsal hippocampus of freely behaving rats. Brain Res. 1990;509:299–308. doi: 10.1016/0006-8993(90)90555-p. [DOI] [PubMed] [Google Scholar]
- Toth Z, Yan X-X, Haftoglou S, Ribak CE, Baram TZ. Seizure-induced neuronal injury: vulnerability to febrile seizures in an immature rat model. J Neurosci. 1998;18:4285–4294. doi: 10.1523/JNEUROSCI.18-11-04285.1998. [DOI] [PMC free article] [PubMed] [Google Scholar]
- VanLandingham KE, Heinze ER, Cavazos JE, Lewis DV. Magnetic resonance imaging evidence of hippocampal injury after prolonged focal febrile convulsions. Ann Neurol. 1998;43:413–426. doi: 10.1002/ana.410430403. [DOI] [PubMed] [Google Scholar]
- Verity CM, Greenwood R, Golding J. Long-term intellectual and behavioral outcomes of children with febrile convulsions. N Engl J Med. 1998;338:1723–1728. doi: 10.1056/NEJM199806113382403. [DOI] [PubMed] [Google Scholar]
- West MJ, Gundersen HJG. Unbiased stereological estimation of the number of neurons in the human hippocampus. J Comp Neurol. 1990;296:1–22. doi: 10.1002/cne.902960102. [DOI] [PubMed] [Google Scholar]
- West MJ, Slomianka L, Gundersen HJG. Unbiased stereological estimation of the total number of neurons in the subdivisions of the rat hippocampus using the optical fractionator. Anat Rec. 1991;231:482–497. doi: 10.1002/ar.1092310411. [DOI] [PubMed] [Google Scholar]
- Zeng LH, Xu L, Rensing NR, Sinatra PM, Rothman SM, Wong M. Kainate seizures cause acute dendritic injury and actin depolymerization in vivo. J Neurosci. 2007;27:11604–11613. doi: 10.1523/JNEUROSCI.0983-07.2007. [DOI] [PMC free article] [PubMed] [Google Scholar]
- Zhou JL, Shatskikh TN, Liu X, Holmes GL. Impaired single cell firing and long-term potentiation parallels memory impairment following recurrent seizures. Eur J Neurosci. 2007;25:3667–3677. doi: 10.1111/j.1460-9568.2007.05598.x. [DOI] [PubMed] [Google Scholar]