

Abstract
Flow cytometry has provided a powerful tool for analyzing bacteria-host cell associations. Established approaches have used bacteria, labeled either directly with fluorochromes or indirectly with fluorescently conjugated antibodies, to detect these associations. Although useful, these techniques are unable consistently to include all host cells in the analysis while excluding free, aggregated bacteria. This study describes a new flow cytometry method of assessing bacterial adherence to host cells based on direct fluorescent labeling of both bacteria and host cells. Eukaryotic host cells were labeled with PKH-26, a red fluorescent dye, and bacteria were labeled with fluorescein isothiocyanate, a green fluorescent dye. The red host cells were gated and the mean green fluorescence intensity (MFI) of these red cells was determined. We used MFI values obtained from control samples (unlabeled and labeled host cells with unlabeled bacteria) to eliminate contributions due to autofluorescence. The final MFI values represent fluorescence of host cells resulting from the adherent bacteria. Because all red fluorescent cells are analyzed, this method includes all the eukaryotic cells for analysis but excludes all free or aggregated bacteria that are not bound to target cells.
Keywords: adherence, flow cytometry, intestinal epithelial cells, macrophages, Salmonella
1. Introduction
Adherence of bacteria or their isolated components to host cells has been studied using techniques that include various types of microscopy (Lenz et al., 2000; Finlay, 2000; Hara-Kaonga and Pistole, 2004), radioisotope labeling (Negm and Pistole, 1998; Azghani et al., 2002; Fadl et al. 2002) and flow cytometry (Raybourne and Bunning, 1994; Taguchi et al., 1995; de Boer et al., 1996; Logan et al. 1998; Gaforio et al., 2002). Of these, flow cytometry is an especially powerful tool for analyzing bacteria-host cell interactions. A major advantage is that large numbers of cells can be analyzed in a short time.
Traditionally, adherence assays using flow cytometric techniques have relied on fluorescently labeled microorganisms to assess the binding of these organisms to eukaryotic cells; the eukaryotic cells are identified by their light-scattering characteristics. However, aggregates of labeled bacteria can mimic host- cell light scatter, and host cells binding large numbers of bacteria can have altered light scatter. Both of these events may lead to inaccurate assessment of the target cell population.
Lipophilic dyes PKH-2 and PKH-26 have been used to label bacteria (Raybourne and Bunning, 1994) and lymphocytes (Wallace et al., 1993), respectively. These dyes are stable, relatively nontoxic, and do not affect a variety of cell functions because they partition into the lipid region of cell membranes rather than the surface protein (Horan and Slezak, 1989; Horan et al., 1990; Wallace et al., 1993; Raybourne and Bunning, 1994; Taguchi et al., 1995).
This study describes a new flow cytometric method for assessing bacterial adherence to host cells that is based on direct fluorescent labeling of both host and bacterial cells. The direct labeling means that antibodies to bacterial or eukaryotic proteins are not required. We hypothesized that the use of direct fluorescence would allow better identification of target cells and exclusion of free bacteria.
2. Materials and Methods
2.1. Reagents
Unless otherwise noted, all reagents were obtained from Sigma-Aldrich, Inc. St. Louis, MO, U.S.A.
2.2. Bacteria and Media
Salmonella enterica serovar Typhimurium, strain 14028, was used. Bacteria were cultivated using Luria-Bertani broth or agar.
2.3. Labeling Salmonella with FITC
Bacteria were grown anaerobically, without shaking, at 37 °C for 12 h. Cells were harvested by centrifugation at 15,300×g at 4 °C for 10 min, washed 2-3× with phosphate-buffered saline (PBS) and resuspended in 5 ml of PBS. Cells were labeled with fluorescein isothiocyanate (FITC; 1 mg/ml in NaHCO3, pH 9.0) (Smith et al., 1998). Labeled cells were resuspended in 5 ml of Dulbecco's PBS (DPBS) and shaken at 37 °C to obtain a uniform suspension of cells. The number of colony-forming units was determined and cultures were stored overnight at 4 °C before use.
2.4. Growing and labeling mammalian cells
Human intestinal epithelial-like T84 cells (originally obtained from the American Type Culture Collection {ATCC; CCL-248™} and maintained in our laboratory) were grown and maintained as confluent monolayers in Dulbecco's Minimal Essential Medium-F12 HAM's medium supplemented with l-glutamine, penicillin/streptomycin, non-essential amino acids and 5% heat-inactivated fetal bovine serum, according to ATCC recommendations (www.atcc.org). Cells were grown in a humidified incubator at 37 °C with 5% CO2. They were harvested using 0.25% trypsin-EDTA.
Human macrophage-like U937 cells (originally obtained from ATCC {CRL-1593™} and maintained in our laboratory) were grown and maintained in suspension in Dulbecco's Minimal Essential Medium supplemented with l-glutamine, penicillin/streptomycin, non-essential amino acids, sodium pyruvate, and 10% fetal bovine serum, in 5% CO2, according to ATCC recommendations. Prior to use they were incubated overnight with 10-8 M phorbol myristate acetate (Rovera et al., 1979). Cells adhering to the flasks were physically dislodged by shaking and tapping the flask.
After harvesting, T84 or U937 cells were centrifuged at 400×g for 5 min at room temperature, washed once with fresh medium, and adjusted to 1×10⁷ cells/ml. Cells were labeled with PKH-26 according to Horan et al. 1990. Final staining concentration for 1×10⁷ cells/ml was 15 μM (Wallace et al. 1993; Paul K. Wallace, personal communication).
2.5. Adherence assay
FITC-labeled bacteria were statically incubated with host cells without serum in 96-well plates at 37 °C for 1 h. We included the following bacteria-to-host cell ratios: 10:1, 100:1, 500:1, and 1000:1. Samples for each ratio were prepared in triplicate for each trial. Control samples included host cells incubated with unlabeled bacteria at bacteria-to-host cell ratios of 100:1 and 500:1. Non-adherent bacteria were removed by centrifuging and washing the cells 4× with 200 μl of DPBS without Ca++ or Mg++ at 400×g at room temperature. After the final wash, each sample was resuspended in 200 μl of DPBS and transferred to a 5-ml tube. Samples were fixed by adding 200 μl of 2% paraformaldehyde to each tube. Samples were stored in the dark at 4 °C and analyzed by flow cytometry within two days. We conducted preliminary studies to determine the optimal conditions for conducting these adherence studies, including staining procedures for the eukaryotic cells and washing conditions to remove unbound bacteria, and monitored the results using fluorescence microscopy (Hara-Kaonga and Pistole, 2004).
2.6. Single vs. dual fluorescence data analysis
Samples were analyzed by a FACScan flow cytometer using CellQuest 3.3 software (Becton Dickinson, San Jose, CA). The instrument was set to detect 10,000 cells (events) per sample. Forward scatter (FSC) and side scatter (SSC) were detected using linear amplification. Fluorescence detection used logarithmic amplification (FL1 (green) = 530/30nm; FL2 (red) = 585/40 nm). In single-color analysis an FSC vs. SSC gate was designed that would allow analysis of as many eukaryotic cells as possible. For dual fluorescence, bacteria alone were analyzed by gating using FL1 vs. FL2 under the same instrument settings as for host cells; for the assay, an FL2 (red) gate was set to exclude the bacteria.
In single-color analysis, dot plots of FSC vs. SSC were generated and a gate was made from which a population of eukaryotic cells was analyzed for their green fluorescence (FL1). From these data we determined (i) the number and percentage of gated eukaryotic cells (according to the scatter characteristics) and (ii) their green mean fluorescence intensity (MFI). In dual fluorescence studies we generated FL1 vs. FL2 plots from the same dual-labeled samples to analyze the red fluorescent cells for their green fluorescence. The number and percentage of eukaryotic cells were determined from the gated red cells. To obtain the percentage of gated eukaryotic cells, we divided the number of gated events by the total number of events and multiplied by 100. Corresponding MFI (green) values were obtained from the histograms of counts vs. FL1 that were generated. Data obtained from single and dual fluorescence assays were directly compared.
2.7. Estimating the number of bacteria bound per host cell
Using a sample of bacteria alone, a single large gate designated as the region of interest (ROI) was made on the dot plots of FSC vs. SSC of FITC-labeled bacteria. This ROI was designed to exclude bacterial aggregates (Fig. 1). The fluorescence of the bacteria in this ROI was determined. The MFI of each test sample (i.e., host cells with adherent bacteria) was divided by the MFI of bacteria in the ROI to determine the estimated number of associated bacteria per eukaryotic cell. This method of estimating the number of adherent bacteria per host cell was adapted from Logan et al. (1998).
Fig. 1.
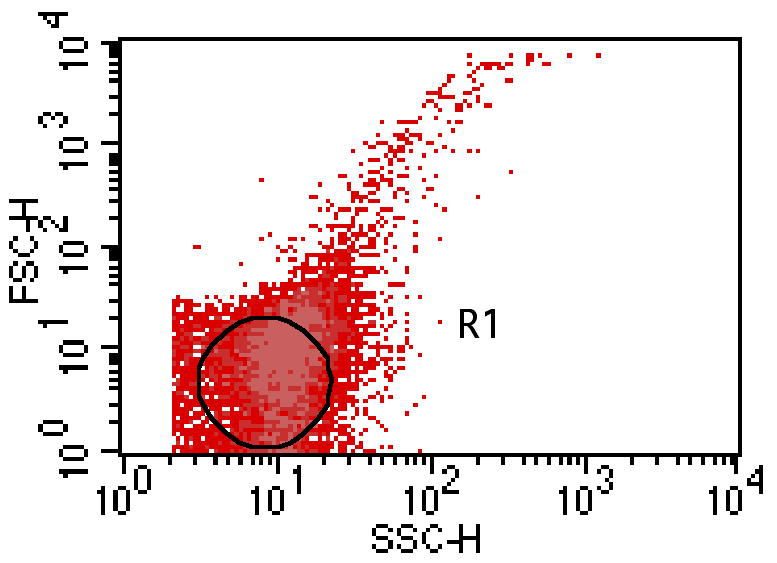
Gated region-of-interest (ROI) on dot plot of FSC vs. SSC of FITC-labeled bacteria. The ROI was positioned at the lower part of the dot plot to exclude bacterial aggregates.
2.8. Statistical Analysis
To determine the effect of PKH-26 on adherence we used randomized complete block design analysis of variance with natural log transformation. For the single vs. dual fluorescence studies we used randomized complete block design analysis of variance. In this case natural log transformation was not necessary because the data on percentages of gated cells showed relatively equal variance among the trials.
3. Results
3.1. Detecting eukaryotic cells by flow cytometry
We initially established the parameters for detecting eukaryotic cells without bacteria. For single fluorescence assays we plotted data to detect FSC and SSC patterns. A gate was designated on each dot plot to include as many eukaryotic cells (here: U937 cells) while excluding as many bacteria as possible (Fig.2a). A histogram plot of cell counts vs. FL1 (green fluorescence) was generated (Fig.2b). As expected, the level of green fluorescence in the absence of FITC-labeled bacteria was low.
Fig. 2.
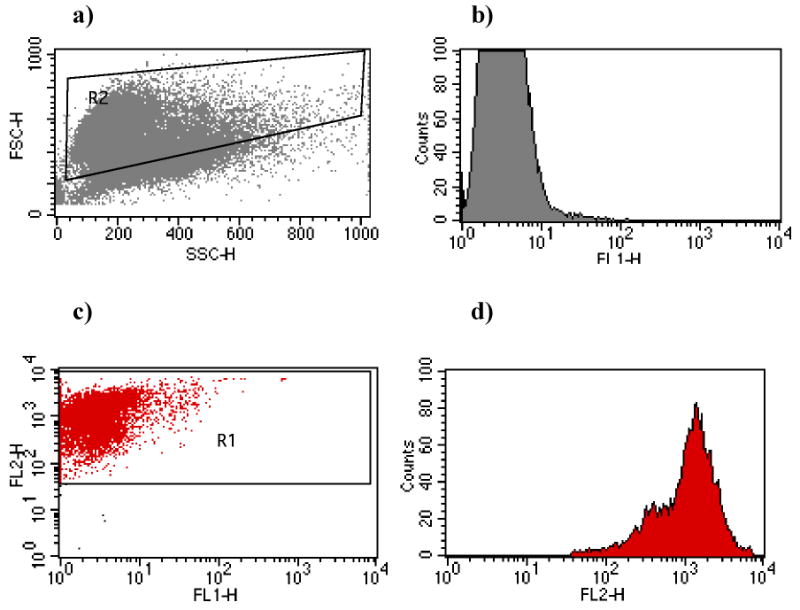
Flow cytometric measurements of host cells alone. a) Dot plot of forward (FSC) and side (SSC) scatter of unlabeled U937 cells. Gate R2 was designed for the single color assay to include as many eukaryotic cells as possible. b) Histogram plot showing the level of green fluorescence (FL1) in U937 cells without added bacteria. c) Dot plot of FL1 vs. FL2 (red fluorescence) of PKH-labeled U937 cells. Gate R1 contains the red fluorescent cells as in the dual color assay. d) Histogram plot of these labeled U937 cells showing the level of red fluorescence.
In the dual fluorescence system we plotted FL1 (green fluorescence) vs. FL2 (red fluorescence). A gate was made to include cells that had high red fluorescence (Fig.2c). A histogram plot of cell counts vs. red fluorescence confirmed that virtually all of the U937 cells were labeled. (Fig. 2d).
3.2. Excluding free bacteria from the gated samples
Since this method of measuring bacterial attachment to eukaryotic cells depends on detection of green fluorescence, it is important to confirm that free bacteria or bacterial aggregates are excluded from the gates used to measure this attachment. We generated dot plots of FSC vs. SSC of FITC-labeled bacteria under the same flow cytometry settings used to detect eukaryotic cells. The results, shown in Fig. 3a for the single fluorescence assay and Fig. 3b for the dual fluorescence assay, confirm that virtually all of the free bacteria were excluded from these gates.
Fig. 3.
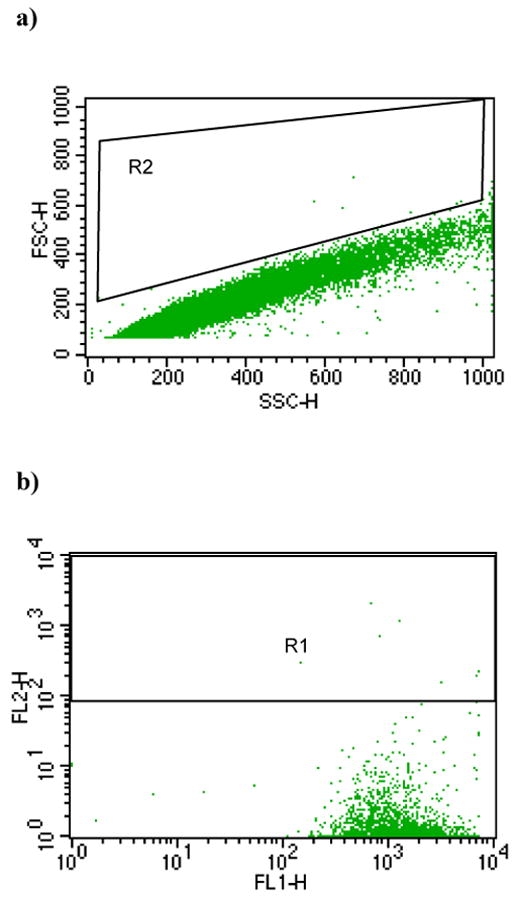
Flow cytometric measurements of bacteria alone. a). Dot-plot of FSC and SSC of green fluorescent bacteria analyzed under the same instrument settings as the host cells in Fig. 2a). b) Dot plot of FL1 and FL2 of green fluorescent bacteria analyzed under the same instrument setting as host cells in Fig. 2c). Gates R2 and R1 are the same as shown in Fig. 2a) and c), respectively.
3.3. Effect of PKH-26 label on bacterial adherence
To confirm that eukaryotic cells labeled with PKH26 dye were not altered in their ability to interact with bacteria, we compared bacterial adherence to unlabeled and to PKH-26-labeled U937 cells. In both cases we processed data as in the single-color assay. As shown in Fig. 4, there was no significant difference in bacterial adherence to the host cells at any of the bacteria:U937 ratios tested (p=0.985).
Fig. 4.

Effect of PKH26 staining of U937 cells on adherence to S. Typhimurium. Histograms show the estimated number of bacteria bound per U937 cell. Unlabeled U937 cells (gray); PHK26-labeled U937 cells (black). There was no significant difference (p=0.985) in the number of bacteria bound to unlabeled and labeled U937 cells. Error bars represent standard errors of the mean.
3.4. Comparing single and dual fluorescence analysis
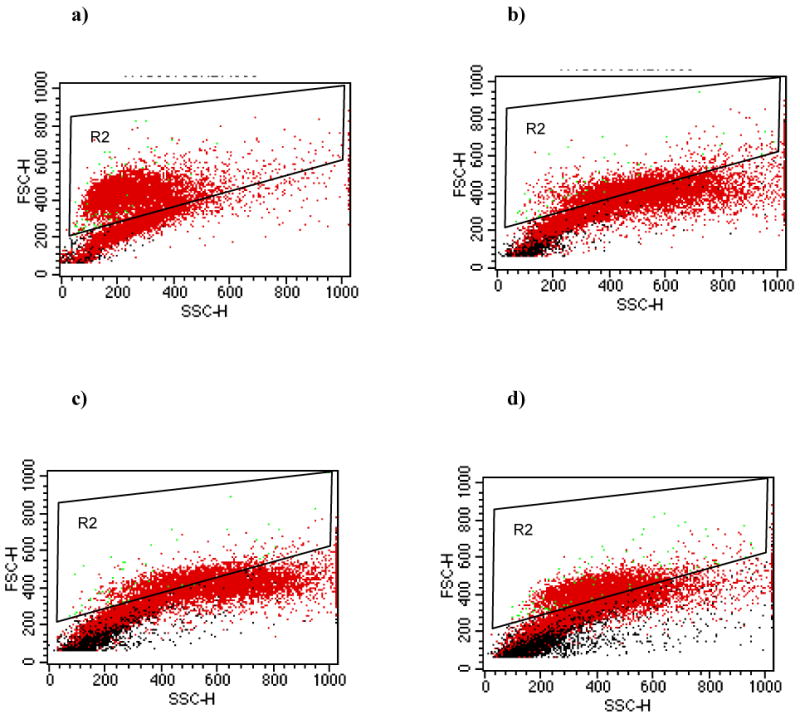
We compared bacterial binding by these two methods in seven trials with U937 cells and five trials with T84 cells. Using the gating conditions established with eukaryotic cells alone, we determined the number of eukaryotic cells with attached bacteria at various bacteria:eukaryotic cell ratios. The composite results for the U937 cell system are graphically represented in Fig. 5a. At the lowest bacteria:eukaryotic cell ratio tested (10:1), only 53% of the events in the data file were found within the selected gated area in the single fluorescence assay, compared with 94% using the dual fluorescence protocol. At the highest ratio of bacteria to eukaryotic cells (1000:1), only 8% of the events were found in the selected gated area using single fluorescence, while the dual fluorescence procedure detected 53% of the events within the gated area. Differences between the two methods were highly significant (p<0.001). Comparable results were obtained when bacterial adherence to T84 cells was measured by single and dual fluorescence (Fig. 5b). For all ratios of bacteria to T84 cells, the dual fluorescence setting was able to detect significantly more eukaryotic cells than was the single fluorescence method (p<0.001). The results for the U937 system at each bacteria:eukaryotic cell ratio are depicted as dot plots for the single fluorescence studies (Fig. 6a-d) and for the dual fluorescence studies (Fig. 7a-d).
Fig. 5.

Percentage of cells in the eukaryotic cells gate in single (S) and dual (D) fluorescence analysis. Single fluorescence analysis (FL1) was performed on host cells gated from FSC and SSC patterns. Dual fluorescence analysis (FL1 vs. FL2) was performed on host cells gated from their red fluorescence. a) Host cells: U937 cells. b) Host cells: T84 cells.
Fig. 6.
Gating of cells by FSC vs. SSC for measurement of bacterial adherence to U937 cells by the single-color fluorescence assay. Dot-plots of FSC vs. SSC of unlabeled U937 cells and FITC-labeled S. Typhimurium at bacteria:host cell ratios of (a) 10:1, (b) 100:1, (c) 500:1, and (d) 1000:1. Gate R2 is the same as described in Fig. 2a.
Fig. 7.
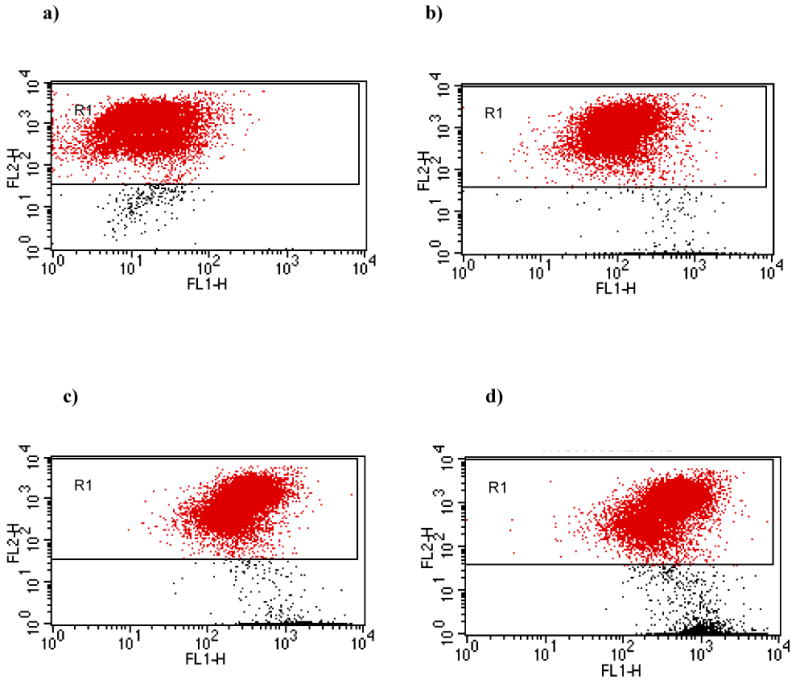
Gating of cells by red fluorescence for measurement of bacterial adherence to U937 cells by the dual fluorescence assay. Dot-plots of FL1 vs. FL2 of PHK26-labeled U937 cells and FITC-labeled bacteria at bacteria:host cell ratios of (a) 10:1, (b) 100:1, (c) 500:1, and (d) 1000:1. Gate R1 is the same as described in Fig. 2c.
4. Discussion
The standard procedure for analyzing samples by flow cytometry with a single fluorescent label involves constructing an analysis gate on a FSC vs. SSC scatter plot (see Fig. 2a). All cells within that gate are analyzed for their fluorescence of that particular label. In contrast, dual labeling uses the distinct fluorescence of eukaryotic cells for drawing the analysis gate and then a second color of the gated cells, due to the fluorescence of the bound bacteria, is used to assay adherence. Because this gate is dependent on fluorescence rather than innate cell characteristics, as is the case in single fluorescence assays, it is less susceptible to contamination from bacterial clumps that may have the same scatter properties as eukaryotic cells. Such bacterial aggregates would bear only the green fluorescence of the FITC and thus not be included in the dual fluorescence analysis. In addition, eukaryotic cells are less likely to be excluded from the gate when they bind large numbers of bacteria. These associations of host cells and bacteria would exhibit both red and green fluorescence and thus be included in the dual fluorescence analysis.
Analysis of adherence using a single label poses the following disadvantages: (i) there is subjectivity in constructing the FSC vs. SCC analysis gate; (ii) a gate may include unwanted free bacteria that get analyzed along with host cells with adherent bacteria; (iii) a particular gate may not work well for samples prepared with varying bacteria-to-cell ratios since the scatter properties of host cells change as they bind increasing of numbers bacteria. Dual labeling reduces each of these drawbacks.
For any given assay, significantly more eukaryotic cells are contained in the FL1/FL2 dual-color analysis gate than in the FSC/SSC single-color analysis gate. In the latter case, the analysis gate is designed to include as many eukaryotic cells as possible while excluding free bacteria. By so doing, some cells with adherent bacteria are excluded (see Fig. 6a-d). In contrast, the dual fluorescence system is more robust. As the ratio of bacteria to host cells increases, more “events” remain within the established gate and thus contribute to the overall assessment of adherence (see Fig. 7a-d).
Additionally, gating in a dual-color plot analysis is more specific because cells are analyzed based on two-color selection (see Fig. 2c). In this study, adherence was assessed by gating red fluorescent cells for their green fluorescence intensity. This lessens the likelihood that bacterial aggregates will be included in the analysis gate and counted as bacterial adherence to eukaryotic cells.
The excitation and emission wavelengths for FITC (a green emitter) are 495 nm (max) and 520 nm (max), respectively, and for PKH-26 (a red emitter), 488 nm (max) and 567 nm (max), respectively. We used fluorescence compensation during the data analysis, which calculates how much interference (as a percentage) a fluorochrome will have in a channel that was not assigned specifically to measure it. If both dyes are used simultaneously, as in the study, the flow cytometry software applies fluorescence compensation to minimize spectral overlap.
Other investigators have reported flow cytometric adherence assays using the green fluorescent lipophilic dye PKH-2 to label bacteria (Raybourne and Bunning, 1994; Taguchi et al. 1995). In these studies, however, the host cells remained unlabeled. Thus assessment of adherence was based solely on the fluorescence of the bacteria. We have used flow cytometry with dual fluorescence to assess the role of outer membrane proteins in the attachment of S. Typhimurium to human-derived cells (Hara-Kaonga and Pistole, 2004).
Lee and Falkow (1990) found that Salmonella grown under oxygen-limiting conditions are induced for adherence and invasiveness. We therefore used anaerobically grown bacteria in these studies.
We report a novel procedure for quantifying bacterial attachment to eukaryotic cells. Our studies indicate that binding of bacteria to eukaryotic cells changes the scatter properties of the eukaryotic cells so that they are “lost” from the scatter gate and excluded from analysis in a single fluorescence protocol. By labeling both the bacteria and the host cells with fluorescent markers we establish a flow cytometry procedure with clear advantages over single-based assays.
Acknowledgments
This research was supported by grants from the National Institutes of Health (AI147412-01) and the New Hampshire Agricultural Research Station (Hatch Project H384) to TGP. BHK was also supported through a Dissertation Fellowship from the University of New Hampshire Graduate School.
We are indebted to Dr. Alice L. Givan, Dartmouth Medical School, for help with the design and interpretation of the flow cytometry studies. We thank Dr. Paul Wallace, Roswell Park Cancer Institute, for advice on and assistance with mammalian cell labeling, and Prof. Christopher Neefus, University of New Hampshire, for assistance with the statistical analyses.
This is scientific contribution number 2270 from the New Hampshire Agricultural Experiment Station.
References
- Azghani AO, Idell S, Bains M, Hancock RE. Pseudomonas aeruginosa outer membrane protein F is an adhesin in bacterial binding to lung epithelial cells in culture. Microb Pathog. 2002;33:109–114. doi: 10.1006/mpat.2002.0514. [DOI] [PubMed] [Google Scholar]
- de Boer EC, Bevers RF, Kurth KH, Schamhart DH. Double fluorescent flow cytometric assessment of bacterial internalization and binding by epithelial cells. Cytometry. 1996;25:381–387. doi: 10.1002/(SICI)1097-0320(19961201)25:4<381::AID-CYTO10>3.0.CO;2-R. [DOI] [PubMed] [Google Scholar]
- Fadl AA, Venkitanarayanan KS, Khan MI. Identification of Salmonella enteritidis outer membrane proteins expressed during attachment to human intestinal epithelial cells. J Appl Microbiol. 2002;92:180–186. doi: 10.1046/j.1365-2672.2002.01511.x. [DOI] [PubMed] [Google Scholar]
- Finlay BB. Fluorescence and confocal microscopy reveal host-microbe interactions. ASM News. 2000;66:601–608. [Google Scholar]
- Gaforio JJ, Serrano MJ, Ortega E, Algarra I, Alvarez de Cienfuegos G. Use of SYTOX green dye in the flow cytometric analysis of bacterial phagocytosis. Cytometry. 2002;48:93–96. doi: 10.1002/cyto.10107. [DOI] [PubMed] [Google Scholar]
- Hara-Kaonga B, Pistole TG. OmpD but not OmpC is involved in adherence of Salmonella enterica serovar Typhimurium to human cell. Can J Microbiol. 2004;50:719–727. doi: 10.1139/w04-056. [DOI] [PubMed] [Google Scholar]
- Horan PK, Slezak SE. Stable cell membrane labeling. Nature. 1989;340:167–168. doi: 10.1038/340167a0. [DOI] [PubMed] [Google Scholar]
- Horan PK, Melinicoff MJ, Jensen BD, Slezak SE. Fluorescent cell labelling for in vivo and in vitro cell tracking. Methods Cell Biol. 1990;33:469–490. doi: 10.1016/s0091-679x(08)60547-6. [DOI] [PubMed] [Google Scholar]
- Lee CA, Falkow S. The ability of Salmonella to enter mammalian cells is affected by bacterial growth state. Proc Natl Acad Sci USA. 1990;87:4304–4308. doi: 10.1073/pnas.87.11.4304. [DOI] [PMC free article] [PubMed] [Google Scholar]
- Lenz DH, Weingert CL, Weiss AA. Phagocytosed Bordetella pertussis fails to survive in human neutrophils. Infect Immun. 2000;68:956–959. doi: 10.1128/iai.68.2.956-959.2000. [DOI] [PMC free article] [PubMed] [Google Scholar]
- Logan RPH, Robins A, Turner GA, Cockayne A, Borriello SP, Hawkey CJ. A novel flow cytometric assay for quantitating adherence of Helicobacter pylori to gastric epithelial cells. J Immunol Methods. 1998;213:19–30. doi: 10.1016/s0022-1759(98)00018-0. [DOI] [PubMed] [Google Scholar]
- Negm RS, Pistole TG. Macrophages recognize and adhere to an OmpD-like protein of Salmonella typhimurium. FEMS Immunol Med Microbiol. 1998;20:191–199. doi: 10.1111/j.1574-695X.1998.tb01127.x. [DOI] [PubMed] [Google Scholar]
- Raybourne RB, Bunning VK. Bacterium-host cell interactions at the cellular level: fluorescent labeling of bacteria and analysis of short-term bacterium- phagocyte interaction by flow cytometry. Infect Immun. 1994;62:665–672. doi: 10.1128/iai.62.2.665-672.1994. [DOI] [PMC free article] [PubMed] [Google Scholar]
- Rovera G, Santoli D, Damsky C. Human promyelocytic leukemia cells in culture differentiate into macrophage-like cells when treated with a phorbol diester. Proc Natl Acad Sci U S A. 1979;76:2779–2783. doi: 10.1073/pnas.76.6.2779. [DOI] [PMC free article] [PubMed] [Google Scholar]
- Smith LM, Laganas V, Pistole TG. Attachment of group B streptococci to macrophages is mediated by a 21-kDa protein. FEMS Immunol Med Microbiol. 1998;20:89–97. doi: 10.1111/j.1574-695X.1998.tb01114.x. [DOI] [PubMed] [Google Scholar]
- Taguchi H, Osaki T, Yamaguchi H, Kamiya S. Flow cytometric analysis using lipophilic dye PKH-2 for adhesion of Vibrio cholerae to Intestine 407 cells. Microbiol Immunol. 1995;39:891–894. doi: 10.1111/j.1348-0421.1995.tb03286.x. [DOI] [PubMed] [Google Scholar]
- Wallace PK, Palmer LD, Perry-Larry D, Bolton ES, Alexander RB, Horan PK, Yang JC, Muirhead KA. Mechanisms of adoptive therapy: improved methods for in vivo tracking of tumor-infiltrating lymphocytes and lymphokine-activated killer cells. Cancer Res. 1993;53:2358–2367. [PubMed] [Google Scholar]