

Abstract
High-throughput studies to determine differential immune (humoral) response to diseases are becoming of increasing interest because the information they provide can help in early diagnosis as well as monitoring of therapeutics. Protein microarrays are a high-throughput and convenient technology that can be applied to the study of the humoral response. Proteins can be arrayed on slides and then probed with serum from different classes of patients to observe differences that may exist among autoantibodies that reflect differences in disease states. However, such studies may be difficult to interpret due to the weak overall signal response of such protein microarrays. We propose that this weak signal response is due to the physical positioning of the disease proteins that renders them sterically hindered from binding partners in the serum. In this study, we hypothesize that reducing the complexity and size of the disease proteins by chemical digestion using cyanogen bromide (CNBr) may enhance the overall signal from the humoral response and facilitate visualization of disease-specific responses in various classes of serum. A modified protein microarray methodology using CNBr digestion is presented here. The new workflow was applied to a set of 10 serum samples from healthy subjects, 10 from patients with chronic pancreatitis and 10 from patients diagnosed with pancreatic cancer and the results were compared to results obtained in the absence of CNBr digestion. CNBr digestion allowed the identification of 10 additional autoantibodies that responded to serum, 5 of which were unique to pancreatitis and cancer sera. This new methodology may increase the sensitivity of microarray studies measuring autoantibodies in serum.
Keywords: Protein microarray, chromatofocusing, NPS-RP-HPLC, tandem mass spectrometry, humoral response, pancreatic cancer
1. Introduction
Proteome profiling has become a field of increasing interest since protein expression profiles may be a more relevant biological readout of cell systems than transcriptional profiles. The use of protein microarrays facilitates high-throughput screening of such protein expression profiles.1-3 Multiple antibody or antigen probes are located at fixed and unique positions on a microarray chip facilitating interrogation of several thousand sample components simultaneously. Protein chips have emerged in a variety of different formats the most common of which is the antibody microarray where antibodies are immobilized on an array surface to capture proteins of interest.3-10 Such studies are important when assessing binding properties of already known target proteins, but novel proteins involved in disease progression may be overlooked. Furthermore well-characterized antibodies with high specificities to proteins of interest are difficult to develop and relatively expensive for routine use.
Autoantibody (humoral) response studies can provide critical information about a body’s response to disease antigens. In such studies, potential antigens are arrayed on a slide and probed with serum from various classes of patients, that is, normal versus disease. It is assumed that there will be antibodies in the serum sample of disease patients produced as a reaction to some of the antigens printed on the arrays. Previous reports have shown the presence of such antigen-antibody reactions as a result of disease.11-18 In recent work, a novel approach has been demonstrated where natural proteins from a cancer cell or tissue are first resolved by a two-dimensional liquid separation and are then arrayed on thin nitrocellulose microarray slides.19,20 All proteins from the cell line are then simultaneously probed with a large number of serum samples to highlight immune responses that can differentiate between normal and disease sera.
One area of difficulty in these types of humoral response experiments is the low signal intensity that is often present in the arrays. While differential responses are observed for certain potential cancer protein markers, the response overall is not remarkably high. It is our hypothesis that this weak response could be a result of protein immobilization on the slide which renders the protein unable to move about such that binding sites are blocked from reagent molecules. We propose that reducing the protein size by chemical means may facilitate exposure of these binding sites thereby enhancing the overall sensitivity of the humoral response experiments. It should be noted that pretreatment with chemical digestion would allow measurement of epitope-sensitive interactions that only requires a certain amino acid sequence and no specific protein confirmation since the protein confirmation will be compromised.
Reduction of the protein size can easily be accomplished by protein digestion. A variety of techniques for protein digestion are currently available; however, digestion into very small fragments may completely destroy epitopes where antibody/antigen binding occurs, making it important to select enzymes or reagents with care. An ideal digestion protocol would reduce the protein into a few long peptide fragments rather than many small fragments.
In this report, a comparison of a digestion method versus undigested proteins is performed after protein fractionation but before printing to assess the improvement in humoral response data (Figure 1). A pancreatic cancer cell line (Panc1) was lysed and the extracted proteins were separated in two dimensions. The separated proteins were then either directly arrayed on nitrocellulose slides or chemically digested using cyanogen bromide (CNBr) and then arrayed on the same slides. The arrays were then processed with serum samples from 10 normal individuals, 10 chronic pancreatitis and 10 pancreatic cancer patients. Humoral response to digested versus undigested proteins was then compared to evaluate if digestion improved response. Furthermore, differences seen between the different serum classes was further interrogated by identification of the protein eliciting the humoral response using liquid chromatography coupled with tandem mass spectrometry (LC-MS/MS).
Figure 1.

Overall workflow of the modified protein microarray strategy. Proteins from a cell line/tissue are first extracted and separated in two dimensions (chromatofocusing separated the proteins according to their pI and NPS-RP-HPLC separated them according to their hydrophobicity). Separated fractions are split into three parts. One part is digested with trypsin, one with CNBr, and one is left intact. Intact proteins and CNBr-digested proteins are arrayed on nitrocellulose slides and probed with serum from different stages of disease (in this case, normal, chronic pancreatitis, and pancreatic cancer) to visualize humoral response. Tryptic digests of the spots that showed a differential humoral response were then subjected to protein identification using LC-MS/MS.
2. Methods
2.1. Cell Culture, Sample Preparation, and Serum Collection
2.1.1. Sample Preparation
2.1.1.1. Cell Culture
Studies were performed using the Panc-1 pancreatic adenocarcinoma cell line (obtained by ATCC). The cells were cultured in Dulbecco’s modified Eagle medium supplemented with 10% fetal bovine serum, 100 units/mL penicillin and 100 units/mL streptomycin (Invitrogen, Carlsbad, CA). When the cells reached ∼90% confluence, the cells were harvested with a cell scraper.
2.1.1.2. Cell Lysis
Cell pellets were reconstituted in lysis buffer consisting of 7.5 M urea, 2.5 M thiourea, 4% n-octyl-d-glucopyranoside (n-OG), 10 mM Tris (2-carboxyethyl) phosphine (TCEP), 12.5% (v/v) glycerol, and 1% (v/v) protease inhibitor cocktail (Sigma, St. Louis, MO). The cell pellets were lysed at room temperature for 1 h, followed by centrifugation at 35 000 rpm at 4 °C for 1 h. The supernatant was buffer-exchanged into start buffer (6 M urea, 25 mM Bis-Tris, and 0.2% OG) using a PD-10 G-25 column (Amersham Biosciences, Piscataway, NJ) and stored at -80 °C until further use.
2.1.1.3. Serum Collection
Serum was obtained at the time of diagnosis following informed consent using IRB-approved guidelines. Sera were obtained from 10 patients with a confirmed diagnosis of pancreatic adenocarcinoma in the Multi-disciplinary Pancreatic Tumor Clinic at The University of Michigan Hospital. These sera were randomly selected from a clinic population that sees, on average, at the time of initial diagnosis, 15% of pancreatic adenocarcinoma patients presenting with early stage (i.e., stage 1/2) disease and 85% presenting with advanced stage (i.e., stage 3/4). Inclusion criteria for the study included patients with a confirmed diagnosis of pancreatic cancer, the ability to provide written, informed consent, and the ability to provide 40 mL of blood. Exclusion criteria included inability to provide informed consent, patient’s actively undergoing chemotherapy or radiation therapy for pancreatic cancer, and patients with other malignancies diagnosed or treated within the last 5 years. Sera were also obtained from 10 patients with chronic pancreatitis who were seen in the Gastroenterology Clinic at University of Michigan Medical Center, and from 10 control healthy individuals collected at University of Michigan under the auspices of the Early Detection Research Network (EDRN). The mean age of the tumor group was 65.4 years (range 54-74 years) and from the chronic pancreatitis group was 54 years (range 45-65). The sera from the normal subject group was age and sex-matched to the tumor group. All of the chronic pancreatitis sera were collected in an elective setting in the clinic in the absence of an acute flare. All sera were processed using identical procedures. The samples were permitted to sit at room temperature for a minimum of 30 min (and a maximum of 60 min) to allow the clot to form in the red top tubes, and then centrifuged at 1300g at 4 °C for 20 min. The serum was removed, transferred to a polypropylene, capped tube in 1 mL aliquots, and frozen. The frozen samples were stored at -70 °C until assayed. All serum samples were labeled with a unique identifier to protect the confidentiality of the patient. The handling of all serum samples was similar in that none of the samples were thawed more than twice before analysis in order to minimize protein degradation and precipitation.
2.2. Separation
2.2.1. Chromatofocusing (CF)
CF separation was performed on an HPCF-1D column (250 × 2.1 mm) (Beckman-Coulter, Fullerton, CA) using the ProteomeLab PF2D protein fractionation system (Beckman-Coulter), as described previously.21,22 Two buffers were used to generate the pH gradient on the column. The start buffer (SB) solution was composed of 6 M urea and 25 mM Bis-Tris (pH 7.4). The elution buffer (EB) solution was composed of 6 M urea and 10% polybuffer74 (pH 4.0). Both buffer solutions were brought to pH by addition of a saturated solution of iminodiacetic acid. The CF column was pre-equilibrated with SB. After equilibration, 4.5 mg of proteins were loaded onto the CF column and the column was washed with 100% SB to remove material that did not bind to the column at pH 7.4. Elution was achieved by applying a pH 4.0 elution buffer at a flow rate of 0.2 mL/min. The pH gradient was monitored online by a flow-through pH probe (Beckman-Coulter). The UV absorbance of the eluent was monitored online at 280 nm. The flow rate was 0.2 mL/min, with 16 fractions in total being collected in 0.2 pH units in the range of pH 7.0-4.0. Each fraction was stored at -80 °C until further use.
2.2.2. Non-Porous Silica Reversed-Phase (NPS-RP)-HPLC with Sample Collection
When the first-dimension separation was completed, the pI fractions collected from the first dimension were separated by NPS-RP-HPLC using an ODSIII (4.6 × 33 mm) NPS column (Eprogen) at a flow rate of 0.5 mL/min and detected by absorbance at 214 nm using a Beckman model 166 UV absorption detector. Proteins eluting from the column were collected by an automated fraction collector (Model SC 100, Beckman), controlled by an in-house designed DOS-based software program. To enhance the speed, resolution, and reproducibility of the separation, the RP column was heated to 65 °C by a column heater (Jones Chromatography, Model 7971, Resolution Systems, Holland, MI). Mobile phase A, MilliQ water (Millipore, Billerica, MA), and solvent B, acetonitrile (ACN) (Sigma), contain 0.1% (v/v) and 0.08% (v/v) trifluoroacetic acid (TFA), respectively. The gradient was run from 5% to 15% in 1 min, 15-25% B in 2 min, 25-31% in 2 min, 31-41% in 10 min, 41-47% in 6 min, 47-67% in 4 min, then up to 100% B in 3 min where it was held for 1 min, and then reduced to 5% in 1 min. After the gradient, the column was washed by two fast gradients from 5% to 100% B in 5 min, 100% B back to 5% B in 1 min. Fractions from the HPLC eluent were collected using a semiautomated in-house program using a Model SC-100 fraction collector. Collected peak fractions were stored at -80 °C for further use.
2.3. Protein Digestion by CNBr
For digestion with CNBr, collected fractions were then dried down and resuspended in 5 μL of deionized water, 15 μL of TFA and 5 μL of 5 M CNBr in ACN. The tubes were wrapped in aluminum foil and left overnight at 4 °C.
2.4. Microarray Printing
Fractionated proteins were transferred to 96-well printing plates (Bio-Rad) and were completely dried using a Speed-Vac set at 60 °C. Drying at 60 °C ensured removal of the volatile CNBr. The fractions were then resuspended in printing buffer (62.5 mM Trizma-hydrochloride (Tris-HCl) (pH6.8), 1% (w/v) sodium dodecyl sulfate (SDS), 5% (w/v) dithiothreitol (DTT) and 1% glycerol in 1 × phosphate-buffered saline (PBS) and were left to shake overnight at 4 °C. Slides were printed by transferring each fraction from the plate onto nitrocellulose slides using a noncontact piezoelectric printer (Nanoplotter 2, GeSiM). Each spot resulted from deposition of 5 spotting events of 500 pL each, such that a total volume of 2.5 nL of each fraction was spotted. Each spot was found to be ∼450 μm in diameter, with the distance between spots maintained at 600 μm. Printed slides were left on the printer deck overnight to dry and were then stored, desiccated at 4 °C until further use.
2.5. Hybridization of Slides and Data Analysis
The printed arrays were rehydrated in 1× PBS with 0.1% Tween-20 (PBS-T), and were then blocked overnight in a solution of 1% bovine serum albumin (BSA) in PBS-T. Each serum sample was diluted 1:400 in probe buffer (5 mM magnesium chloride, 0.5 mM DTT, 0.05% Triton X-100, 5% glycerol and 1% BSA in 1× PBS) to make a total solution of 4 mL and kept on ice. Each diluted serum sample was used to hybridize a slide for 2 h. Hybridization was done at 4 °C in heat-sealable pouches with agitation, using a mini-rotator. The slides were then washed five times with probe buffer (5 min each), and were then hybridized with 4 mL of anti-human IgG conjugated with Alexaflour647 (Invitrogen, Carlsbad, CA) (at 1 μg/mL), for 1 h at 4 °C. After secondary incubation, all slides were washed in probe buffer five times, for 5 min each, and were then dried by centrifugation for 10 min. All processed slides were immediately scanned using an Axon 4000B microarray scanner (Axon Instruments, Inc., Foster City, CA) and GenePix Pro 6.0 software (Molecular Devices, Sunnyvale, CA) was used for data acquisition and analysis. For spots that showed a positive potentially differential response with CNBr but not with whole protein, t tests were performed to estimate the significance of the differential response. A 90% confidence level was chosen due to the small sample pool used such that differential responses with p-values of ≤0.1 were considered to be significant in this study.
2.6. Protein Identification
Proteins were trypsinized in a solution of 100 mM ammonium bicarbonate and 1 mM DTT. The samples digested by trypsin were separated by a capillary reversed-phase column (C18, 0.3 × 150 mm) (Michrom Biosciences, Auburn, CA) on a Paradigm MG4 micropump (Michrom Biosciences) with a flow rate of 300 nL/min. The gradient, started at 5% ACN, was ramped to 60% ACN in 25 min and finally ramped to 95% in another 5 min. Both solvents A (water) and B (ACN) contained 0.3% formic acid. The resolved peptides were analyzed on a Finnigan LTQ mass spectrometer (Thermo Electron Corp., San Jose, CA) with a nanoESI ion source (Thermo). The capillary temperature was set at 190 °C, spray voltage was 2.6 kV, and capillary voltage was 30 V. The normalized collision energy was set at 35% for MS/MS. The top 5 peaks were selected for collision induced dissociation (CID). Precursor selection was based upon a normalized threshold of 30 counts/s. MS/MS spectra were searched using the SEQUEST algorithm incorporated in Bioworks software (Thermo) against the Swiss-Prot human protein database. The search was performed using the following parameters: two miscleavages were allowed during the database search; peptide ion mass tolerance, 1.50 Da; fragment ion mass tolerance, 0.0 Da; protein identification was considered positive for a peptide with Xcorr of greater than or equal to 3.5 for triply, 2.5 for doubly, and 1.9 for singly charged ions.
3. Results and Discussion
3.1. Protein Separation Methods
In this study, proteins extracted from the Panc1 pancreatic cancer cell line were separated in two relatively orthogonal dimensions for maximum peak capacity. In the first dimension, the proteins were separated according to their isoelectric points by a liquid phase separation technique, chromatofocusing. It has been shown that such a technique is able to separate proteins whose isoelectric points are as low as 0.2 pH units apart or less. In the second dimension, each fraction from chromatofocusing was further separated by nonporous reversed phase HPLC. Nonporous particles eliminated column clogging problems associated with separation of large proteins using porous columns. Separation times and quality were also optimized due to the short column length of 33 mm and separation temperature of 65 °C which reduced diffusional broadening.
Figure 2 illustrates the separation quality and reproducibility of each dimension of separation. Figure 2a shows three independent CF runs together with the pH profile of each run. It is evident that the pH profiles of all runs are very similar as are the peak profiles. It can also be seen that the peaks and valleys in the profiles correspond to the pH changes and not the retention times so that even if there is a slight change in the pH profile, the proteins eluting over each pH interval will always be the same. Figure 2b illustrates similar reproducibility data generated for the second-dimension separations. Separations done on two distinct pH lanes (5.2-5.0 and 6.6-6.4) from CF are shown. Again, it was observed that peak profiles were almost identical in all four cases. For the second-dimension profile of pH fraction 5.2-5.0, the bottom-most chromatogram has one peak missing which was due to a pressure drop that occurred in the instrument for a short period of time. The reproducibility data suggests that the two-dimensional liquid separation used in this study was robust, reliable and reproducible for further studies.
Figure 2.

Reproducibility of separation methods used. (a) Three chromatofocusing runs using 4.5 mg of protein lysate from Panc1 cell lines. (b) Four reversed phase HPLC runs from two distinct pH fractions from the first dimension. Red arrows indicated fractions/peaks that responded to serum when digested by CNBr and blue arrows indicated fractions/peaks that responded to serum when arrayed in its intact state.
3.2. Digestion Protocols
In humoral response experiments using undigested proteins, we separated cellular cancer proteins and printed them on nitrocellulose slides in their intact form. However, the overall response of these arrays to serum remained low in most experiments. While some differences in response were statistically different between normal and cancer sera, the overall fold differences were not very high. We hypothesized that the low response correlated with the lack of access to binding sites as illustrated in Figure 3. When the protein is intact, the binding site, which would potentially react with serum proteins, could be in a sterically unfavorable position, resulting in low binding. If this protein was cleaved into a few pieces, it is possible that the autoantibody binding site would be more favorably located during the array hybridization process.
Figure 3.
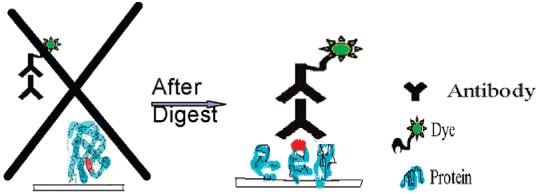
Hypothesis on the reason intact protein microarrays may not show high response signal. Binding site on protein is sterically hindered from serum proteins when the arrayed protein is intact. After digestion with CNBr, fragments with conserved binding sites are more exposed to serum proteins enhancing the signal due to humoral response.
The digestion method chosen to study this hypothesis is critical. A protocol that would cleave the proteins into too many fragments may not be appropriate because this would potentially destroy the binding site. Trypsin is a popular enzyme of choice in attempts at protein identification. However, the very property of trypsin that is favorable for peptide mass finger-printing (PMF) experiments (two cleavage sites that lead to many peptide fragments) is not favorable for the purpose of our study. We have therefore utilized an alternative method to assess the effect of digestion on the humoral response. Chemical digestion using CNBr was used. CNBr cleaves after methionine residues, and because the occurrence of methionine in proteins is very low, cleavage by CNBr should result in very few, long peptides, possibly conserving the binding site for humoral response experiments. Peptides resulting from CNBr digestion could consequently be up to 4 or more times larger than peptides resulting from trypsin digestion.
3.3. Array Hybridization
The separated proteins were first divided into 3 fractions and each fraction was used as follows: fraction 1, intact for microarray, fraction 2, digested with CNBr for microarray, and fraction 3, digested with trypsin for identification. All fractions for microarray analysis were completely dried down at 60 °C using a Speed-Vac concentrator and arrayed using a noncontact arrayer, Nanoplotter 2.0E (GeSiM, Germany). Volatile CNBr was removed during this process. The arrays were then probed with serum samples from 10 normal subjects, 10 patients with chronic pancreatitis and 10 patients with pancreatic cancer. It should be noted that throughout the experiment denaturing conditions were used. Hybridization solutions utilized SDS and DTT keeping proteins in a soluble and unfolded state. Methods for protein renaturation are available. These methods include dilution of protein in a buffered renaturing solution or more sophisticated chromatographic approaches. However, dilution of the protein would not work in this strategy since, prior to printing the proteins, the sample is dried and resuspended in a smaller volume which would reconcentrate them again and cause the proteins to reaggregate into a nonactive state. The more sophisticated chromatographic approaches, on the other hand, vary depending on the protein being renatured.23-26 In our strategy where multiple proteins are being arrayed on a single slide, such a renaturation approach would be difficult and not feasible given the low sample amounts used. Therefore, continuous denaturing conditions were applied to ensure that the protein was not renaturing into a biologically irrelevant conformation or aggregating into larger clusters so that the binding motif was continuously exposed to the serum during hybridization.
Figure 4 illustrates sections of microarray slides probed with serum to compare the two different array-hybridization protocols. The top panel reflects the humoral response to intact proteins arrayed onto nitrocellulose slides. It can be seen that the response is very weak for the fractions from the pH range shown. Interestingly, the bottom panel shows the humoral response to CNBr-digested protein fractions where at least 1 spot shows significantly higher response to serum when digested by CNBr compared to when arrayed as an intact protein. In addition, 3 other spots show a slightly higher response when digested compared to when arrayed as intact proteins.
Figure 4.
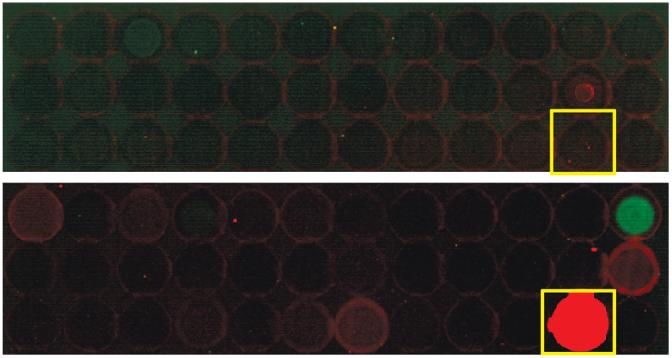
Microarray slide section illustrating differences in humoral response using 2 separate arraying methods. The top panel shows intact proteins from Panc1 cell lines probed with serum resulting in very low overall response. The lower panel shows humoral response to CNBr-digested proteins from the same Panc1 cell line. While the overall background is maintained at a low level, spots inside the yellow square illustrate a humoral response that was not present when the same protein in its intact state was probed with serum.
When comparing the 62 fractions that were printed from the proteins from 2 separate pH lanes of the first dimensional separation, it was observed that 10 spots showed a very distinct response to serum when arrayed after CNBr digestion (a >10% improvement). These same spots did not show any response to serum when arrayed as intact proteins. By performing a simultaneous humoral response experiment with both a control (intact proteins) and test (digested with CNBr) set, it was confirmed that digestion by CNBr prior to arraying facilitates an improved response making it possible to identify changes in humoral response that may be present between two different classes of sera. We believe that digestion with CNBr shows an enhanced humoral response that is clinically relevant and not just due to nonspecific binding because only specific spots showed an enhanced response with this digestion strategy.
3.4. Initial Study Toward Differential Humoral Response in Pancreatic Cancer Using CNBr-Digested Proteins
After confirming that CNBr digestion increases the sensitivity of the humoral response results, 10 normal, 10 chronic pancreatitis and 10 pancreatic cancer sera were hybridized with arrays printed with intact proteins and CNBr-digested proteins to see if there was a group-specific trend in the humoral response that resulted in improved detection with CNBr-digested arrays. To that effect, proteins from pH lanes 5.2-5.0 and 6.6-6.4 were fractionated by NPS-RP-HPLC. They were then divided into two parts, one of which was directly arrayed on nitrocellulose slides as intact proteins. The other divided fraction was subjected to CNBr digestion after which it was arrayed on the same nitrocellulose slides as the intact proteins. Thirty slides were printed and each was hybridized with serum from the 10 normal, 10 chronic pancreatitis and 10 pancreatic cancer sera.
The arrays were scanned in the red channel to detect a humoral response. Some green fluorescent spots were also present for quality control purposes. Background subtracted data from both sets of experiments, that is, intact protein results for all three sera classes and digested protein results for all three sera classes were then compared to see if there was any differential response between the classes that were more visible in the CNBr-digested sample data. A spot intensity of ≥2-fold greater than the background intensity was required for the spot to be considered positive. At least 50% of the cancer and pancreatitis spots needed to show a higher response than the second highest normal spot response in order for the response to be considered significantly different in the groups.
Five spots showed a differential humoral response using the criteria above when the spots were digested with CNBr but not when they were arrayed in an intact state. A comparison of some of these humoral responses is shown in Figure 5. On the left are all sera responses to intact spots while on the right are sera responses to spots that were digested with CNBr. On the plots, N refers to normal sera group, P refers to the chronic pancreatitis sera group and C refers to the pancreatic cancer sera group. For the digested spot responses, a broken line is shown to indicate the number of cancer samples that showed a higher response than the second highest normal serum response. It can be seen that in all cases at least 50% (5/10) of the chronic pancreatitis and pancreatic cancer samples showed higher reactivity in the studied fractions when digested with CNBr compared to when arrayed as intact proteins. Interestingly, in Figure 5b-d, the response to the intact spots was generally very low (almost at background fluorescence level), while the same response in the case of the spots digested with CNBr was significantly higher. On the contrary, as shown in Figure 5a and e, it was observed that while the overall signal intensities were not very low when intact protein spots were probed with sera from different groups, there was no indication of differential humoral response between the normal and disease sample group. However, when digested with CNBr, a differential humoral response became very evident despite the slightly lower overall signal intensity. A statistical calculation was also performed to see if what was considered differential based on the criteria stated above truly did show a reasonable significance level. T tests were done for spots appearing to elicit significant differences between normal versus pancreatitis and normal versus cancer. P-values that resulted from these test were mostly <0.1, making them significant in this relatively small sample pool that was studied. These values are listed in Table 1.
Figure 5.

Scatter plots illustrating change in humoral response upon protein digestion with CNBr. (a-e) The five spots that demonstrated differential humoral response between norma sera and pacreatitis and pancreatic cancer sera. On the left are scatter plots of all serum sample reactions to the intact spot, while on the right are scatter plots of all serum sample responses to the CNBr digested spots. In all plots, N = normal sera responses, P = chronic pancreatitis responses and C = pancreatic cancer responses.
Table 1.
Protein Identifications of Spots That Demonstrated a Differential Humoral Response between the Three Sera Sample Groups Used with Additional Information about Peptides Identified and Coverages Observed
| pH_fraction number from HPLC run | spot loci (block, column, row on array) | acc. no. | protein ID peptide identified | protein score charge | theoretical MW Xcorr | t test P-value (normal vs pancreatitis) | t test P-value (normal vs cancer) |
|---|---|---|---|---|---|---|---|
| 5.2-5.0_23 | 861 | O60220 | Mitochondrial import inner membrane translocase subunit Tim8 A | 100 | 10992 | 0.11 | 0.08 |
| SKPVFSESLSD | 2 | 3.7 | |||||
| 5.2-5.0_36 | 762 | Q13404 | Ubiquitin-conjugating enzyme E2 variant 1 (UEV-1) | 120 | 25781 | 0.08 | 0.03 |
| LLEELEEGQK | 2 | 3.4 | |||||
| YPEAPPFVR | 2 | 2.7 | |||||
| 5.2-5.0_47 | 812 | Insufficient sample for IDs | 0.04 | 0.04 | |||
| 5.2-5.0_52 | 862 | Insufficient sample for IDs | 0.06 | 0.21 | |||
| 6.6-6.4_73 | 637 | Q13011 | Delta(3,5)-Delta(2,4)-dienoyl-CoA isomerase | 336 | 35794 | 0.08 | 0.14 |
| YQETFNVIER | 2 | 3.2 | |||||
| EVDVGLAADVGTLQR | 2 | 5.1 | |||||
| VIGNQSLVNELAFTAR | 2 | 5.1 | |||||
| MMADEALGSGLVSR | 2 | 5.4 |
The 5 spots that were identified as eliciting a differential humoral response were further interrogated by mass spectrometry to determine the proteins present in the spots. Table 1 shows the identity of the proteins and relevant information with respect to the protein identification. Out of the 5 spots of interest, identification was only possible for three spots. In the other two cases, the sample amount was insufficient for conclusive identification.
Two of the three proteins identified were mitochondrial proteins not previously implicated in pancreatic cancer. The third identified protein was ubiquitin-conjugating enzyme E2 variant 1. While this particular protein has not been previously associated with pancreatic cancer, another variant of the ubiquitin-conjugating enzyme has been previously implicated in pancreatic cancer and has been linked to a T-cell mediated recognition of pancreatic cancer cell.27 An immune response to this class of protein has therefore been shown previously, suggesting that the body is responding to the cancer via the ubiquitin pathway. Such a protein could be a potential target of interest both for diagnostics and therapeutic purposes. However, due to the small sample numbers used as a proof of concept set for the digested array strategy, further experimentation with much larger sample pools is necessary in order to draw more biologically relevant conclusions about pancreatic cancer progression.
4. Conclusion
Studies designed to enhance our understanding of the host response to cancer, that is, humoral response, can provide key information regarding potential markers of the cancer as well as important pathways critical to the development of the disease. However, current efforts at understanding this response using microarray approaches are hampered by low response of cancer proteins on the array surface to serum samples that are used to probe the arrays. Here, we present a possible explanation for this weak response and a potential strategy to overcome the problem.
It is possible that, upon immobilization to a solid surface, the protein on the array is unable to bind to potential binding partners in serum because the binding site on the protein is sterically hindered. To overcome this problem, we have developed a strategy where protein is first digested using CNBr resulting in a few large fragments that are subsequently arrayed on the microarray surface. Depending on the size of the protein, such a digestion could result in 2 to up to 6 fragments. Digestion into large fragments is likely critical to allow fragments to still possess the binding sites in their intact form, whereas if digestion into many smaller fragments was performed, the binding site may be destroyed. Preliminary results show that digestion prior to arrays facilitates increased detection sensitivity of the overall humoral response. In addition, when the experiment was repeated with 10 normal, 10 chronic pancreatitis and 10 pancreatic cancer sera, it was observed that out of 62 spots that were arrayed, 10 spots showed stronger signals when arrayed after digestion. Out of these 10 spots, 5 showed a response that was different between normal sera and diseased sera (chronic pancreatitis and pancreatic cancer). In this study, a response unique to chronic pancreatitis and pancreatic cancer was observed. This response could be indicative of inflammation rather than cancer since it was seen in both the chonic pancreatitis and pancreatic cancer sera. Regardless, it is very likely that a similar trend will be seen if all pH lanes from the first dimension are interrogated resulting in a larger number of potential proteins that can be validated for diagnostic capabilities. In addition, the results from this study are used as a proof of concept for the digested array strategy, but further work with larger sample pools will be needed before any biologically relevant conclusions can be drawn.
Acknowledgment
This work was supported in part by the National Cancer Institute under grant R01CA106402 (D.M.L.), the National Institutes of Health under grant R01GM49500 (D.M.L.) Support was also generously provided by Eprogen, Inc.
References
- (1).Spisak S, Tulassay Z, Molnar B, Guttman A. Electrophoresis. 2007;28:4261–4273. doi: 10.1002/elps.200700539. [DOI] [PubMed] [Google Scholar]
- (2).Cekaite L, Hovig E, Sioud M. Methods Mol. Biol. 2007;360:335–348. doi: 10.1385/1-59745-165-7:335. [DOI] [PubMed] [Google Scholar]
- (3).Hudson ME, Pozdnyakova I, Haines K, Mor G, Snyder M. Proc. Natl. Acad. Sci. U.S.A. 2007;104:17494–17499. doi: 10.1073/pnas.0708572104. [DOI] [PMC free article] [PubMed] [Google Scholar]
- (4).Miller JC, Zhou H, Kwekel J, Cavallo R, Burke J, Butler EB, Teh BS, Haab BB. Proteomics. 2003;3:56–63. doi: 10.1002/pmic.200390009. [DOI] [PubMed] [Google Scholar]
- (5).Orchekowski R, Hamelinck D, Li L, Gliwa E, vanBrocklin M, Marrero JA, Vande Woude GF, Feng Z, Brand R, Haab BB. Cancer Res. 2005;65:11193–11202. doi: 10.1158/0008-5472.CAN-05-1436. [DOI] [PubMed] [Google Scholar]
- (6).Shafer MW, Mangold L, Partin AW, Haab BB. Prostate. 2007;67:255–267. doi: 10.1002/pros.20514. [DOI] [PubMed] [Google Scholar]
- (7).Haab BB, Zhou H. Methods Mol. Biol. 2004;264:33–45. doi: 10.1385/1-59259-759-9:033. [DOI] [PubMed] [Google Scholar]
- (8).Haab BB. Mol. Cell. Proteomics. 2005;4:377–383. doi: 10.1074/mcp.M500010-MCP200. [DOI] [PubMed] [Google Scholar]
- (9).Haab BB. Curr. Opin. Biotechnol. 2006;17:415–421. doi: 10.1016/j.copbio.2006.06.013. [DOI] [PubMed] [Google Scholar]
- (10).Chatterjee M, Draghici S, Tainsky MA. Curr. Opin. Drug Discovery Dev. 2006;9:380–385. [PubMed] [Google Scholar]
- (11).Abu-Shakra M, Buskila D, Ehrenfeld M, Conrad K, Shoenfeld Y. Ann. Rheum. Dis. 2001;60:433–441. doi: 10.1136/ard.60.5.433. [DOI] [PMC free article] [PubMed] [Google Scholar]
- (12).Stockert E, Jager E, Chen YT, Scanlan MJ, Gout I, Karbach J, Arand M, Knuth A, Old LJ. J. Exp. Med. 1998;187:1349–1354. doi: 10.1084/jem.187.8.1349. [DOI] [PMC free article] [PubMed] [Google Scholar]
- (13).Caron M, Choquet-Kastylevsky G, Joubert-Caron R. Mol. Cell. Proteomics. 2007;6:1115–1122. doi: 10.1074/mcp.R600016-MCP200. [DOI] [PubMed] [Google Scholar]
- (14).Bizzaro N. Autoimmun. Rev. 2007;6:325–333. doi: 10.1016/j.autrev.2007.01.006. [DOI] [PubMed] [Google Scholar]
- (15).Lin HS, Talwar HS, Tarca AL, Ionan A, Chatterjee M, Ye B, Wojciechowski J, Mohapatra S, Basson MD, Yoo GH, Peshek B, Lonardo F, Pan CJ, Folbe AJ, Draghici S, Abrams J, Tainsky MA. Cancer Epidemiol. Biomarkers Prev. 2007;16:2396–2405. doi: 10.1158/1055-9965.EPI-07-0318. [DOI] [PMC free article] [PubMed] [Google Scholar]
- (16).Gao WM, Kuick R, Orchekowski RP, Misek DE, Qiu J, Greenberg AK, Rom WN, Brenner DE, Omenn GS, Haab BB, Hanash SM. BMC Cancer. 2005;5:110. doi: 10.1186/1471-2407-5-110. [DOI] [PMC free article] [PubMed] [Google Scholar]
- (17).Chen G, Wang X, Yu J, Varambally S, Thomas DG, Lin MY, Vishnu P, Wang Z, Wang R, Fielhauer J, Ghosh D, Giordano TJ, Giacherio D, Chang AC, Orringer MB, El-Hefnawy T, Bigbee WL, Beer DG, Chinnaiyan AM. Cancer Res. 2007;67:3461–3467. doi: 10.1158/0008-5472.CAN-06-4475. [DOI] [PubMed] [Google Scholar]
- (18).Cekaite L, Haug O, Myklebost O, Aldrin M, Ostenstad B, Holden M, Frigessi A, Hovig E, Sioud M. Proteomics. 2004;4:2572–2582. doi: 10.1002/pmic.200300768. [DOI] [PubMed] [Google Scholar]
- (19).Yan F, Sreekumar A, Laxman B, Chinnaiyan AM, Lubman DM, Barder TJ. Proteomics. 2003;3:1228–1235. doi: 10.1002/pmic.200300443. [DOI] [PubMed] [Google Scholar]
- (20).Taylor BS, Pal M, Yu J, Laxman B, Sundaram SK, Zhao R, Menon A, Wei JT, Nesvizhskii AI, Ghosh D, Omenn GS, Lubman DM, Chinnaiyan AM, Sreekumar A. Mol. Cell. Proteomics. 2007;7:600–611. doi: 10.1074/mcp.M700263-MCP200. [DOI] [PubMed] [Google Scholar]
- (21).Chong BE, Yan F, Lubman DM, Miller FR. Rapid Commun. Mass Spectrom. 2001;15:291–296. doi: 10.1002/rcm.227. [DOI] [PubMed] [Google Scholar]
- (22).Wang Y, Wu R, Cho KR, Shedden KA, Barder TJ, Lubman DM. Mol. Cell. Proteomics. 2006;5:43–52. doi: 10.1074/mcp.T500023-MCP200. [DOI] [PubMed] [Google Scholar]
- (23).Wen Q, Ma L, Luo W, Zhou MQ, He D, Lin Y, Wu ZQ, He XW, Wang JF, Wang XN. Biotechnol. Appl. Biochem. 2008;50:41–48. doi: 10.1042/BA20070125. [DOI] [PubMed] [Google Scholar]
- (24).Wang C, Wang L, Geng X. Biotechnol. Prog. 2008;24:209–213. doi: 10.1021/bp070263y. [DOI] [PubMed] [Google Scholar]
- (25).Jungbauer A, Kaar W, Schlegl R. Curr. Opin. Biotechnol. 2004;15:487–494. doi: 10.1016/j.copbio.2004.08.009. [DOI] [PubMed] [Google Scholar]
- (26).Jungbauer A, Kaar W. J. Biotechnol. 2007;128:587–596. doi: 10.1016/j.jbiotec.2006.12.004. [DOI] [PubMed] [Google Scholar]
- (27).Ito M, Shichijo S, Ochi M, Harashima N, Saito N, Itoh K. Cancer Res. 2001;61:2038–2046. [PubMed] [Google Scholar]