

Abstract
The N-terminal region of α-spectrin is responsible for its association with β-spectrin in a heterodimer to form functional tetramers. Non-erythroid alpha spectrin (αII-spectrin) has significantly higher association affinity with β-spectrin than the homologous erythroid alpha spectrin (αI-spectrin). We have previously determined the solution structure of the N-terminal region of αI-spectrin by NMR methods, but currently no structural information is available for αII-spectrin. We have now used cysteine scanning, spin labeling EPR and isothermal titration calorimetry (ITC) methods to study the tetramerization region of αII-spectrin. EPR data clearly showed that, in αII-spectrin, the first 9 N-terminal residues were unstructured, followed by an irregular helix (Helix C′), frayed at the N-terminal end, but rigid at the C-terminal end, which merges into the putative triple helical structural domain. The region corresponding to the important unstructured junction region linking Helix C′ to the first structural domain in αI-spectrin was clearly structured. Based on the published model for aligning Helices A′, B′ and C′, important interactions amongst residues in Helix C′ of αI/II-spectrin and Helices A′ and B′ of βI/II-spectrin are identified, suggesting similar coiled coil helical bundling for spectrin I and II in forming tetramers. The differences in affinities are likely due to the differences in the conformation of the junction regions. Equilibrium dissociation constants of spin labeled αII and βI complexes from ITC measurements indicate that residues 15, 19, 37 and 40 are functionally important residues in αII-spectrin. Interestingly, all four corresponding homologous residues in αI-spectrin (residues 24, 28, 46 and 49) have been reported to be clinically significant residues involved in hematological diseases.
Spectrin, consisting of α-spectrin and β-spectrin subunits, is a major component of the cytoskeleton in cells. Two α-spectrin isoforms (I and II) and five β-spectrin isoforms (I, II, III, IV and H) have been identified in humans (1). The C-terminal end of α-spectrin and the N-terminal end of β-spectrin associate to form an αβ heterodimer (2). Two heterodimers associate at the other ends of the dimers, the N-terminal end of α-spectrin of one dimer and the C-terminal end of β-spectrin of the other dimer, to form a functional tetramer (3).
Erythroid spectrin (spectrin I) was first identified in red blood cells and is responsible for cell flexibility and deformability (4). Mutations that impair the formation of erythroid tetramers lead to hematological diseases (5, 6). Non-erythroid spectrin is found in brain cells as well as other cells (1). Non-erythroid α-spectrin (αII-spectrin) associates with non-erythroid β-spectrin (βII-spectrin) to form tetramers in a manner similar to erythroid spectrin, except with higher affinity (7). αII-spectrin also associates with erythroid β-spectrin (βI-spectrin) with high affinity, as well as with functionally important proteins in the nucleus (8) and in brain (9). Measurements of the breakdown products of αII-spectrin have been suggested to be clinically relevant as a quantitative marker to measure traumatic brain injury (10 – 12). αII-spectrin has recently been reported to be essential for stabilizing nascent sodium-channel clusters (13), assembling the mature node of Ranvier (13), and regulating endothelial cell-cell contacts (14). The tetramer formation of αII- and βII-spectrin is also essential in the regulatory step for neuritogenesis (15).
Tetramerization is clearly important for spectrin function, and yet currently very little structural information is available for understanding the detailed mechanism of tetramerization as well as the differences in affinities between erythroid and non-erythroid α- and β-spectrin association. We have previously obtained a solution structure for the first 156 amino acid residues at the N-terminal region of human αI-spectrin (Fig 1A;16, 17). The solution structure shows that the first 20 residues are unstructured, followed by α-helix consisting of residues 21 – 45. The most unexpected and interesting finding is that this helix (Helix C′, often referred to as the N-terminal partial domain) is followed by a 7-residue (residues 46 – 52) unstructured junction region. Residue 53 is the first residue in Helix A1. Helix A1, Helix B1 and Helix C1 bundle to form the first structural domain of αI-spectrin. The triple helical structural domain is similar to other (Drosophila and chicken brain) spectrin structural domains (18 – 22), although the helices and loops connecting the helices differ in lengths (16). It is interesting to note that conformations of other loop/junction/linker regions between spectrin structural domains have been speculated to be important in spectrin flexibility (21) and domain stability or folding/unfolding (23 – 27). The importance of the particular unstructured junction region between Helix C′ and the first structural domain in αI-spectrin, as revealed by NMR studies, has recently been recognized for its clinical significance (28, 29).
Figure 1.

NMR solution structure of the first 156 residues of erythroid αI-spectrin (ref. 17) (A) and the proposed structure for the first 149 residues of αII-spectrin (ref. 30) (B). The NMR structure identifies the first helix (Helix C′) consisting of residues 21 – 45 and the first structural domain of triple helical bundle (Helices A1, B1 and C1) consisting of residues 53 – 154. The junction region between Helix C′ and Helix A1 is unstructured and consists of residues 46 – 52. Through sequence homology, the corresponding residues for αII are also labeled, with residues 37 – 43 corresponding to the unstructured junction region in αI.
Based on this NMR structure, we refer to the entire region prior to the first triple helical bundle, and not just Helix C′, as the “tetramerization region” since its interaction with the β-spectrin C-terminal region is responsible for the formation of spectrin tetramers. For αI-spectrin, the tetramerization region consists of residues 1 – 52. The corresponding tetramerization region of αII-spectrin, through sequence alignment, is thus residues 1 – 43 (Fig 1B); these two sequences exhibit 79 % similarity and 72 % identity (30). Yet, the association of αII-spectrin with β-spectrin exhibits an affinity that differs from that of αI-spectrin with β-spectrin by approximately two orders of magnitude. Our isothermal titration calorimetric (ITC) studies of an αII-spectrin model protein (residues 1 – 149) show a Kd value of 0.012 μM with a C-terminal βI-spectrin model protein (βI, consisting of residues 1898 – 2083 of βI), and a Kd value of 1.1 μM for the corresponding αI-spectrin protein (residues 1 – 156) with the same βI-spectrin modelprotein (30). Kinetic studies of an immobilized GST fusion protein of αII-spectrin (residues 1 –145, a system similar but not identical to our system) associating with His-tag βI-spectrin model protein (residues 1898 – 2137) show a kon of 2,900 M−1 S−1 and koff of 8 × 10⁻⁴ S−1 (Kd ~ 0.3 μM) whereas similar measurements for αI-spectrin protein (residues 1 – 154) with the same βI-spectrin model protein show a kon of 59 M−1 S−1 and koff of 5 × 10⁻⁵ S−1 (Kd ~ 0.9 μM) (7).
Small angle X-ray scattering studies show that the recombinant αII-spectrin protein (149 residues) exhibits a more extended conformation than the αI-spectrin protein (156 residues) (30). We interpret this difference in molecular shape to be the consequence of a more rigid junction region in the αII protein. This suggestion is supported by molecular dynamics simulations (31) and by energetic considerations (32). However, high resolution structural information is not yet available for this region of αII-spectrin.
We used site-directed spin labeling methods to label 39 N-terminal residues (residues 9 – 47), one at a time, of a recombinant protein that consists of the first 359 residues (the tetramerization region plus three structural domains) of αII-spectrin, and used electron paramagnetic resonance (EPR) techniques to monitor the motion and accessibility of the attached labels to obtain structural and dynamic information for the scanned region. Site-directed spin labeling EPR has been shown to be a powerful method to monitor the dynamic and structural features of protein systems at a residue level, especially when X-ray and NMR data are not available (33). The first 359 residues in αII-spectrin are homologous to the first 368 residues in αI-spectrin, which have been studied extensively (34 – 37). In this study, we found that the N-terminal Helix C′ of αII-spectrin is an irregular helix. This helix was frayed at the N-terminal end, and rigid with restricted motions at the C-terminal end, with the helix merging into the putative triple helical structural domain. The region corresponding to the unstructured junction region in αI-spectrin was clearly not unstructured in αII-spectrin. It was interesting to note that there was a phase shift in the mobility periodicity, suggesting the helix to overwind around residues 18 and 19, and underwind around residues 37 and 38. We also identified residues 15, 19, 37 and 40 as functionally important residues in αII-spectrin.
MATERIALS AND METHODS
Spectrin recombinant proteins
A DNA fragment coding for the first 359 residues of αII-spectrin was previously constructed (38) in a yeast MatchMaker vector pBD-αII with BamHI and EcoRI restriction sites matching those of the E. coli expression vector pGEX-2T. The spectrin insert was simply cut and ligated into pGEX-2T vector for protein expression to give αII-spectrin consisting of residues 1–359 (abbreviated as αII). Two native cysteine residues at positions 158 and 315 were replaced with alanine residues by site-directed mutagenesis methods following standard procedures (36) to give a cysteine-less αII, and used as the parent protein for single cysteine replacement. A total of 39 plasmids, each with a single cysteine residue, scanning positions 9 to 47 (Fig 1B) were prepared. DNA sequences were analyzed at the DNA Sequencing Facility in the Research Resources Center at the University of Illinois at Chicago (RRC). Confirmed plasmids were transformed into BL21-CodonPlus(DE3)-RIPL competent cells (Stratagene, La Jolla, CA) for protein expression. Proteins of the αII family, including wild type (WT), cysteine-less and single cysteine proteins (αIIΔ), were expressed and purified following standard procedures (36), except that 2 mM β-mercaptoethanol was included in thrombin cleavage buffer for αIIΔ proteins to prevent disulfide bond formation and maintain the efficiency of thrombin cleavage. A model protein of erythroid C-terminal βI-spectrin fragment consisting of residues 1898 – 2083 was prepared as described previously (35).
Molecular masses of all proteins were determined by RRC with high resolution LTQ-FT mass spectrometry methods; proteins with masses that deviated from expected values by 3 Da or more were rejected. The purity of protein from each preparation was determined by 16 % SDS-PAGE. Each protein was further analyzed by circular dichroism methods at 20 °C to provide helical contents (35). Concentrations of proteins in 5 mM phosphate with 150 mM NaCl at pH 7.4 (PBS7.4) were determined from spectroscopic absorbance values at 280 nm, using the extinction coefficients of 38,960 cm−1 M−1 for all αIIΔ proteins except for Y26C and Y44C (37,470 cm−1M−1) and 31,130 cm−1 M−1 for βI (with extinction coefficients calculated from sequence, including two extra GS residues remaining after thrombin cleavage).
The αIIΔ proteins were spin labeled with the well studied spin label (1-oxy-2,2,5,5,-tetramethyl-3-pyrrolinyl-3-methyl)-methanethiosulfonate (Toronto Research Chemicals, Toronto, ON) following standard procedures (36). Each spin labeled protein was designated by its native amino acid residue, its position in sequence and “R1”, such as L9R1 or F46R1, following the published notation of R1 as the labeled cysteine residue (39). As a group, they were referred to as αIIΔR1. To determine non-specific background labeling, the αII cysteine-less protein was labeled in parallel.
The hydrodynamic radii (Rh) of a few αIIΔR1 samples (50 μM, 100 μL in PBS7.4) were measured by dynamic light scattering methods, as before (32), using a PD2000 system (Precision Detectors Inc, Franklin, MA) with an HPLC YMC-Pack Diol 200 size-exclusion column (Waters Corporation) and a flow rate of 0.7 – 0.8 mL/min.
Isothermal titration calorimetry (ITC)
The association/dissociation equilibrium constant of each of the thirty nine αIIΔR1 proteins as well as WT and cysteine-less proteins with βI were determined from ITC measurements at 25 °C with a VP-ITC unit (MicroCal, LLC, Northampon, MA), following standard procedures (32). Each αIIΔR1 protein sample was co-dialyzed with βI (3 ~ 8 μM). The αIIΔR1 proteins were the titrant proteins with a concentration of 50 ~ 100 μM except I15R1, R19R1 and L40R1, which were at 120 ~ 200 μM) Titration isotherms were analyzed using the MicroCal software to obtain the association constant (Ka) assuming a single binding site model.
EPR Studies
αIIΔR1 samples (~100 μM) in PBS7.4 were used for EPR studies. Since most published studies using similar approaches were done in the presence of 30 % (w/w) sucrose (39), we also included 30 % sucrose in our samples, for ease of comparing side-chain mobility with published results. Spectra at 20 °C were acquired with a Bruker (Bruker BioSpin Corp., Billerica, MA) EMX spectrometer at 9.45 GHz equipped with an HS cavity and a variable temperature unit. Incident microwave power was set at 2 mW, modulation amplitude at 1 G, time constant 20.48 msec, conversion time 40.96 msec and scan width 100 Gauss. Spin label concentrations of labeled proteins were determined by double integration of EPR spectra using the WinEPR software from Bruker. For cysteine-less protein samples, we observed weak EPR signals, and found about 0.17 spin label per protein molecule (see Results section). This signal was subtracted from each EPR spectrum of αIIΔR1 proteins to give an experimental spectrum for that protein.
Accessibility experiments were done with a Varian E-109E spectrometer at 9.35 GHz, equipped with a loop-gap resonator (Molecular Specialties Inc., Milwaukee, WI) at room temperature (about 22 °C). Spin labeled protein samples (about 100 μM) in PBS7.4, with and without 5 mM nickel ethylenediamine-di(o-hydroxyphenyl acetic acid) (Ni-EDDA), were placed in gas permeable TPX sample tubes (Molecular Specialties Inc., Milwaukee, WI). Ni-EDDA was synthesized as described previously (40). Nitrogen gas was continuously purged around the sample tube during each measurement. The peak-to-peak amplitudes of the central line were monitored with a microwave power of 2 mW, and measurements, as a function of microwave power, began only after the complete removal of oxygen gas from the sample, as indicated by no further decrease in signal amplitude. The amplitude values at microwave power level of 0.5 to 40 mW were analyzed following established methods (40) to give accessibility values (with 5 mM Ni-EDDA) for all 39 αIIΔR1 protein samples.
Spectral Analysis, Spectral Simulation and Spectral Fitting
A combination of spectral subtraction, spectral fit and spectral simulation were used to analyze the experimental spectra.
For simulation, we used the published program “NLSL” with the “microscopic order; macrosocopic disorder (MOMD)” model to describe the protein-bound nitroxide spin label dynamics in a magnetic field (41–46). The MOMD model has been frequently used to analyze X-band EPR spectra of proteins (43, 44), although it is more appropriate for 250 GHz spectra than for 9 GHz spectra (45). The program requires the input of multiple parameters (including the values of the spin quantum number of the interacting nuclear spin, magnetic field strength, magnetic tensor, etc.), and allows a maximum of 10 parameters (rotational correlation time, τc; motional asymmetry, N; ordering, c20, etc.) to vary until the simulated spectrum fits the targeted experimental spectrum. A detailed analysis of the interplay between the fit obtained and the motional parameters by manually varying these parameters shows that the program simulated many of the experimental spectra well, although some of the errors are quite large (for example, for diffusional rates, errors of 11 % for Rxx, 23 % for Ryy and 11 % for Rzz) (46). We used published magnetic tensor values (gxx = 2.0076, gyy = 2.0050, gzz = 2.0023; Axx = 6.2, Ayy = 5.9, Azz = 37 from ref 46 for all but strongly immobilized component, discussed below), which were improved values over those used in our earlier publication (47), and varied the four system-specific parameters (gib0 for inhomogeneous line broadening, rbar for rotational correlation time with 1/(6 × 10rbar) = τc, N for motional asymmetry and c20 for ordering potential) (46).
For experimental spectra fitted with multiple spectral components, linear regression routine (Minitab, State College, PA) was used to determine the relative percentage of each component to best fit the experimental spectra.
RESULTS
Protein Characterization
The SDS gel electrophoresis data showed that all αII and βI proteins were 85 to 96 % pure, with an average value of 90 ± 4 % (n = 42). Most of the molecular masses of proteins used in this study were within 1 Da of the expected values, and none differed more than 2.5 Da. The expected mass of the WT protein was 42,242.5 Da. Three randomly selected spin labeled proteins (at positions 15, 23 and 26) were also analyzed, and their masses were also as expected.
A representative CD spectrum of each αIIΔR1 as well as the cysteine-less protein was shown in Fig 2. The CD data showed that the helical contents for αII proteins (WT, cysteine-less and αIIΔR1 proteins) were around 75 % (Fig 2).
Figure 2.

Circular dichcroism (CD) spectra for all αII proteins (wild type, cysteine-less and 39 αIIΔR1). The αII cysteine-less protein was shown as a thick black line; all other spectra were shown in gray. Spectra were recorded at 20 °C with sample ~ 10 μM in PBS7.4. Raw ellipticity was normalized by protein concentration to give molar ellipticity. Helical content was calculated from molar ellipticity at 222 nm using 36, 000 deg cm2 dmol−1 as 100 %. The helical content of each αIIΔR1 is shown in the inset.
The average hydrodynamic radius from dynamic light scattering measurements of WT, L9R1 and R28R1 was 3.9 ± 0.06 nm (n = 3), which was larger than that of BSA (3.6 nm, a larger “spherical” protein of 67 kDa), indicating αIIΔR1 proteins (about 42 kDa) were highly asymmetric.
For spin labeled proteins, we found non-specific (background) labeling, similar to those observed in αI-spectrin model systems (36, 51). The spin label-to-protein ratio for cysteine-less αII protein was 0.17 ± 0.04 (n = 3). This background labeling seemed high, although it was similar to that of αI-spectrin (36). About 5 % of this signal came from spin labeled glutathione trapped in the protein (51). About 10 % signal remained after the samples were treated with urea (6 M), following by dialysis and column chromatography. The background signals, both in amounts and in spectral features, were similar for all αIIΔR1 samples.
The average value for spin label-to-protein ratios for all 39 αIIΔR1 samples, after subtracting background label signals, was 0.8 ± 0.2 (n = 39).
Association of αIIΔR1 proteins with βI
ITC measurements showed that the Kd values of WT and cysteine-less αII proteins with β I were about 12 ± 2 nM, similar to the published value of a smaller αII-spectrin protein consisting of the first 147 residues (30). The Kd values for most of the αIIΔR1 samples ranged from 6 – 50 nM (Fig 3C). For example, for L9R1 (Fig 3A) the Kd value was 28 nM. The values for F29R1, L32R1, K39R1, S43R1 and Y44R1 were slightly higher, ranging from 50 – 80 nM (Fig 3C). However, four proteins exhibited much weaker affinity than the rest, with Kd values of 237 nM for I15R1, 1.14 μM for R19R1, 177 nM for R37R1 and 729 nM for L40R1 (Fig 3B). The replacement of arginine with R1 at position 19 introduced the largest perturbation (about a 100-fold reduction in Kd), followed by lysine at position 40 (60-fold reduction), isoleucine at position 15 (20-fold reduction) and arginine at position 37 (15-fold reduction) (Fig 3D). However, in general, the effects of spin labeled cysteine scanning of 39 residues at the N-terminal region of αII introduced little perturbation with respect to its functional properties, and thus presumably little structural perturbation, except for residues at positions 15, 19, 37 and 40.
Figure 3.

Representative ITC titration curves and analyzed data for αIIΔR1 samples with typical affinities for association with βI, such as that of L9R1 (at a concentration of 85 μM; with βI at 5.5μM in PBS7.4) with a Kd value of 28 nM (A). The titration curve and analyzed data of L40R1 (at 126 μM; with βI at 7.8 μM) represent those with relatively low association affinities with βI, with a Kd value of 730 nM at 25 °C (B). The Kd values for αIIΔR1 proteins scanning from position 9 to position 47 (C) show that the affinity in association with βI for most of the proteins are similar to each other and to that of the WT parent protein (12 nM), except for I15R1 (237 nM), R19R1 (1.14 μM), R37R1 (177 nM) and L40R1 (730 nM). The values for the proteins with R1 at positions 29, 32, 39, 43 and 44 were slightly higher than that of WT, ranging from 50 – 80 nM. The Kd values of αIIΔR1 normalized by the Kd value of WT, Kd/Kd (WT), (D) shows that replacing the native residues with R1 caused the largest perturbation at position 19, followed by position 40 and then positions 15 and 37.
EPR Studies
The experimental EPR spectra, with the background signal subtracted, of all αIIΔR1 proteins (scanning from position 9 to position 47) showed both similarities and variations (Fig 4). Initial analysis of these spectra for line width, second moment and hyperfine separation, etc. did not reveal any meaningful structural information.
Figure 4.

EPR spectra of αIIΔR1 family scanning residues 9 – 47 (thin solid line) at 20 °C, with background signals removed. All samples were in PBS7.4 with 30 % (w/w) sucrose. The protein concentrations were generally about 100 μM, and the spin label to protein ratios were about 0.8. A total of 64 scans were acquired for each spectrum. The corresponding simulated spectra (thick dotted lines) were also plotted. See Figure 5 for fitting and simulation details.
Close examination of the spectra indicated that most spectra consisted of multiple motional components. Various spectral simulation and spectral fitting analyses led us to conclude that most of these spectra consisted of three components (Components I, II and III), each component with specific spectral characters (for example, line-width and hyperfine separation) substantially different from the other two.
The spectrum of L9R1 appeared to be of a single component (Fig 4) and was easily simulated with a single set of parameters (rbar =8.09 or τc = 1.4 ns; gib0 = 0.02; N = 0.80 and c20 = 0.06 or S20 = 0.01) to give a spectrum (Fig 5A, top spectrum) that fit the experimental spectrum very well (Fig 4). Calculating τc values with spectral amplitudes of the three signal peaks (49), a rotational correlation time of 1.3 ns was obtained, which agreed well with the value obtained from the simulation. This spectrum represented a relatively fast anisotropic motion and was presumably from the free χ4/χ5 rotation of the spin label moiety (see 46 for the χ4 and χ5 definitions) without any structural constraints, and was similar, for example, to the fast component (1.2 – 1.7 ns) of spectra from the cellular retinol-binding protein (52).
Figure 5.

Simulated spectra of L9R1 (Component I) (top spectrum in A) and of Component III (bottom spectrum in A). L9R1 spectrum (29 %) and Component III (11 %) were subtracted from the experimental spectrum of Y26R1 to give the Y26R1 difference spectrum, which was used to simulate Component II of Y26R1 (middle spectrum in A). The sum of these three components, in their proper proportion (B), gave the fitted spectrum (dash line) of Y26R1 (C), which matched the experimental spectrum (thin solid line) well. (D) The sum of two simulated spectra generated by the simulation program directly, with a τc = 1.2 ns for one component (36 %) and a τc = 6.3 ns for another component (dash line) (64 %). This fit was not used since the spectrum did not fit the experimental spectrum well (thin solid line), but is shown to indicate the uniqueness of the three-component fit. Components I and III were the same for all αIIΔR1 spectra, whereas Component II varies as a function of residue position. Component II for each protein was obtained and used for fitting to give best fit of experimental spectra in Fig 2. The parameters used in simulation were as follow: gib0 = 0.02, N = 0.80, rbar = 8.08 and c20 = 0.06 for L9R1 (Component I); gib0 = 3.79, N = 0.58, rbar = 6.50 and c20 = 5.50 for Component III, and gib0 = 0.02, N = 0.80, rbar = 7.69 and c20 = 0.01 for Component II of Y26R1.
This component was relatively easy to identify in multi-component spectra, with both its narrow hyperfine separation (2Azz = 30.9 G) and its narrow line width (2.2 G for the low-field peak). Most αIIΔR1 spectra, except spectra 39 – 46, clearly consisted of this component (Fig 4). We referred to this component as Component I. We subtracted the L9R1 spectrum from spectra 10 – 47, guided by its distinct sharp line and narrow hyperfine separation, until the sharp signals were removed. Under-subtraction showed spectra with reduced sharp signals, and over-subtraction showed distorted spectra. Subtractions for spectra 39 – 46 resulted in spectral distortion indicating that these spectra contained only insignificant amounts of Component I.
Spectra 39 – 46, particularly spectrum 46, showed substantial amounts of a strongly immobilized component, with a large hyperfine separation (2Azz = 67.6 G). We simulated the spectrum of Y46R1 with two components and obtained an excellent fit (Fig 4). For the slower component, we used the following magnetic tensor values gxx = 2.0077, gyy = 2.0059, gzz = 2.0022; Axx = 5.5., Ayy = 5.6, Azz = 35.5 (48), and we fixed rbar = 6.50 or τc = 53 ns; c20 = 5.50 or S20 = 0.80, and varied only gib0 and N. The values of gib0 = 3.79 and N = 0.58 gave the best fitted spectrum. The parameters for the faster component were gib0 = 0.01; rbar = 7.63 or τc = 3.91 ns; c20 = 1.14 or S20 = 0.32; N = 0.39.
We fixed the slower component τc to 53 ns since the calculated rotational correlation time was 53 ns using an Azz value of 33.8 G from the F46R1 spectrum and an empirical formula (48). It is also interesting to note that the rotational correlation time calculated for our protein was 58 ns for rotation about the major axis assuming it to be a prolate ellipsoid (32) in 30 % sucrose, with a Rh value of 3.9 nm from dynamic light scattering (see above, Protein Characterization). This slower component in F46R1, referred to as Component III (Fig 5A), was thus probably from the labeled side-chain that was strongly immobilized, with the rotational motion of the protein as the observed motion for the label. It should also be noted that both the experimental detection and the NLSL simulation was not as sensitive to motions slower than 20 ns and therefore the simulated/experimental spectrum for τc of 20 ns does not differ much from that of 53 or 58 ns (50).
Each experimental spectrum of αIIΔR1, with the sharp signals (L9R1 spectrum) already removed, had Component III subtracted to give a “difference spectrum”. The amounts of Component III removed from spectra were determined when the immobilized signal (Azz = 33.8 G) was removed without distorting the spectra. The difference spectrum of each was then simulated. The parameters gib0 = 0.02; N = 0.80 as used for L9R1 were used, and rbar and c20 were varied to give a simulated spectrum. We also varied all four parameters (gib0, N, rbar and c20) for best fit and obtained τc values very similar to those obtained by holding gib0 and N identical to those obtained by varying only rbar and c20. This component was called Component II.
Fig 5 shows a typical operation. The spectrum of L9R1 (Component I, 29 %) and Component III (11 %) were subtracted from the experimental spectrum of Y26R1 to give a difference spectrum of Y26R1, which was used to simulate Component II of Y26R1 (Fig 5A middle spectrum). The sum of the three components, in their proper proportions (Fig 5B), then gave the fitted spectrum of Y26R1 (Fig 5C). The fitted spectra for all proteins agreed well with their corresponding experimental spectra (Fig 4).
Since a visual inspection of Y26R1 spectrum suggested at least two components. We also used the program to simulate with two components, and obtained one component with τc = 1.2 ns, 36 % and another with 6.3 ns, 64 %. However, this “best fit” spectrum (Fig 5D) did not fit the experimental spectrum as well as the three component fit (Fig 5C), indicating that the three-component fit was necessary and unique.
The relative amounts (percentages) of each component that best fit the experimental spectra was obtained by linear regression routine and showed different amounts of each component for each protein (Fig 6). The amounts of Component III for the proteins were generally less than 20 %, except for 41R1 (26 %), 46R1 (40 %) and 47R1 (41 %) (Fig 6). The amounts of Component I decreased from 100 % at position 9 to about zero at positions 39 – 46. Despite our best effort to attend to details in our spectral analysis, these values all carried certain uncertainties. Thus, only the general patterns of these values were considered. As shown in Fig 6, a general “decreasing” trend was observed for the amounts of Component I as we moved down the sequence, whereas the amounts of Component II exhibited a general “increasing” trend, in going from positions 9 – 40.
Figure 6.

Relative amounts (%) of Component I (○) (top), Component II (■) (middle) and Component III (Δ) (bottom) were used to give best fit spectra for αIIΔR1 proteins. Component I and Component III for all αIIΔR1 proteins were the same as those shown in Fig 5A. Component II spectrum for each αIIΔR1 protein was individualized. See text for details. The amounts of Component III were generally less than 20 % for all proteins, except for E41R1, Y46R1 and R47R1. The amounts of Component I exhibited a general “decreasing” trend, whereas the amounts of Component II exhibited a general “increasing” trend, from positions 9 – 47. There were no Components I for positions 39 – 46. The uncertainties were 9 % for Component I, 8 % for Component II and 4 % for Component III.
The τc values of Component II (τcII) ranged from 2 to 4.5 ns for the αIIΔR1 proteins with labels at positions 10 – 47 (no Component II for L9R1) (Fig 6), and were residue-position specific, suggesting that the Component II motions were those of the backbone motions of the scanned residues. Similar τc values have been reported for the backbone motions of noninteracting residues on the helix surface of GCN4-58 bZip (44). The τcII values exhibited a regular periodic pattern dependence on residue positions (Fig 7), with the values for residues 38 – 45 less regular than the rest. A nonlinear least square fit of all data to a sine wave with a periodicity of 3.5 showed a good fit between the data and the sine wave (sine wave 1) except for those in the middle region. When we fit just the data of the middle region (positions 19 – 37), a new sine wave with a different phase (sine wave 2) resulted. Interestingly, the sine wave 1 (all positions) was shifted relative to the sine wave 2 (positions 19 – 37), by one residue toward the N-terminal end, or one residue deletion (Fig 7). The τcII values for residues 46 and 47 did not fit either of the two sine waves.
Figure 7.

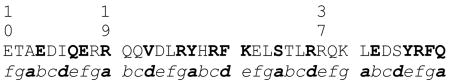
Rotational correlation time (τc) used to simulate Component II spectrum of each αIIΔR1 protein, except that at position 9, which had no Component II. The values exhibited a periodicity in labeled residue positions in αII. A nonlinear least square sine wave fit with a periodicity of 3.5 (y = sin (x−A)/3.5 * 2π, where A is the “phase”), using all data points (lower dotted line, sine wave 1), matched the data at positions 10 – 18 and 38 – 45. However, for the data of positions 19 – 37, the lower dotted line did not fit well. A separately fitted sine wave, using just the data set of positions 19 – 37 gave the upper dotted line (sine wave 2). The two dotted lines were shifted by 102°, or the periodicity of positions 20 – 37 was shifted by one residue toward the N-terminal end (one residue deletion) when compared with the lower dotted line. Also shown (top x-axis) are the sequence of residues 9 – 47 and the corresponding heptad assignment.
Accessibility values with 5 mM Ni-EDDA varied from 0.35 to 0.55 for all positions except for position 46, which was 0.23. Values larger than 0.25 are considered to be from residues on the surface of a helix, whereas those smaller than 0.25 are from those buried by tertiary contacts (53).
Discussion
Conformation of the N-Terminus of Human αII-Spectrin
The sequence for the scanned region (residues 9 – 47) in αII-spectrin is 85 % similar and 69 % identical to that in αI-spectrin (residues 18 – 56, using italic font for αI-spectrin residue numbers to reduce potential confusion) (Fig 1). The alignment also shows that residues corresponding to residues 2 – 10 in αI-spectrin are missing in αII-spectrin (38). Based on sequence alignment with αI-spectrin and the NMR structure of the first 156 residues of αI-spectrin (17), the putative structure of residues 1 – 47 in αII consists of an unstructured region (residues 1 – 11), Helix C′ (residues 12 – 36), the unstructured junction region (residues 37 – 43), and a part of Helix A1 of the first structural domain (residues 44 – 47). However, our current studies show that the conformation of αII, at least of the scanned region, differs from this predicted conformation, in spite of high sequence homology with αI-spectrin.
The oscillating periodicity of 3.5 for τcII (of Component II) as a function of residue position suggested a helical conformation, which we discuss below. First, we discuss the motional components that we observed for residues 9 – 47. Component I was the fast, unconstrained motional component (about 1.4 ns) and thus was associated with unstructured conformation. Component II was from the labeled side chain being immobilized due to restricted χ4/χ5 rotation and reflecting backbone motions, or backbone conformations. Component III was strongly immobilized (τc = 53 ns, or at least larger than 20 ns) with little χ4/χ5 rotation and reflecting an overall protein motion. The amount of Component III was fairly constant for most of the residues. For each residue, Components I and II coexisted, but the amounts of each component varied as a function of the residue position. It is interesting to note that other EPR studies have identified multiple motional components for a single labeled site. For example, residue 11 in a helix of spin labeled phospholamban exhibits 25 % of a fast motional component (0.63 ns) and 75 % of a slow motional component (4.2 ns) and were attributed to two conformations of helix in equilibrium (54). However, we are not aware of other publications with varying amounts of a particular motional component (such as our Component I) as a function of residue position.
Residue 9, with Component I spectrum, was indeed unstructured, as predicted. Component II results showed that the conformation of residues 10 and 11, and subsequent residues, were not unstructured, contrasting with that of residue 9. Thus, residue 10 was at the start of a helix, with τcII values at 3.7 ns. The periodic variation of τcII values as a function of residue position, in the region consisting of residues 10 – 47, suggested that this region folded into a curved (coiled), amphiphilic helix (36). As we have shown before, residues on the smaller curvature face (hydrophobic side) exhibited less mobility as compared to residues on the larger curvature face (hydrophilic side). A good correlation between the mobility and sequence heptad pattern was observed for residues 19 – 37. A similar correlation was also observed previously (36). The residues with large τc values (such as those at positions 19, 22, 25, 26, 28, 29, 30, 33 and 36, in bold shown below) correlated very well with the a and d positions in the heptad pattern in this region (the residues with τc fitted by sine wave 2 in Fig 7).
However, for the regions prior to residue 19 and after residue 37 (the residues with τc fitted by sine wave 1 in Fig 7), the immobile residues were at the hydrophilic positions (heptad positions b, e, and f). This change in the correlation between τc and heptad position indicated an irregular coiled helix. Interestingly, an examination of the sequence of this region, for example by the Marcoil program (55), shows one heptad residue deletion after residue 30, with K30 at “e” and E31 at “g”. This one-residue deletion in the heptad pattern in the sequence corresponds to two successive stammers in coiled coil helices (56), and is able to tighten up a coiled coil and shorten the local pitch length (57). The existence of a stammer is usually responsible for local flexibility of the helix (56). These structural features may enhance the interface interactions when associating with its binding partner (57) or may disrupt the interactions leading to diseases, such as an in-frame deletion in the desmin gene that leads to skeletal or cardioskeletal myopathy (58). Since the αII-spectrin association affinity with β-spectrin was higher than that of αI-spectrin, we examined the effect of this irregularity in αII partial domain on interactions with β-spectrin, which will be discussed below.
Residues 10 and 11 exhibited a large portion (50 – 60 %) of unstructured (Component I) motion. The proportion of Component I in the subsequent residues decreases gradually as we moved down the helix. Finally, no Component I was observed at residues 39 – 46. Thus, the N-terminal end of the helix was frayed and more flexible. The residues in the helix gradually became less frayed and less flexible, and more rigid with restricted motion, probably due to tertiary contacts. The helix merged into the putative triple helical structural domain. Residue 46 was the only residue not on the exposed surface of a helix, with low accessibility to Ni-EDDA, and therefore was buried, or facing the core of the putative helical bundle. Logically, the following residue, residue 47, was also a part of the triple helical structural domain in Helix A1, with relatively rigid side chain mobility, but exposed to solvent with high accessibility to Ni-EDDA. If residues 44 and 45 were part of Helix A1, as predicted, but on the hydrophilic side, its EPR signals would be similar to those on a single helix. We observed a gradual increase in τcII values from residue 42 to residue 47, with no clear ending of Helix C′ and starting of Helix A1.
In αI, Helix C′ has clear boundaries (residues 21 – 45) and is connected to the first structural domain via an unstructured junction region (residues 46 – 52) (17). Our prior work has suggested that the junction region in αII is not flexible, as in αI, but more rigid, and probably helical (36). The EPR spectra of these residues in αII (residues 37 – 43) differed from those of corresponding residues (residues 46 – 52) in αI-spectrin, which exhibit relatively fast side-chain motions (51). As mentioned above, in αII, residues 39 – 46 showed no Component I motion, and showed mostly Component II motions, with τc around 2 – 3 ns, except for residue 41 (about 4.4 ns). These results are in good agreement with previous speculations (36) that residues in this region exhibit restricted motions. The periodicity in the region was less regular than the upstream region, although some oscillation was observed in both τcII values and in amounts of Component II. We suggest that the conformation of this region is rigid, irregular, and possibly helical, but definitely not unstructured.
The existence of the immobilized Component III in residues 10 – 47 further indicated that the motion of Helix C′ was rigidly coupled with that of the structural domain, exhibiting no independent motion, but reflecting the motion of the entire protein molecule, in strong contrast with Helix C′ in αI-spectrin, which exhibits motions independent of the structural domain (17).
In brief, there is no clear junction region between the partial domain Helix C′ and Helix A1 of the first structural domain in αII-spectrin. The Ni-EDDA accessibility results put residue 46 in Helix A1, but it is not clear where Helix C′ ends and where Helix A1 starts. From our EPR data, we suggest the following conformation for the αII-spectrin N-terminal region. Residues 1 – 9: unstructured; residues 10 – 37/38: frayed helix (Helix C′); residues 38/39 – 43/44/45: rigid and possibly helical, and residues 44/45/46: the start of the first triple helical bundle structural domain of αII-spectrin.
Potential Interactions
Based on our NMR structure of the N-terminal region of αI-spectrin for helical register to predict the partial domain interactions at the tetramerization region as well as on other publish work on spectrin structural domains, we have previously suggested that the interactions between Helix C′ of αI-spectrin and Helices A′ and B′ of βI-spectrin involve hydrophobic core interactions and salt bridges between residues in the three helices (17). It is interesting to note that recent publications correlate our solution structure of αI-spectrin with some common mutations associated with hereditary elliptocytosis (28, 29). Using the same model for helical register (17), we found that all the residues involved in the interactions are conserved between αI- and αII-spectrin. Therefore, similar to the interactions listed in Table II of our previous paper for αI-spectrin (17), we suggest the following hydrophobic clusters: 2014F-15I-2072T (italic for residues from Helices A′ and B′ of βI-spectrin partial domain, and bold for residues from Helix C′ of αII-spectrin) and 2024W-26Y-2061W. In addition, two additional hydrophobic clusters were found in this model: 2021A-22V-2065F and 2032L-33S-2054F. The βI-spectrin residues were within 10 Å radius (from Cβ of each residue) of the αII-spectrin residues. The salt-bridges between Helices A′, B′ and C′ that we identified were 19R-2069E and 25R-2022E. These residues were within 3.8 Å (a distance used as a limit for salt bridge interaction, see 59) of each other. These potential interactions correlated well with our current ITC data, showing that residues 15 and 19 in αII-spectrin were critical for the association with C-terminal βI-spectrin protein. Residues 22, 25, 26 and 33 were at local maxima of τcII (Fig 7), and thus on the hydrophobic surface of Helix C′, and positioned for interaction with β-spectrin. In our previous findings with random mutagenesis and yeast-two-hybrid methods, we identified residues E10D, I15F/N, R18G, V22D, R25P, Y26N, R28P and R37P as significant mutations, but not D2Y, G5V, V6D and V8M, for interaction with βII-spectrin (38). The residues 15, 22, 25 and 26 (underlined in previous sentence) were identified in our model in the current studies as important interaction sites. Previously we identified that residues 10 and 37 were important for binding with βII-spectrin and speculated that Helix C′ in αII-spectrin may be longer than Helix C′ in αI-spectrin (38). This EPR study suggested that Helix C′ in αII-spectrin starts at residue 10, rather than residue 12 (the corresponding position to which αI-spectrin Helix C′ starts) and with no clear end residue, but it merges into the helix in the first structural domain.
Currently, no clinical mutations in the tetramerization region of αII-spectrin have been identified. Based on both ITC and EPR data, we suggest that mutations at positions 15, 19, 37 or 40 may lead to reduced level of spectrin tetramers and abnormal spectrin-based membrane skeleton, which may cause abnormal neuro-activities in cells. It is interesting to note that all four homologous positions 24, 28, 46 and 49 in αI-spectrin have been identified as clinical hot spots (4). In our previous speculation, we also indicated that the common charge-charge interactions between Arg-Lys at the end of the triple helical bundle was lacking in the helical bundling model (17) since the lysine residue in most C helices in full structural domains (Drosophila and chicken brain, for example) is replaced by an arginine residue in αI-spectrin Helix C′ (R45). Interestingly, in αII-spectrin, there are R36, which aligns with R45 in αI, and R37, which is more similar to R45 if Helix C′ in αII is “overwound” by one residue. Thus, according to our model, the common salt bridge at the “bottom” (C-terminal end) of many spectrin structural domains is lacking when the helices of the partial domains come together to form tetramers in both αI- and αII-spectrin.
It is also interesting to note that the selected interacting residues in βI-spectrin are also conserved in βII-spectrin. Thus, based on these predictions, the high degree of sequence homology among αI-, αII-, βI- and βII-spectrin at the tetramerization site (Helices A′, B′ and C′) suggest similar coiled-coil helical bundling for spectrin I and spectrin II to form tetramers. The differences in affinities are likely due to the differences in the junction regions, with the αI-spectrin junction region consisting of 7 unstructured residues and with αII-spectrin having Helix C′ merging into the first structural domain, as indicated in this study. We suggest that the limited independent motion for Helix C′ in αII-spectrin and the relatively free motion for Helix C′ in αI-spectrin contribute, at least in part, to the differences in association affinity with βI to give a Kd of about 0.01 μM for αII (359 residues) protein with βI model protein (this work) and a Kd of about 1 μM for a corresponding αI-spectrin model protein (368 residues) with the same βI model protein (51).
Abbreviation
- α II
recombinant protein with first 359 amino acids of non-erythroid α-spectrin
- α IIΔ
recombinant proteins of αII with single cysteine residue in the scanned region
- α IIΔR1
spin labeled αIIΔ
- β I
recombinant protein of erythroid β-spectrin with residues 1898 – 2083
- α I-spectrin
the full length erythroid alpha spectrin
- α II-spectrin
the full length non-erythroid alpha spectrin
- β I-spectrin
the full length erythroid beta spectrin
- βII-spectrin
the full length non-erythroid beta spectrin
- EPR
electron paramagnetic resonance
- Helix A′
the first of the two C-terminal partial domain helices of β-spectrin
- Helix A1
the first helix in the first structural domain of α-spectrin
- Helix B′
the second of the two C-terminal partial domain helices of β-spectrin
- Helix B1
the second helix in the first structural domain of α-spectrin
- Helix C′
the N-terminal partial domain helix of α-spectrin
- Helix C1
the third helix in the first structural domain of α-spectrin
- ITC
isothermal titration calorimetry
- Ni-EDDA
nickel ethylenediamine-di(o-hydroxyphenyl acetic acid)
- PBS7.4
5 mM sodium phosphate buffer with 150 mM NaCl at pH 7.4
- Rh
hydrodynamic radius
- τc
rotational correlation time
- τcII
τc values of Component II
Footnotes
This work was supported, in parts, by grants from the American Heart Association (0350617Z to LW-MF) and the National Institutes of Health (GM68621 to LW-MF). The high resolution/high mass accuracy LTQ-FT mass spectrometer was supported by grants from the Searle Funds at the Chicago Community Trust to the Chicago Biomedical Consortium and the University of Illinois Chicago Research Resources Center.
References
- 1.Bennett V, Baines AJ. Spectrin and ankyrin-based pathways: metazoan inventions for integrating cells into tissues. Physiol Rev. 2001;81:1353–1392. doi: 10.1152/physrev.2001.81.3.1353. [DOI] [PubMed] [Google Scholar]
- 2.Speicher DW, DeSilva TM, Speicher KD, Ursitt JA, Hembach P, Weglarz L. Location of the human red cell spectrin tetramer binding site & detection of a related “closed” hairpin loop dimer using proteolytic footprinting. J Biol Chem. 1993;268:4227–4235. [PubMed] [Google Scholar]
- 3.DeSilva TM, Peng KC, Speicher KD, Speicher DW. Analysis of human red cell spectrin tetramer (head-to-head) assembly using complementary univalent peptides. Biochemistry. 1992;31:10872–10878. doi: 10.1021/bi00159a030. [DOI] [PubMed] [Google Scholar]
- 4.Agre P. Clinical relevance of basic research on red cell membranes. Clin Res. 1992;40:176–186. [PubMed] [Google Scholar]
- 5.Delauna J, Dhermy D. Mutations involving the spectrin heterodimer contact site: clinical expression and alterations in specific function. Semin Hematol. 1993;30:21–33. [PubMed] [Google Scholar]
- 6.Gallagher PG, Zhang Z, Morrow JS, Forget BG. Mutation of a highly conserved isoleucine disrupts hydrophobic interactions in the alpha beta spectrin self-association binding site. Lab Invest. 2004;84:229–234. doi: 10.1038/labinvest.3700029. [DOI] [PubMed] [Google Scholar]
- 7.Bignone PA, Baines AJ. Spectrin alpha II and beta II isoforms interact with high affinity at the tetramerization site. Biochem J. 2003;374:613–624. doi: 10.1042/BJ20030507. [DOI] [PMC free article] [PubMed] [Google Scholar]
- 8.Sridharan DM, McMahon LW, Lambert MW. αII-spectrin interacts with five groups of functionally important proteins in the nucleus. Cell Biol Int. 2006;30:866–878. doi: 10.1016/j.cellbi.2006.06.005. [DOI] [PubMed] [Google Scholar]
- 9.Oh Y, Fung LWM. Brain proteins interacting with the tetramerization region of non-erythroid alpha spectrin. Cell Mol Biol Lett. 2007;12:604–620. doi: 10.2478/s11658-007-0028-8. [DOI] [PMC free article] [PubMed] [Google Scholar]
- 10.Ringger NC, O’Steen BE, Brabham JG, Silver X, Pineda J, Wang KKW, Hayes RL, Papa L. A novel marker for traumatic brain injury: CSF aII-spectrin breakdown products levels. J Neurotrauma. 2004;21:1443–1456. doi: 10.1089/neu.2004.21.1443. [DOI] [PubMed] [Google Scholar]
- 11.Farkas O, Polgar B, Szekeres-Bartho J, Doczi T, Povlishock JT, Buki A. Spectrin breakdown products in the cerebrospinal fluid in severe head injury - preliminary observations. Acta Neurochir (Wien) 2005;147:855–861. doi: 10.1007/s00701-005-0559-6. [DOI] [PubMed] [Google Scholar]
- 12.Deng Y, Thompson BM, Gao X, Hall ED. Temporal relationship of peroxynitrite-induced oxidative damage, calpain-mediated cytoskeletal degradation and neurodegeneration after traumatic brain injury. Exp Neurol. 2007;205:154–165. doi: 10.1016/j.expneurol.2007.01.023. [DOI] [PMC free article] [PubMed] [Google Scholar]
- 13.Voas MG, Lyons DA, Naylor SG, Arana N, Rasband MN, Talbot WS. αII-spectrin is essential for assembly of the nodes of Ranvier in myelinated axons. Current Biol. 2007;17:562–568. doi: 10.1016/j.cub.2007.01.071. [DOI] [PubMed] [Google Scholar]
- 14.Benz PM, Blume C, Moebius J, Oschatz C, Schuh K, Sickmann A, Walter U, Feller SM, Renne T. Cytoskeleton assembly at endothelia cell-cell contacts is regulated by alpha II-spectrin-VASP complexes. J Cell Biol. 2008;180:205–219. doi: 10.1083/jcb.200709181. [DOI] [PMC free article] [PubMed] [Google Scholar]
- 15.Bignone PA, King MD, Pinder JC, Baines AJ. Phosphorylation of a threonine unique to the short C-terminal isoform of beta II-spectrin links regulation of alpha-beta spectrin interaction to neuritogenesis. J Biol Chem. 2007;282:888–896. doi: 10.1074/jbc.M605920200. [DOI] [PubMed] [Google Scholar]
- 16.Park S, Mehboob S, Luo BH, Hurtuk M, Johnson ME, Fung LWM. Studies of the erythrocyte spectrin tetramerization region. Cell Mol Biol Lett. 2001;6:571–585. [PubMed] [Google Scholar]
- 17.Park S, Caffrey MS, Johnson ME, Fung LWM. Solution structural studies on human erythrocyte alpha-spectrin tetramerization site. J Biol Chem. 2003;278:21837–21844. doi: 10.1074/jbc.M300617200. [DOI] [PubMed] [Google Scholar]
- 18.Yan Y, Winograd E, Viel A, Cronin T, Harrison SC, Branton D. Crystal structure of the repetitive segments of spectrin. Science. 1993;262:2027–2030. doi: 10.1126/science.8266097. [DOI] [PubMed] [Google Scholar]
- 19.Pascual J, Pfuhl M, Wlther D, Saraste M, Nilges M. Solution structure of the spectrin repeat: a left-handed antiparallel triple-helical coiled-coil. J Mol Biol. 1997;273:740–751. doi: 10.1006/jmbi.1997.1344. [DOI] [PubMed] [Google Scholar]
- 20.Djinovic-Carugo K, Young P, Gautel M, Saraste M. Structure of the alpha-actin rod: molecular basis for cross-linking of actin filaments. Cell. 1999;98:537–546. doi: 10.1016/s0092-8674(00)81981-9. [DOI] [PubMed] [Google Scholar]
- 21.Grum V, Li D, MacDonald R, Mondragon A. Structures of two repeats of spectrin suggest models of flexibility. Cell. 1999;98:523–535. doi: 10.1016/s0092-8674(00)81980-7. [DOI] [PubMed] [Google Scholar]
- 22.Kusunoki H, MacDonald RI, Mondragon A. Structural insights into the stability and flexibility of unusual erythroid spectrin repeats. Structure. 2004;12:645–656. doi: 10.1016/j.str.2004.02.022. [DOI] [PubMed] [Google Scholar]
- 23.Law R, Carl P, Harper S, Dalhaimer P, Speicher DW, Discher DE. Cooperativity in forced unfolding of tandem spectrin repeats. Biophys J. 2003;84:533–544. doi: 10.1016/S0006-3495(03)74872-3. [DOI] [PMC free article] [PubMed] [Google Scholar]
- 24.An X, Zhang X, Salomao M, Guo X, Yang Y, Wu Y, Gratzer W, Baines AJ, Mohandas N. Thermal stabilities of brain spectrin and the constituent repeats of subunits. Biochemistry. 2006;45:13670–13676. doi: 10.1021/bi061368x. [DOI] [PMC free article] [PubMed] [Google Scholar]
- 25.Batey S, Clarke J. Apparent cooperativity in the folding of multidomain proteins depends on the relative rates of folding of constituent domains. Proc Natl Acad Sci. 2006;103:18113–18118. doi: 10.1073/pnas.0604580103. [DOI] [PMC free article] [PubMed] [Google Scholar]
- 26.Paramore S, Voth GA. Examining the influence of linkers and tertiary structure in the forced unfolding of multiple-repeat spectrin molecules. Biophys J. 2006;91:3435–3445. doi: 10.1529/biophysj.106.091108. [DOI] [PMC free article] [PubMed] [Google Scholar]
- 27.Randles LG, Rounsevell RWS, Clarke J. Spectrin domains lose cooperativity in forced unfolding. Biophys J. 2007;92:571–577. doi: 10.1529/biophysj.106.093690. [DOI] [PMC free article] [PubMed] [Google Scholar]
- 28.Baines AJ. Mechanisms of elliptocytosis: significant spectrin substitutions. Blood. 2008;111:5417. doi: 10.1182/blood-2008-02-137828. [DOI] [PubMed] [Google Scholar]
- 29.Gaetani M, Mootien S, Harper S, Gallagher PG, Speicher DW. Structural and functional effects of hereditary hemolytic anemia-associated point mutations in the alpha spectrin tetramer site. Blood. 2008;111:5712–5720. doi: 10.1182/blood-2007-11-122457. [DOI] [PMC free article] [PubMed] [Google Scholar]
- 30.Mehboob S, Jacob J, May M, Kotula L, Thiyagarajan P, Johnson ME, Fung LWM. Structural analysis of the αN-terminal region of erythroid and nonerythroid spectrins by small-angle X-ray scattering. Biochemistry. 2003;42:14702–14710. doi: 10.1021/bi0353833. [DOI] [PubMed] [Google Scholar]
- 31.Wu Y, Tian X, Lu M, Chen M, Wang Q, Ma J. Folding of small helical proteins assisted by small-angle X-ray scattering profiles. Structure. 2005;13:1587–1597. doi: 10.1016/j.str.2005.07.023. [DOI] [PubMed] [Google Scholar]
- 32.Long F, McElheny D, Jiang S, Park S, Caffrey MS, Fung LWM. Conformational change of erythroid α-spectrin at the tetramerization site upon bing β-spectrin. Protein Sci. 2007;16:2519–2530. doi: 10.1110/ps.073115307. [DOI] [PMC free article] [PubMed] [Google Scholar]
- 33.Hubbell WL, Cafiso DS, Altenbach C. Identifying conformational changes with site-directed spin labeling. Nat Struct Biol. 2000;7:735–739. doi: 10.1038/78956. [DOI] [PubMed] [Google Scholar]
- 34.Ranganathan S, Menhart N, Topouzian N, Fung LWM. Laboratory Method to Study Mutational Effects on Human Erythrocyte Spectrin Tetramerization. Am J Hematology. 2001;67:247–251. doi: 10.1002/ajh.1124. [DOI] [PubMed] [Google Scholar]
- 35.Mehboob S, Luo BH, Fung LWM. αβ spectrin association: a model system to mimic helical bundling at the tetramerization site. Biochemistry. 2001;40:12457–12464. doi: 10.1021/bi010984k. [DOI] [PubMed] [Google Scholar]
- 36.Mehboob S, Luo BH, Fu W, Johnson ME, Fung LWM. Conformational studies of the tetramerization site of human erythroid spectrin by cysteine-scanning spin-labeling EPR methods. Biochemistry. 2005;44:15898–15905. doi: 10.1021/bi051009m. [DOI] [PubMed] [Google Scholar]
- 37.Antoniou C, Fung LWM. Potential artifacts in using a glutathione S-transferase fusion protein system and spin labeling electron paramagentic resonance methods to study protein-protein interactions. Anal Biochem. 2008;376:160–162. doi: 10.1016/j.ab.2008.02.001. [DOI] [PMC free article] [PubMed] [Google Scholar]
- 38.Sumandea CA, Fung LWM. Mutational effects at the tetramerization site of nonerythroid alpha spectrin. Brain Res Mol Brain Res. 2005;136:81–90. doi: 10.1016/j.molbrainres.2005.01.003. [DOI] [PubMed] [Google Scholar]
- 39.Mchaourab HS, Lietzow MA, Hideg K, Hubbell WL. Motion of spin-labeled side chains in T4 lysozyme. Correlation with protein structure and dynamics. Biochemistry. 1996;35:7692–7704. doi: 10.1021/bi960482k. [DOI] [PubMed] [Google Scholar]
- 40.Altenbach C, Greenhalgh DA, Khorana HG, Hubbell WL. A collision gradient method to determine the immersion depth of nitroxides in lipid bilayers: application to spin-labeled mutants of bacteriorhodopsin. Proc Natl Acad Sci. 1994;91:1667–1671. doi: 10.1073/pnas.91.5.1667. [DOI] [PMC free article] [PubMed] [Google Scholar]
- 41.Budil DE, Lee S, Saxena S, Freed JH. Nonlinear-least-squares analysis of slow-motion EPR spectra in one and two dimensions using a modified Levenberg-Marquardt algorithm. J Magn Resonance, Series A. 1996;120:155–189. [Google Scholar]
- 42.Meirovitch E, Nayeem A, Freed JH. Analysis of protein-lipid interactions based on model simulations of electron spin resonance spectra. J Phys Chem. 1984;88:3454–3465. [Google Scholar]
- 43.Jacobsen K, Oga S, Hubbell WL, Risse T. Determination of the orientation of T4 lysozyme vectorially bound to a planar-supported lipid bilayer using site-directed spin labeling. Biophys J. 2005;88:4351–4365. doi: 10.1529/biophysj.105.059725. [DOI] [PMC free article] [PubMed] [Google Scholar]
- 44.Columbus L, Hubbell WL. Mapping backbone dynamics in solution with site-directed spin labeling: GCN4-58 bZip free and bound to DNA. Biochemistry. 2004;43:7273–7287. doi: 10.1021/bi0497906. [DOI] [PubMed] [Google Scholar]
- 45.Pilar J, Labsky J, Marek A, Budil DE, Earle KA, Freed JH. Segmental rotational diffusion of spin-labeled polystyrene in dilute toluene solution by 9 and 250 GHz ESR. Macromolecules. 2000;33:4438–4444. [Google Scholar]
- 46.Columbus L, Kalai T, Jeko J, Hideg K, Hubbell WL. Molecular motion of spin labeled side chains in alpha-helices: analysis by variation of side chain structure. Biochemistry. 2001;40:3828–3846. doi: 10.1021/bi002645h. [DOI] [PubMed] [Google Scholar]
- 47.Cherry L, Menhart N, Fung LWM. Spin label EPR structural studies of the N-terminus of alpha-spectrin. FEBS Letters. 2000;446:341–345. doi: 10.1016/s0014-5793(00)01096-6. [DOI] [PubMed] [Google Scholar]
- 48.Guo Z, Cascio D, Hideg K, Hubbell WL. Structural determinants of nitroxide motion in spin-labeled proteins: Solvent-exposed sites in helix B of T4 lysozyme. Protein Sci. 2008;17:1–12. doi: 10.1110/ps.073174008. [DOI] [PMC free article] [PubMed] [Google Scholar]
- 49.Yamada MD, Maruta S, Yasuda S, Kondo K, Maeda H, Arata T. Conformational dynamics of loops L11 and L12 of kinesin as revealed by spin-labeling EPR. Biochem Biophys Res Commun. 2007;364:620–626. doi: 10.1016/j.bbrc.2007.10.043. [DOI] [PubMed] [Google Scholar]
- 50.Crane JM, Suo Y, Lilly AA, Mao C, Hubbell WL, Randall LL. Sites of interaction of a precursor polypeptide on the export chaperone SecB mapped by site-directed spin labeling. J Mol Bio. 2006;363:63–74. doi: 10.1016/j.jmb.2006.07.021. [DOI] [PMC free article] [PubMed] [Google Scholar]
- 51.Antoniou C, Lam V, Fung LW-M. Conformational changes at the tetramerization site of erythroid α-spectrin upon binding β-spectrin: a spin label EPR study. 2008 doi: 10.1021/bi800840p. in press. [DOI] [PMC free article] [PubMed] [Google Scholar]
- 52.Lietzow MA, Hubbell WL. Motion of spin label side chains in cellular retinol-binding protein: correlation with structure and nearest-neighbor interactions in an antiparallel beta-sheet. Biochemistry. 2004;43:3137–3151. doi: 10.1021/bi0360962. [DOI] [PubMed] [Google Scholar]
- 53.Oh KJ, Barbuto S, Meyer N, Kim RS, Collier RJ, Korsmeyer SJ. Conformational changes in BID, a pro-apoptotic BCL-2 family member, upon membrane binding. J Biol Chem. 2005;280:753–767. doi: 10.1074/jbc.M405428200. [DOI] [PubMed] [Google Scholar]
- 54.Kirby TL, Karim CB, Thomas DD. Electron paramagnetic resonance reveals a large-scale conformational change in the cytoplasmic domain of phospholamban up binding to the sarcoplasmic reticulum Ca-ATPase. Biochemistry. 2004;43:5842–5852. doi: 10.1021/bi035749b. [DOI] [PubMed] [Google Scholar]
- 55.Delorenzi M, Speed T. An HMM model for coiled-coil domains and a comparison with PSSM-based predictions. Bioinfomatics. 2002;18:617–625. doi: 10.1093/bioinformatics/18.4.617. [DOI] [PubMed] [Google Scholar]
- 56.Brown JH, Cohen C, Parry DA. Heptad breaks in alpha-helical coiled coils: stutters and stammers. Proteins. 1996;26:134–145. doi: 10.1002/(SICI)1097-0134(199610)26:2<134::AID-PROT3>3.0.CO;2-G. [DOI] [PubMed] [Google Scholar]
- 57.Gruber M, Lupas AN. Historical review: another 50th anniversary - new periodicities in coiled coils. Trends Biochem Sci. 2003;28:679–685. doi: 10.1016/j.tibs.2003.10.008. [DOI] [PubMed] [Google Scholar]
- 58.Kaminska A, Strelkov SV, Goudeau B, Olive M, Daqvadorj A, Fidzianska A, Simon-Casteras M, Shatunov A, Dalakas MC, Ferrer I, Kwiecinski H, Vicart P, Goldfarb LG. Small deletion disturb desmin architecture leading to breakdown of muscle cells and development of skeletal for cardioskeletal myopathy. Hum Genet. 2003;114:306–313. doi: 10.1007/s00439-003-1057-7. [DOI] [PubMed] [Google Scholar]
- 59.Meier M, Burkhard P. Statistical analysis of intrahelical ionic interactions in α-helices and coiled coils. J Struct Biol. 2006;155:116–129. doi: 10.1016/j.jsb.2006.02.019. [DOI] [PubMed] [Google Scholar]