

Abstract
Fibrin plays a vital structural role in thrombus integrity. Thus, the ability to assess fibrin architecture has potential to provide insight into thrombosis and thrombolysis. Fibrin has an anisotropic molecular structure, which enables it to be seen with polarized light. Therefore, we aimed to determine if automated polarized light microscopy methods of quantifying two structural parameters; fibrin fiber bundle orientation and fibrin's optical retardation (OR: a measure of molecular anisotropy) could be used to assess thrombi. To compare fibrin fiber bundle orientation we analyzed picrosirius red-stained sections obtained from clots formed: (A) in vitro, (B) in injured and stenotic coronary arteries, and (C) in surgically created aortic aneurysms (n = 6 for each group). To assess potential changes in OR, we examined fibrin in picrosirius red-stained clots formed after ischemic preconditioning (10 minutes ischemia + 10 minutes reflow; a circumstance shown to enhance lysability) and in control clots (n = 8 each group). The degree of fibrin organization differed significantly according to the location of clot formation; fibrin was most aligned in the aneurysms and least aligned in vitro whereas fibrin in the coronary clots had an intermediate organization. The OR of fibrin in the clots formed after ischemic preconditioning was lower than that in controls (2.9 ± 0.5 nm versus 5.4 ± 1.0 nm, P < 0.05). The automated polarized light analysis methods not only enabled fibrin architecture to be assessed, but also revealed structural differences in clots formed under different circumstances.
Keywords: birefringence, blood coagulation, fibrin, polarization microscopy, thrombosis
Introduction
Fibrin organization plays an important role in the structural integrity of blood clots [1] and hence methods designed to assess fibrin structure have the potential to increase understanding of both clot formation and dissolution. Several microscopy-based approaches are currently employed to examine fibrin structure and, although each offers insight, each also possesses disadvantages. For example, the most frequent approach, scanning electron microscopy (SEM), permits the resolution of individual fibrin fibers [2, 3]; however, at high magnification, it can be difficult to ‘see the forest for the trees’ and hence structural organization on a scale larger than that of individual fibers might not be discerned. In addition, sample preparation for SEM is time-consuming and hence this approach is not the most practical when large numbers of samples need to be assessed. At the other end of the microscopy resolution spectrum, brightfield examination of hematoxylin and eosin and Mallory-Azan-stained sections is often still used, sometimes in combination with immunohistochemistry, to assess clots [4]. These latter approaches are limited in that they yield little information beyond the amount and localization of fibrin. Additional molecular information may be derived from confocal imaging combined with fluorescent probes [5] and laser scanning confocal microscopy has been shown to be capable of revealing architectural changes in fibrin during clot formation and clot lysis [6, 7]. Moreover, confocal reflection imaging techniques have the potential to assess fibrin's three-dimensional organization [8]. However, at present, analysis of fibrin organization in confocal images is often descriptive or semi-quantitative.
Thus, there appear to be gaps between the available qualitative assessment methods and the desire to quantify structural differences, and between methods which provide relatively limited information versus those which can provide excessive information. One technique with the potential to fill these gaps (i.e., enable fibrin's structural organization to be quantified and do so at a magnification which permits large clot areas to be assessed in the same sample) is polarized light microscopy. The basis for this premise is that polarized light microscopy has proven useful in assessment of the organization of collagen [9-11], another elongated protein with an anisotropic molecular structure. Indeed, polarized light was first used to study fibrin more than 150 years ago [12], but has seldom been used since then; possibly because quantitative analysis was time consuming and technically challenging. However, recent technological developments have enabled such polarized light-based measurements to be readily and rapidly obtained [13, 14]. Based on the success in applying these novel automated methods in the examination of collagen architecture [15-17], our current aim was to reevaluate the use of polarized light microscopy for the quantitative assessment of fibrin organization in blood clots.
Materials and methods
Our study's main goal was to demonstrate that fibrin could be assessed with polarized light microscopy and, furthermore, that differences in fibrin architecture could be identified and resolved. Our secondary goal was to determine if different staining methods permitted greater differentiation of tissue elements and, or, provided greater resolution of structural differences. To achieve these objectives, we exploited the optical properties of birefringent materials (i.e., materials with an anisotropic molecular structure), such as fibrin, when viewed with polarized light. These properties enabled us to perform both qualitative and quantitative assessment of fibrin architecture. For the former, we examined; (1) the color differentiation and relative birefringence of fibrin versus other blood elements, and (2) the overall organization of fibrin fiber bundles within each of the clots assessed. For the latter, we analyzed two specific structural parameters; (1) two-dimensional fibrin fiber bundle orientation, and (2) fibrin's optical retardation (OR), an assessment of the degree of molecular anisotropy within a fiber bundle. Anisotropic materials introduce a path difference between the two rays into which polarized light is resolved as it passes through the material. The magnitude of this optical retardation or path difference, Γ, is given by the equation; Γ = t (n1 - n2) where t is the thickness of the material and (n1 - n2) is the difference in refractive index of the material in the two orthogonal directions [18]. In turn, this difference in refractive index is determined by the material's molecular structure. For example, the OR of collagen fibers in healing wounds increases as the fibers mature; this is not only due to an increase in fiber thickness increases, but also because there is an increase in molecular anisotropy [9].
We examined formalin-fixed, paraffin-embedded, tissue sectioned at a thickness of 5 μm (i.e., routine histological preparation) from previous work in our laboratory [19-22] in addition to tissue from ongoing studies. All of these experiments were approved by the appropriate Institutional Animal Care and Use Committee. These samples were intentionally selected to provide a range of clot ages and circumstances of formation, two parameters we hypothesized would produce different structural organization. Qualitative examination was performed with both linearly and circularly polarized light [23] using an Olympus BX51 microscope (Olympus America, Inc., Melville, NY). For the quantitative analysis, we attached an LC-PolScope imaging system (CRI, Inc., Woburn, MA) to the same microscope. The design and description of the PolScope system has been published [13, 14]. Briefly, an electronically-controlled liquid-crystal compensator was employed to acquire, with a CCD camera, images of the clots (observed through a X40-magnification objective lens) obtained at four predetermined compensator settings. Mathematical algorithms are then used to calculate both the magnitude of the OR and the orientation of the slow axis of birefringence at each point in the image; for fibrin, the slow axis of birefringence corresponds to the long axis of the fiber.
Two-dimensional fiber orientation
We examined fibrin orientation from 18 clot samples (n = 6 for each group as described below) which we anticipated would possess a wide range of different fiber bundle orientation distributions. Specifically, we analyzed in vitro-formed clots (canine blood was placed in a test-tube for 30 minutes prior to formalin fixation), clots formed within canine coronary arteries after injury to the tunica media and placement of a stenosis (the so-called Folts model [22]), and clots from luminal thrombi obtained six weeks after surgical creation of an abdominal aortic aneurysm and subsequent placement of embolic coils in pigs [19]. All of the sections were stained with picrosirius red [24]. We measured fiber bundle orientation at 50 locations in images produced using the PolScope system. The measurement locations were defined by a 10 × 5 point rectangular grid-pattern or, if the grid-point did not intersect a fiber bundle, the closest fibrin fiber bundle to each grid-point was analyzed. The measured orientation angles were then analyzed using circular statistics, a branch of statistics formulated to assess directional data [25], methods which we have used previously to assess collagen fiber and cardiac muscle cell orientation [26, 27]. We calculated the angular deviation (AD) of each distribution, a parameter that is the circular statistics equivalent of standard deviation and indicates the degree of alignment (i.e., the smaller the AD, the more aligned the fibrin). The average AD was calculated for each group and the means compared using analysis of variance with subsequent inter-group comparison performed using Tukey's test. In addition, in the vascular samples, fibrin orientation was plotted relative to the tangent angle to the blood vessel wall at the location where the measurements were taken.
Optical retardation
Our rationale was, again, to select clots which we anticipated would possess a range of different ORs related to the genesis of thrombus formation. Specifically, previous work indicated that coronary artery thrombi formed in hearts subjected to ischemic preconditioning (periods of brief myocardial ischemia prior to a sustained ischemic episode) lysed faster with fibrinolytic therapy than thrombi formed without preconditioning; this phenomenon has been found in both human (with preinfarction angina pectoris serving as the proxy for ischemic preconditioning) and animal studies [22, 28]. Our hypothesis was that such enhanced lysis might be due to the formation of a different fibrin structure. To test this concept, we examined clots from eight controls (no preceding ischemia) and eight preconditioned subjects (10 minutes of ischemia followed by 10 minutes of reflow prior to the final occlusion). In both groups, the thrombi were obtained one hour after the initiation of total coronary artery occlusion. We made 50 OR measurements in each picrosirius red-stained section in locations determined by the use of the rectangular grid described above; however, if the thrombus region containing fibrin was small, then fewer measurements (minimum of 25) were made. The mean values were calculated and compared using a t-test.
Tissue differentiation and fibrin birefringence enhancement by staining
Although picrosirius red has proven useful for collagen staining, there was no reason to assume that it was the best stain to use for fibrin. We therefore examined other dyes belonging to the same group as the dye in picrosirius red – Sirius Red F3BA – azo dyes which contain the N=N chromophore. We examined 14 other azo dyes (Sigma-Aldrich Corp., St. Louis, MO), which we speculated might provide similar or better color differentiation and birefringence enhancement than Sirius Red F3BA (Direct Red 80; Colour Index 35780). Serial sections from an artery known to have a large fibrin-containing clot were stained and examined with each dye (Table 1). A 1% solution of each dye was prepared by dissolving it in picric acid, which is how picrosirius red is also prepared. Picric acid (Colour Index 10305) alone was also used as a stain. The sections were hydrated in solutions of decreasing alcohol concentration, washed in running water for 20 minutes, and then placed in the staining solution for 90 minutes. After two brief rinses in 100% alcohol, sections were cleared in xylene and mounted using a xylene-based medium (Cytoseal XYL, Richard-Allen Scientific, Kalamazoo, MI). We then examined the sections with brightfield illumination and polarized light and also, when appropriate, measured the OR of fibrin.
Table 1.
Dye-mediated tissue color differentiation and birefringence enhancement
| Dye name | Colour Index | Fibrin staining result | |
|---|---|---|---|
| color differentiation | birefringence enhancement | ||
| Direct Blue 1 | 24410 | ++ | 0 |
| Direct Blue 15 | 24400 | +++ | + |
| Direct Red 23 | 29160 | + | + |
| Direct Red 24 | 29185 | +++ | +++ |
| Direct Red 26 | 29190 | +++ | +++ |
| Direct Red 81 | 28160 | +++ | +++ |
| Direct Red 83 | 29225 | +++ | ++ |
| Acid Red 1 | 18050 | ++ | + |
| Acid Red 14 | 14720 | ++ | + |
| Acid Red 34 | 17030 | + | + |
| Acid Red 88 | 15620 | 0 | ++ |
| Acid Red 151 | 26900 | + | + |
| Diamine Fast Scarlet | 27130 | 0 | + |
| Orange II | 15510 | 0 | ++ |
| Picric acid | 10305 | 0 | ++ |
0 = none, + = weak, ++ = some, +++ = yes
Results
Fibrin stained with picrosirius red appeared yellow when observed with brightfield illumination, but pale green when viewed with polarized light (Figure 1). In contrast, although the other main component of the thrombus, red blood cells, also appeared yellow in brightfield, the cells were not birefringent and so could not be seen with polarized light (although not present in this thrombus, platelets also stain yellow, but are non-birefringent). Thus, the combination of picrosirius red staining and polarized light microscopy provided a method of identifying fibrin and differentiating it from other blood elements. In addition, the fibrous nature and organization of fibrin can be qualitatively appreciated when viewed with polarized light.
Figure 1.
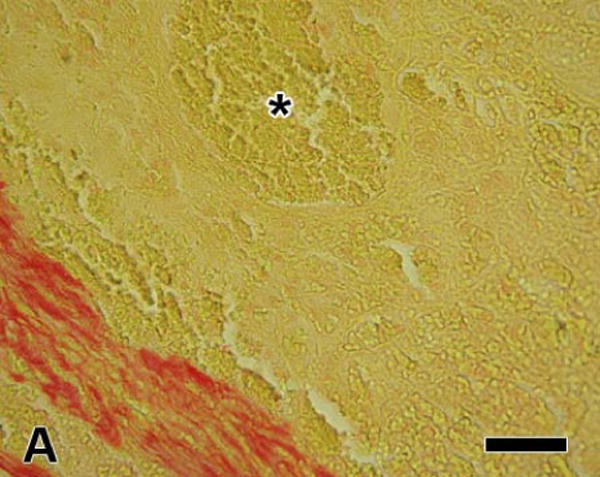
Arterial thrombus stained with picrosirius red; (A) viewed with brightfield illumination; fibrin and red blood cells stain yellow while collagen stains red, (B) the same field viewed with linearly polarized light; fibrin appears pale green, red blood cells appear dark, and collagen fibers are much brighter than the fibrin fiber bundles and appear green, yellow, or orange (the color changes as fiber thickness increases). The region marked with the asterisk contains mainly red blood cells; however, the polarized image shows some thin fibrin fiber bundles present there also. [bar = 50 μm]
Two-dimensional orientation
As anticipated, we found a wide range of fibrin fiber bundle orientations from the three types of clot examined; ranging from a whorled appearance in the in vitro-formed, 30 minute-old clots to a highly aligned structure in the six week-old thrombus located within the lumen of the aortic aneurysms (Figure 2). These major qualitative structural differences were reflected in the quantitative analysis. The average AD was 28.5 ± 1.9° in the in vitro-formed thrombi versus 6.0 ± 2.1 ° in the aneurysm (P<0.001); consistent with substantial differences in fibrin alignment (Figure 3). The AD of orientation distributions obtained from the coronary artery clots formed after vascular injury were intermediate between the two other examples; AD = 17.9 ± 2.3°, P < 0.01 versus the other groups. Figure 3 also shows representative orientation histograms obtained from individual clots. In both vascular clots, the mean orientation of the distributions corresponded to the circumferential direction within the vessel; i.e., fibrin fiber bundles were generally aligned parallel to the tangent to the vessel wall adjacent to where the measurements were taken. In the in vitro-formed clots, the orientation distributions were so spread out and the ADs so high, we subsequently sought to determine, using Kuiper's test [25], if the fibrin orientation was randomly distributed. This analysis revealed that although the fibrin was disorganized, all the in vitro orientation distributions differed significantly (P < 0.01) from random.
Figure 2.

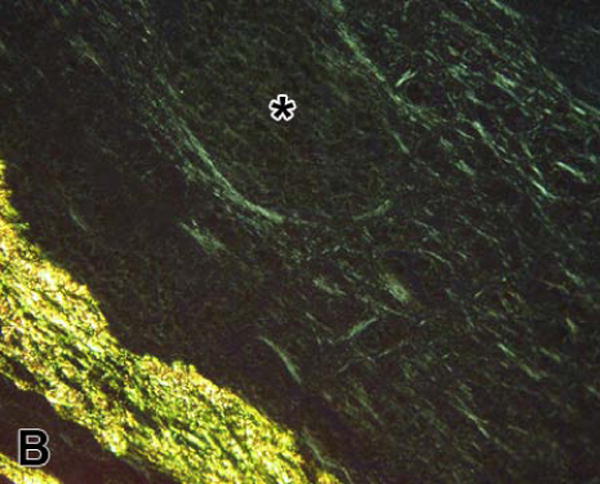
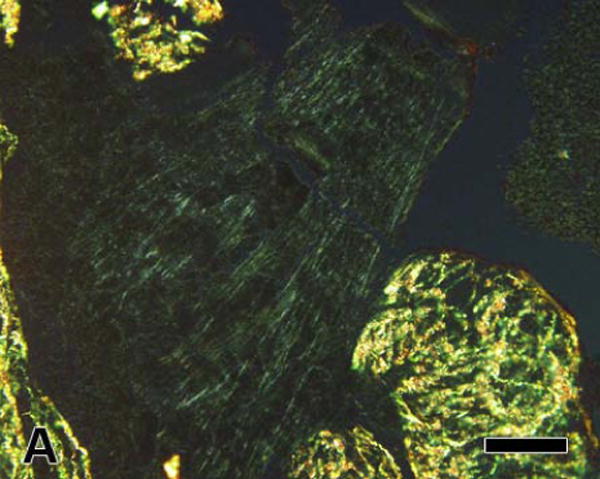
Fibrin viewed with circularly polarized light. Picrosirius red-stained sections of clots; (A) from an aortic aneurysm and (B) formed in vitro. Fibrin fiber bundles in the aneurysm clot are highly aligned and are organized in parallel with each other (diagonally in the image). In contrast, there is much less organization in the in vitro-formed clot and the fibrin fiber bundles have a whorled appearance. The three arrows indicate the orientation of fibrin fiber bundles immediately below them and cover a range of orientations of approximately 90°. The asterisk de notes the location of a folding artifact within the section. The clot appears much brighter along this fold (running diagonally below and to the right) because of the increase in thickness of fibrin produced by the fold. [bar = 50 μm]
Figure 3.

Fibrin organization in blood clots. The top left panel shows the average angular deviation of orientation distributions analyzed from clots formed in three different locations (n = 6 for each location). The angular deviation was smallest and hence the fibrin fiber bundles were most aligned in the aortic aneurysm samples; * P < 0.01 versus the other two groups, ** P < 0.001 versus in vitro clots. The other panels show representative fibrin fiber bundle orientation distributions for each group. The x-axis represents the orientation angle; divided into 10° increments and 0° corresponds to the distribution's mean orientation. Any distribution can be covered by a 180° range because a fiber bundle has no head or tail and hence 360° is not required. The y-axis shows the percentage of fiber bundles within each 10° orientation angle range. The angular deviation (AD) of each distribution is denoted on the panels and, for each sample, is close to that of the group mean. In the aortic sample, the entire distribution of fibrin fiber bundle orientations is covered by only 30° resulting in a sharply peaked distribution. In contrast, the in vitro sample is more uniformly distributed and covers the whole 180° range. In the vascular samples, arrows denote the tangent to the vessel wall at the location where measurements were taken – the tangent angle did not differ from the mean of the distribution (0°) indicating that fibrin was generally circumferentially aligned (i.e., parallel to the tangent to the vessel wall).
Optical retardation
In the comparison of clots formed in vessels with and without prior episodes of preconditioning ischemia, fibrin in control clots had a significantly higher OR than that measured in preconditioned clots (5.4 ± 0.8 nm versus 2.9 ± 0.4 nm; P = 0.013; Figure 4) – there was no difference in fibrin orientation between the two groups (data not shown). This 45% difference in OR was also apparent from inspection of the polarized light images (Figure 4).
Figure 4.

Linearly polarized light images of fibrin in clots formed in coronary arteries after; (A) a control occlusion and (B) after ischemic preconditioning; 10 minutes of coronary artery occlusion followed by 10 minutes of reperfusion prior to the final 60 minute occlusion. Approximately the same amount of green fibrin can be seen in both images; however, fibrin in the clot formed after ischemic preconditioning appears less birefringent (less bright) than in the control clot. This difference was confirmed by the finding of significantly lower values of fibrin's optical retardation in the preconditioned clot (* P = 0.013 versus control). [bar = 50 μm]
Tissue differentiation and fibrin birefringence enhancement by staining
We found a range of dye effects (Table 1); however, only dyes which produced both color differentiation between fibrin and other tissue elements and fibrin birefringence enhancement (++ in each column) were selected for OR analysis. Optical retardation measurements were made at 30-50 locations in each clot and the mean values compared using ANOVA followed by Dunnett's Multiple Comparison Test (Sirius Red was used as the control group). None of the dyes produced significantly higher OR values versus Sirius Red, although OR after staining with Direct Red 83 was lower (4.3 ± 0.2 versus 5.4 ± 0.2 nm with Sirius Red; P < 0.05).
Discussion
Even though, according to von Dungern [12], fibrin's birefringence was first reported in 1849 by Ehrenberg, this method of clot visualization and analysis has seldom been used since then and has never, as far as we are aware, been used to examine fibrin orientation. This failure to use a potentially informative method probably occurred because quantitative manual analysis was time-consuming. Nonetheless, we found that the automated polarized light microscopy analysis methods not only enabled rapid quantification of fibrin's architectural organization, but also permitted us to distinguish structural differences between clots formed under different circumstances.
Fibrin architecture
The fibrin structure revealed by polarized light microscopy is not that of the individual fibers shown in electron microscopy micrographs, but rather groups of fibers or fiber bundles – analogous to collagen's structure, this is similar to the difference between fibrils and fibers (groups of fibrils). However, the nomenclature for fibrin is well-established and so we have used the term fiber bundles to denote the structures we observed. A typical fiber bundle shown in Figures 1 and 2 is approximately 2.5 microns wide. Fiber diameters measured from SEM images are 0.1 – 0.3 microns [2, 7] and hence the fibrin fiber bundles would each contain approximately 10 – 25 individual fibers. Published SEM images appear to show little evidence of the fiber bundle organization revealed by polarized light; however, it should be noted that the SEM images are often less than 20 microns in width and also are usually of clots made in vitro; for example see Mills and colleagues [29]. The former condition means that larger scale organization is difficult to see. For the latter circumstance, we found the in vitro-formed clots to contain a disorganized, whorl-like structure of fiber bundles, which is consistent with the published SEM micrographs. Furthermore, we found that the organization of in vitro-formed clots was significantly different from that found in the coronary artery clots. The latter represents a structure likely to be found in cases of human coronary artery occlusion and hence conclusions drawn from analysis or treatment of in vitro clots should be made with caution.
Comparison of methods
There has been increasing interest in the role of fibrin architecture in clot structure and fibrinolysis ranging from the influence of genetic and environmental factors [29-33] to fibrin's mechanical properties [34]. Assessment of fibrin architecture has required the development of new methods or the application of methodology from other fields; for example, both confocal and atomic force microscopy have been applied [8, 35]. Although these techniques have significant potential, they do have some disadvantages; for example, the expense of the equipment, the time required for sample preparation, and the current lack of quantification methods. Quantification of fibrin fiber orientation from SEM and confocal images has not, as far as we are aware, been done. Typically, quantitative analysis takes the form of measurement of fiber diameters from SEM images and sometimes, for confocal microscopy, parameters such as branch point and fiber densities are measured; for example, Collet et al. 2005 [36]. Otherwise, structural assessment is qualitative and usually comparative. In contrast, the polarized light methods enable two-dimensional fiber orientation to be measured. Nevertheless, this method is not intended to replace SEM and confocal microscopy assessment, but rather compliment them. For example, the time and expense required do not make it a practical option for all clots in a study to be prepared for, and examined by, scanning electron microscopy. In addition, the increased availability of genetically-manipulated mouse models [37-39], combined with the development of small animal models of thrombus formation [40, 41] should further increase interest in methods designed to assess fibrin architecture. Hence, one potential role for the polarized light methodology could be to screen clots and identify candidates that warrant examination using techniques with greater spatial resolution or designed to reveal specific features.
Dye selection
These polarized light microscopy analysis methods may be performed on unstained sections; however, dyes can enhance fibrin's natural birefringence, making it easier to see, and also provide color differentiation, making it easier to distinguish fibrin from collagen and other materials. Picrosirius red was first proposed as a dye to identify collagen and enhance its birefringence and it was therefore not a surprise that this dye also enhanced fibrin's birefringence. Of the 14 other dyes we evaluated, none increased fibrin's OR versus that found with Sirius Red. Therefore, Sirius Red, because of its availability and widespread use in histology, represents the most practical current choice for a fibrin stain. Nevertheless, there are many other dyes in the ‘azo family’ and we cannot exclude the possibility that there may be one which provides greater birefringence enhancement and better color differentiation than those we examined.
In vivo versus in vitro fibrin organization
In addition to a demonstration of the methodology's application, our study also provided insight into how fibrin architecture is influenced by the circumstances of clot formation. For example, we found that the clot's formation location appeared to be a determinant of fiber bundle orientation. Although the in vitro-formed clots did not have a random fibrin orientation, they were far from aligned. In contrast, significantly greater alignment was found in the clots formed in coronary arteries. Moreover, the fact that the mean of the orientation distributions generally corresponded to the circumferential direction suggests the influence of a substrate and guide for fibrin alignment; however, whether this is related to blood flow-mediated effects or the organization of structural elements within the vessel wall remains to be determined. Fibrin alignment also appeared to increase with time; alignment was greatest in the six week-old aortic aneurysm samples and, again, the mean fibrin orientation corresponded closely to the circumferential direction in the tissue. Our finding of smaller values of optical retardation in clots formed after preconditioning ischemia versus control clots, together with the earlier finding that such clots are lysed faster with recombinant tissue-type plasminogen activator [22, 28], is consistent with the hypothesis that there is an association between optical retardation and clot lysability. Whether this difference in OR is because of a decrease in fiber bundle thickness in the clots formed after preconditioning, a decrease in molecular anisotropy, or both awaits further investigation. Other studies have also suggested a connection between fibrin architecture and clot lysability. For example, Collet and colleagues found, using confocal microscopy, that fibrin morphology within a clot correlated with the speed of fibrinolysis [36]. Specifically, coarse fibrin networks composed of thick fibers lysed faster than tight fibrin networks made up of thinner fibers, even though thin fibers were cleaved faster than thick fibers. However, both fibrin networks, which were created in vitro using different thrombin concentrations, appeared to lack organization – consistent with the structure we observed for in vitro clots – and hence may not reflect the structure found in vivo.
In summary, we have established that polarized light microscopy provides a method to assess clot structure quantitatively. Furthermore, we have demonstrated that clots formed under different circumstances possess significantly different fibrin fiber bundle architecture. Although many factors influence clot structure and fibrinolysis, it is likely that any method which provides insight into fibrin architecture will aid in the understanding of thrombosis and thrombolytic therapy. Therefore, we propose that this polarized light microscopy approach provides a potentially valuable addition to the methods currently employed to assess fibrin structure.
Acknowledgments
Supported by R01 HL 64768-01 and R56 HL72684 (K. Przyklenk).
Footnotes
Presented, in part, at the XXIst Congress of the International Society on Thrombosis and Haemostasis. Geneva 2007.
Publisher's Disclaimer: This is a PDF file of an unedited manuscript that has been accepted for publication. As a service to our customers we are providing this early version of the manuscript. The manuscript will undergo copyediting, typesetting, and review of the resulting proof before it is published in its final citable form. Please note that during the production process errors may be discovered which could affect the content, and all legal disclaimers that apply to the journal pertain.
References
- 1.Wolberg AS. Thrombin generation and fibrin clot structure. Blood Rev. 2007;21:131–142. doi: 10.1016/j.blre.2006.11.001. [DOI] [PubMed] [Google Scholar]
- 2.Ryan EA, Mockros LF, Weisel JW, Lorand L. Structural origins of fibrin clot rheology. Biophys J. 1999;77:2813–2826. doi: 10.1016/S0006-3495(99)77113-4. [DOI] [PMC free article] [PubMed] [Google Scholar]
- 3.Di Stasio E, Nagaswami C, Weisel JW, Di Cera E. Cl- regulates the structure of the fibrin clot. Biophys J. 1998;75:1973–1979. doi: 10.1016/S0006-3495(98)77638-6. [DOI] [PMC free article] [PubMed] [Google Scholar]
- 4.Hoshiba Y, Hatakeyama K, Tanabe T, et al. Co-localization of von Willebrand factor with platelet thrombi, tissue factor and platelets with fibrin, and consistent presence of inflammatory cells in coronary thrombi obtained by an aspiration device from patients with acute myocardial infarction. J Thromb Haemost. 2006;4:114–120. doi: 10.1111/j.1538-7836.2005.01701.x. [DOI] [PubMed] [Google Scholar]
- 5.Podor TJ, Peterson CB, Lawrence DA, et al. Type 1 plasminogen activator inhibitor binds to fibrin via vitronectin. J Biol Chem. 2000;275:19788–19794. doi: 10.1074/jbc.M908079199. [DOI] [PubMed] [Google Scholar]
- 6.Collet JP, Lesty C, Montalescot G, Weisel JW. Dynamic changes of fibrin architecture during fibrin formation and intrinsic fibrinolysis of fibrin-rich clots. J Biol Chem. 2003;278:21331–21335. doi: 10.1074/jbc.M212734200. [DOI] [PubMed] [Google Scholar]
- 7.Collet JP, Moen JL, Veklich YI, et al. The αC domains of fibrinogen affect the structure of the fibrin clot, its physical properties, and its susceptibility to fibrinolysis. Blood. 2005;106:3824–3830. doi: 10.1182/blood-2005-05-2150. [DOI] [PMC free article] [PubMed] [Google Scholar]
- 8.Hartmann A, Boukamp P, Friedl P. Confocal reflection imaging of 3D fibrin polymers. Blood Cells Mol Dis. 2006;36:191–193. doi: 10.1016/j.bcmd.2005.12.033. [DOI] [PubMed] [Google Scholar]
- 9.Whittaker P, Boughner DR, Kloner RA. Analysis of healing after myocardial infarction using polarized light microscopy. Am J Pathol. 1989;134:879–893. [PMC free article] [PubMed] [Google Scholar]
- 10.Whittaker P, Boughner DR, Perkins DG, Canham PB. Quantitative structural analysis of collagen in chordae tendineae and its relation to floppy mitral valves and proteoglycan infiltration. Br Heart J. 1987;57:264–269. doi: 10.1136/hrt.57.3.264. [DOI] [PMC free article] [PubMed] [Google Scholar]
- 11.Whittaker P, Zheng S, Patterson MJ, et al. Histologic signatures of thermal injury: applications in transmyocardial laser revascularization and radiofrequency ablation. Lasers Surg Med. 2000;27:305–318. doi: 10.1002/1096-9101(2000)27:4<305::aid-lsm3>3.0.co;2-w. [DOI] [PubMed] [Google Scholar]
- 12.von Dungern M. Polarisationsoptik und Feinbau des Fibringerinnsels. Zeitschrift für Biologie. 1938;98:136–150. [Google Scholar]
- 13.Katoh K, Hammar K, Smith PJ, Oldenbourg R. Birefringence imaging directly reveals architectural dynamics of filamentous actin in living growth cones. Mol Biol Cell. 1999;10:197–210. doi: 10.1091/mbc.10.1.197. [DOI] [PMC free article] [PubMed] [Google Scholar]
- 14.Oldenbourg R, Mei G. New polarized light microscope with precision universal compensator. J Microsc. 1995;180:140–147. doi: 10.1111/j.1365-2818.1995.tb03669.x. [DOI] [PubMed] [Google Scholar]
- 15.Deguchi JO, Aikawa E, Libby P, et al. Matrix metalloproteinase-13/collagenase-3 deletion promotes collagen accumulation and organization in mouse atherosclerotic plaques. Circulation. 2005;112:2708–2715. doi: 10.1161/CIRCULATIONAHA.105.562041. [DOI] [PubMed] [Google Scholar]
- 16.Aikawa E, Whittaker P, Farber M, et al. Human semilunar cardiac valve remodeling by activated cells from fetus to adult: implications for postnatal adaptation, pathology, and tissue engineering. Circulation. 2006;113:1344–1352. doi: 10.1161/CIRCULATIONAHA.105.591768. [DOI] [PubMed] [Google Scholar]
- 17.Yano T, Miura T, Whittaker P, et al. Macrophage colony-stimulating factor treatment after myocardial infarction attenuates left ventricular dysfunction by accelerating infarct repair. J Am Coll Cardiol. 2006;47:626–634. doi: 10.1016/j.jacc.2005.09.037. [DOI] [PubMed] [Google Scholar]
- 18.Wolman M. On the use of polarized light in pathology. Pathol Annu. 1970;5:381–416. [PubMed] [Google Scholar]
- 19.Ruiz CE, Zhang HP, Butt AI, Whittaker P. Percutaneous treatment of abdominal aortic aneurysm in a swine model: understanding the behavior of aortic aneurysm closure through a serial histopathological analysis. Circulation. 1997;96:2438–2448. doi: 10.1161/01.cir.96.7.2438. [DOI] [PubMed] [Google Scholar]
- 20.Hata K, Whittaker P, Kloner RA, Przyklenk K. Brief antecedent ischemia attenuates platelet-mediated thrombosis in damaged and stenotic canine coronary arteries: role of adenosine. Circulation. 1998;97:692–702. doi: 10.1161/01.cir.97.7.692. [DOI] [PubMed] [Google Scholar]
- 21.Linden MD, Whittaker P, Frelinger AL, 3rd, et al. Preconditioning ischemia attenuates molecular indices of platelet activation-aggregation. J Thromb Haemost. 2006;4:2670–2677. doi: 10.1111/j.1538-7836.2006.02228.x. [DOI] [PubMed] [Google Scholar]
- 22.Przyklenk K, Whittaker P. Brief antecedent ischemia enhances recombinant tissue plasminogen activator-induced coronary thrombolysis by adenosine-mediated mechanism. Circulation. 2000;102:88–95. doi: 10.1161/01.cir.102.1.88. [DOI] [PubMed] [Google Scholar]
- 23.Whittaker P, Kloner RA, Boughner DR, Pickering JG. Quantitative assessment of myocardial collagen with picrosirius red staining and circularly polarized light. Basic Res Cardiol. 1994;89:397–410. doi: 10.1007/BF00788278. [DOI] [PubMed] [Google Scholar]
- 24.Puchtler H, Waldrop FS, Valentine LS. Polarization microscopic studies of connective tissue stained with picro-sirius red FBA. Beitr Pathol. 1973;150:174–187. doi: 10.1016/s0005-8165(73)80016-2. [DOI] [PubMed] [Google Scholar]
- 25.Batschelet E. Circular statistics in biology. Academic Press; London: 1981. [Google Scholar]
- 26.Whittaker P, Canham PB. Demonstration of quantitative fabric analysis of tendon collagen using two-dimensional polarized light microscopy. Matrix. 1991;11:56–62. doi: 10.1016/s0934-8832(11)80227-1. [DOI] [PubMed] [Google Scholar]
- 27.Whittaker P, Romano T, Silver MD, Boughner DR. An improved method for detecting and quantifying cardiac muscle disarray in hypertrophic cardiomyopathy. Am Heart J. 1989;118:341–346. doi: 10.1016/0002-8703(89)90195-6. [DOI] [PubMed] [Google Scholar]
- 28.Andreotti F, Sciahbasi A, De Marco E, Maseri A. Preinfarction angina and improved reperfusion of the infarct-related artery. Thromb Haemost. 1999;82 1:68–72. [PubMed] [Google Scholar]
- 29.Mills JD, Ariens RA, Mansfield MW, Grant PJ. Altered fibrin clot structure in the healthy relatives of patients with premature coronary artery disease. Circulation. 2002;106:1938–1942. doi: 10.1161/01.cir.0000033221.73082.06. [DOI] [PubMed] [Google Scholar]
- 30.Collet JP, Soria J, Mirshahi M, et al. Dusart syndrome: a new concept of the relationship between fibrin clot architecture and fibrin clot degradability: hypofibrinolysis related to an abnormal clot structure. Blood. 1993;82:2462–2469. [PubMed] [Google Scholar]
- 31.Lord ST. Fibrinogen and fibrin: scaffold proteins in hemostasis. Curr Opin Hematol. 2007;14:236–241. doi: 10.1097/MOH.0b013e3280dce58c. [DOI] [PubMed] [Google Scholar]
- 32.Ariens RA, Lai TS, Weisel JW, et al. Role of factor XIII in fibrin clot formation and effects of genetic polymorphisms. Blood. 2002;100:743–754. doi: 10.1182/blood.v100.3.743. [DOI] [PubMed] [Google Scholar]
- 33.Scott EM, Ariens RA, Grant PJ. Genetic and environmental determinants of fibrin structure and function: relevance to clinical disease. Arterioscler Thromb Vasc Biol. 2004;24:1558–1566. doi: 10.1161/01.ATV.0000136649.83297.bf. [DOI] [PubMed] [Google Scholar]
- 34.Liu W, Jawerth LM, Sparks EA, et al. Fibrin fibers have extraordinary extensibility and elasticity. Science. 2006;313:634. doi: 10.1126/science.1127317. [DOI] [PMC free article] [PubMed] [Google Scholar]
- 35.Guthold M, Liu W, Stephens B, et al. Visualization and mechanical manipulations of individual fibrin fibers suggest that fiber cross section has fractal dimension 1.3. Biophys J. 2004;87:4226–4236. doi: 10.1529/biophysj.104.042333. [DOI] [PMC free article] [PubMed] [Google Scholar]
- 36.Collet JP, Park D, Lesty C, et al. Influence of fibrin network conformation and fibrin fiber diameter on fibrinolysis speed: dynamic and structural approaches by confocal microscopy. Arterioscler Thromb Vasc Biol. 2000;20:1354–1361. doi: 10.1161/01.atv.20.5.1354. [DOI] [PubMed] [Google Scholar]
- 37.Bergmeier W, Chauhan AK, Wagner DD. Glycoprotein Ibα and von Willebrand factor in primary platelet adhesion and thrombus formation: lessons from mutant mice. Thromb Haemost. 2008;99:264–270. doi: 10.1160/TH07-10-0638. [DOI] [PubMed] [Google Scholar]
- 38.Cleuren AC, van Vlijmen BJ, Reitsma PH. Transgenic mouse models of venous thrombosis: fulfilling the expectations? Semin Thromb Hemost. 2007;33:610–616. doi: 10.1055/s-2007-985758. [DOI] [PubMed] [Google Scholar]
- 39.Cooley BC, Chen CY, Schmeling G. Increased venous versus arterial thrombosis in the Factor V Leiden mouse. Thromb Res. 2007;119:747–751. doi: 10.1016/j.thromres.2006.02.014. [DOI] [PubMed] [Google Scholar]
- 40.Przyklenk K, Whittaker P. Adaptation of a photochemical method to initiate recurrent platelet-mediated thrombosis in small animals. Lasers Med Sci. 2007;22:42–45. doi: 10.1007/s10103-006-0410-1. [DOI] [PubMed] [Google Scholar]
- 41.Day SM, Reeve JL, Myers DD, Fay WP. Murine thrombosis models. Thromb Haemost. 2004;92:486–494. [PubMed] [Google Scholar]