Abstract
We have developed an assay for the assembly of FtsZ based on fluorescence resonance energy transfer (FRET). We mutated an innocuous surface residue to cysteine and labeled separate pools with fluorescein (donor) and tetramethylrhodamine (acceptor). When the pools were mixed and GTP was added, assembly produced a FRET signal that was linearly proportional to FtsZ concentration from 0.7 μM (the critical concentration (Cc)) to 3 μM. At concentrations greater than 3 μM, an enhanced FRET signal was observed with both GTP and GDP, indicating additional assembly above this second Cc. This second Cc varied with Mg2+ concentration, whereas the 0.7 μM Cc did not. We used the FRET assay to measure the kinetics of initial assembly by stopped flow. The data were fit by the simple kinetic model used previously: monomer activation, a weak dimer nucleus, and elongation, although with some differences in kinetic parameters from the L68W mutant. We then studied the rate of turnover at steady state by pre-assembling separate pools of donor and acceptor protofilaments. When the pools were mixed, a FRET signal developed with a half-time of 7 s, demonstrating a rapid and continuous disassembly and reassembly of protofilaments at steady state. This is comparable with the 9-s half-time for FtsZ turnover in vivo and the 8-s turnover time of GTP hydrolysis in vitro. Finally, we found that an excess of GDP caused disassembly of protofilaments with a half-time of 5 s. Our new data suggest that GDP does not exchange into intact protofilaments. Rather, our interpretation is that subunits are released following GTP hydrolysis, and then they exchange GDP for GTP and reassemble into new protofilaments, all on a time scale of 7 s. The mechanism may be related to the dynamic instability of microtubules.
FtsZ, a homolog of tubulin, is the major protein of the bacterial cell division machine. Light microscopy shows that FtsZ assembles into a Z-ring that constricts to divide the cell. The Z-ring is highly dynamic in vivo. Subunits in the ring continuously exchange with a half-time of 8–9 s (1, 2). In vitro, FtsZ assembles into single-stranded protofilaments, which are thought to be the basic assembly unit making up the Z-ring.
We recently developed a tryptophan fluorescence assay for FtsZ assembly using the mutant FtsZ-L68W (3). The tryptophan fluorescence of this mutant increased 2.5-fold upon assembly. A major advantage of this assay is that it accurately reports total polymer, in contrast to centrifugation and light scattering, which underreport small polymers. The tryptophan fluorescence assay was used for a comprehensive study of the kinetics of initial assembly. The data were fit to a model involving a step of monomer activation and formation of a weak dimer nucleus followed by elongation steps that were thermodynamically more favorable.
The critical concentration (Cc) of the mutant FtsZ-L68W was 5–10-fold lower than that of wild-type FtsZ, meaning that it assembled with higher affinity. The mutant protein does, however, function normally for cell division, so we believe the basic assembly mechanism is the same as for wild-type FtsZ. Nevertheless, we felt it was important to study nucleation and elongation of a protein closer to wild type. We therefore designed a new fluorescence assay based on fluorescence resonance energy transfer (FRET). 1 The FRET assay requires two pools of subunits, one labeled with a donor fluorophore (fluorescein) and the other with an acceptor (tetramethylrhodamine (TMR)). When the subunits assemble into a protofilament, they will assort randomly, and a significant fraction of donors will be adjacent to an acceptor. The 4.3-nm spacing of subunits in the FtsZ protofilament (4) is smaller than the 5.0 –5.5-nm Förster distance of a fluorescein-TMR pair (5, 6), so the FRET signal should provide a direct measure of total subunits in polymer.
To label FtsZ for FRET, we constructed the mutant FtsZ-F268C, which introduces a single cysteine on the lower back right surface (7). F268C was originally identified as a mutant that was resistant to the division inhibitor SulA (8). It functions normally for cell division (8), and its rate of GTP hydrolysis is only slightly reduced (7). In the crystal structure of an FtsZ-SulA complex, it is seen that Phe-268 makes contact with SulA, consistent with the mutation blocking the binding of SulA (9). However, Phe-268 is ∼2 nm from the protofilament interface (10), so it should have minimal or no effect on protofilament assembly. Leu-68, in contrast, makes partial contact across the interface, and the larger tryptophan probably enhances assembly by contributing additional area to the interface.
In addition to providing a measure of the initial assembly kinetics, the FRET assay provides a novel approach to measure the dynamics of subunit turnover at steady state.
MATERIALS AND METHODS
Protein Purification
The mutant F268C of Escherichia coli FtsZ was overexpressed from a pET11b vector (Novagen). The protein was purified using the protocol of Romberg et al. (11) with some modifications. Following the 20% ammonium sulfate cut and 30% precipitation, the protein was chromatographed on a Resource Q 10/10 column (Amersham Biosciences) with a linear gradient of 50–500 mM KCl in 50 mM Tris, pH 7.9, 1 mM EDTA, 10% glycerol. Peak fractions were identified by SDS-PAGE and stored frozen at -80 °C.
Protein Labeling
Fluorescein-5-maleimide and tetramethylrhodamine-5-maleimide were purchased from Molecular Probes. FtsZ-F268C protein in 50 mM Tris, pH 7.9, 200 mM KCl was reacted with a 5-fold excess of probe for 2 h at room temperature. The protein was dialyzed against 50 mM Mes, pH 6.5, 2.5 mM MgAc, 1 mM EGTA to remove free probe, and KCl (KCl prevents the efficient pelleting of calcium polymers). Before each experiment, a cycle of calcium assembly-disassembly (12) was done to remove any inactive protein and remaining free probe. CaCl2 was added to 10 mM and GTP to 2 mM, and the reaction was incubated 5 min at 37 °C. The FtsZ polymer was collected by centrifugation at 45,000 rpm for 30 min (Beckman TLA100 rotor). The pellet was resuspended in the appropriate buffer at a protein concentration >100 μM. The sample was centrifuged again to remove any insoluble protein. The protein concentration was determined using a BCA assay (Pierce) and corrected for the 75% color ratio of FtsZ/BSA (13). To measure the TMR-labeled protein, the BCA assay was read at 655 nm instead of the usual 570 nm (where TMR absorbs).
The labeling efficiency was ∼60–90% for each fluorophore. Higher labeling should give a stronger FRET signal, but the exact ratio of fluorophore to FtsZ was not important for these measurements. Experimentally, we found that different ratios of the labels and variable amounts of unlabeled subunits gave different FRET levels, but the kinetics were the same. One experiment gave identical kinetics when one-half of the labeled protein was replaced with unlabeled FtsZ. This shows that the labeled FtsZ has similar assembly properties to unlabeled FtsZ.
Electron Microscopy Measurements
Negative stain electron microscopy was used to visualize FtsZ filaments. About 10 μl of FtsZ solution was incubated with GTP for several minutes and applied to a carbon-coated copper grid. Excess solution was blotted with filter paper, and the grid, held at a 50° angle, was rinsed with 3–4 drops of 2% uranyl acetate, blotted, and air-dried. Filaments were visualized and photographed using a Phillips 301 electron microscope at x50,000 magnification.
Fluorescence Measurement
FRET can be measured by the increase in acceptor fluorescence, the decrease in donor fluorescence, or the ratio. For the kinetic measurements, we wanted to measure at a single wavelength, and we chose the decrease in donor fluorescence, which gave a much stronger signal than the acceptor increase.
Steady-state fluorescence spectra were measured using a Shimadzu RF-5301 PC spectrofluorometer. The samples measured included donor only (FtsZ labeled with fluorescein plus unlabeled FtsZ equivalent to that with acceptor), donor plus acceptor FtsZ without GTP, and donor plus acceptor FtsZ with 200 μM GTP. The donor-acceptor ratio was ∼2:3. All samples were excited at 470 nm, and the fluorescence spectra were recorded from 480 to 650 nm. For kinetic measurements, donor emission was measured at 516 nm.
Stopped-flow measurements were made using an SLM-Aminco 8100 spectrofluorometer equipped with the SLM Milliflow reactor stopped-flow accessory. The temperature was controlled at 25 °C. The donor fluorescence was excited at 470 nm, and the emission intensity was monitored at 516 nm, both with a 4-nm slit. The protein concentration was initially calculated based on the dilution and was adjusted so that the initial fluorescence values fell on a straight line.
For measurements of assembly kinetics, the FtsZ donor and acceptor were mixed at a ratio of 2:3 and then rapidly mixed with an equal volume of 500 μM GTP to initiate the reaction. To measure the rate of subunit exchange at steady state, donor FtsZ and acceptor FtsZ at 3–10 μM were first assembled separately by adding 1 mM GTP, and then these two pools were rapidly mixed and exchanged.
Most assembly experiments were done in MMK buffer (50 mM Mes, 100 mM KAc, 5 mM MgAc, 1 mM EGTA, pH 6.5). Two other buffers, HMK (50 mM Hepes, pH 7.7, 100 mM KAc, 5 mM MgAc, 1 mM EGTA) and MEK (50 mM Mes, 100 mM KAc, 2.5 mM EDTA, 1 mM EGTA, pH 6.5), were used as noted.
Kinetic Modeling
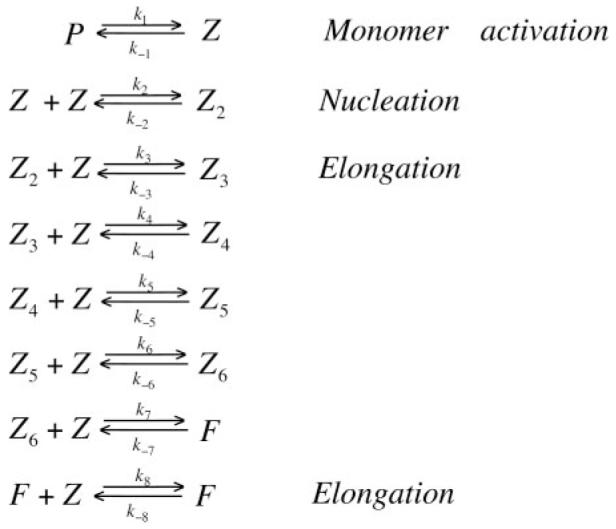
The FtsZ assembly kinetics data were fitted using the minimal kinetic model described previously (3). Three steps followed the addition of GTP to FtsZ: activation of the FtsZ monomer, formation of a dimer nucleus, and elongation (Scheme I). (Note that the kinetic constants for the elongation steps (k3—k8) are all identical, except k-7, which is set to zero; see Ref. 3 for the rationale.) The kinetic data were fit using the programs KINSIM40 and FITSIM40 (14-17).
Scheme I.
RESULTS
The Critical Concentration of FtsZ-F268C Determined by the FRET Assay
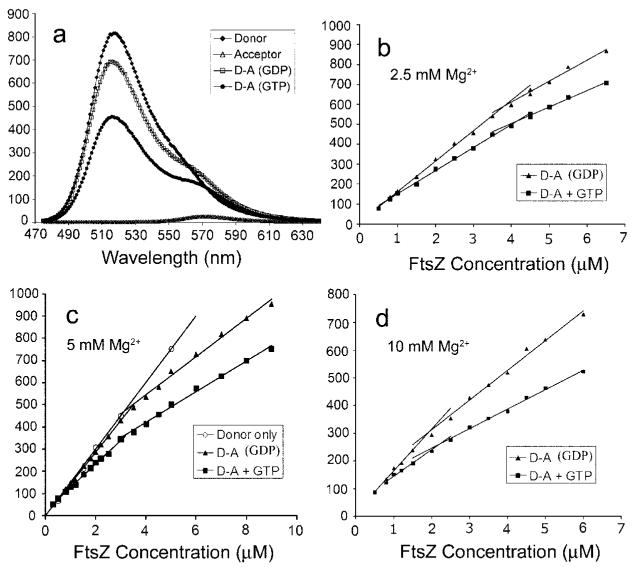
When donor (fluorescein) FtsZ co-assembles with acceptor (TMR) FtsZ, the donor fluorescence should decrease and acceptor fluorescence should increase. We found that the donor fluorescence at 516 nm decreased up to 40% when 6 μM FtsZ (mixed donor and acceptor) was induced to assemble by adding GTP (Fig. 1a). Acceptor fluorescence at 575 nm showed a corresponding increase, but this was a smaller signal. Moreover, fluorescence at 575 nm is complicated by a substantial contribution from donor emission, which decreases because of FRET and subtracts from the acceptor increase. We have therefore used the decrease in donor fluorescence as the best FRET signal.
Fig. 1. FRET assay of FtsZ assembly.
a, the spectra of donor only, acceptor only, donor-acceptor (D-A) without GTP, and donor-acceptor with GTP. FtsZ was at 6 μM, and spectra were recorded 5 min after mixing. b—d, the donor fluorescence of FtsZ recorded at 516 nm is plotted versus the concentration of FtsZ. The three curves show different concentrations of Mg2+: 2.5 mM (b), 5mM (c), and 10 mM (d).
We plotted the donor fluorescence versus FtsZ concentration for donor only, donor-acceptor without GTP, and donor-acceptor with GTP. At concentrations <0.7 μM, the three curves superimposed, meaning there was no FRET and no assembly. When concentrations were >0.7 μM, the GTP curve showed a decrease in donor fluorescence that was linear with FtsZ concentration. This indicates a Cc of 0.7 μM for the GTP assembly in the lower concentration range.
There was, however, a surprising observation that at FtsZ concentrations >3 μM, a FRET signal developed simply from mixing the donor and acceptor FtsZ without any GTP. We assumed that the FtsZ carries a stoichiometric amount of GDP (following assembly and disassembly in Ca2+), and we found that adding excess GDP did not change the curve, so we refer to this as GDP-mediated assembly. This FRET signal only occurred at concentrations of >3 μM total FtsZ (at the 5 mM Mg2+ in our standard MMK buffer) (Fig. 1c). The FRET signal appeared to be linear above 3 μM, suggesting that it is reporting a second cooperative assembly with a 3 μM Cc. This Cc, dependent on the concentration of Mg2+, was 4, 3, or 2 μM in 2.5, 5, and 10 mM Mg2+, respectively (Fig. 1, b-d). In the absence of Mg2+, we found no FRET signal up to 10 μM FtsZ. We show results for MMK, pH 6.5, but very similar curves were obtained in HMK (pH 7.7), with a Cc of 4.2 μM in 5 mM Mg2+ (not shown).
Even more surprising, the curves for GTP assembly showed a second break at the same Cc for each Mg2+ concentration, suggesting that GTP assembly is characterized by two Ccs. We used electron microscopy (EM) to look for a structural basis for the enhanced FRET at the higher concentrations. EM showed apparently normal, single protofilaments at 2 μM FtsZ (Fig. 2a). Fig. 2c shows the distribution of protofilament lengths, with an average of about 120 nm or 30 subunits. The distribution of filament lengths was virtually identical at 10 μM FtsZ, although at the higher concentration, some protofilaments further associated into pairs and small bundles (Fig. 2b). This distribution is addressed under “Discussion.”
Fig. 2.
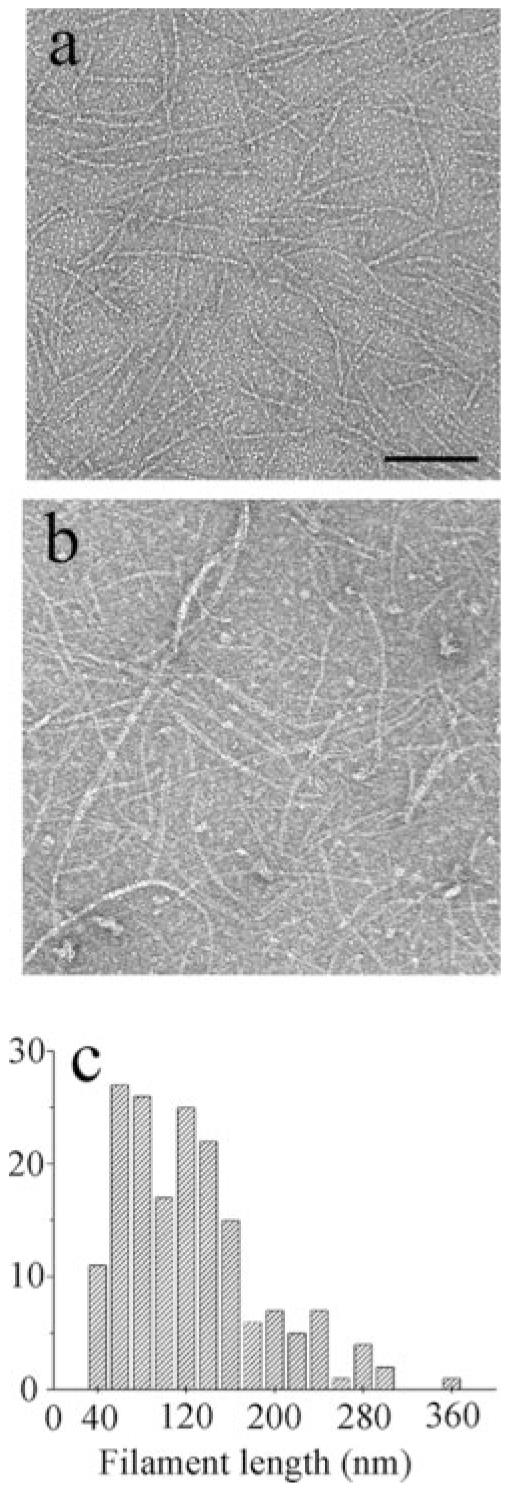
a and b, negatively stained EM images are shown of FtsZ-F268C at 2 μM (a) and 10 μM (b) in MMK buffer following 3 min of assembly. Protofilaments are almost all single-stranded at 2 μM, but at 10 μM, some are associated in pairs or small bundles (bar = 100 nm). C, the length distribution of FtsZ filaments assembled as in a is shown. The majority of filaments are in the range of ∼80–160 nm or ∼20–40 subunits.
FtsZ Assembly Kinetics Measured by FRET
Fig. 3 shows the kinetics of assembly when the FtsZ donor-acceptor mixture was mixed with 0.5 mM GTP in MMK buffer using a stopped-flow device. All assembly curves showed a lag of 2–3 s, a decrease over 6–10 s, and finally a plateau. The assembly kinetics curves from 0.8 to 3 μM were fit to the kinetic model in Scheme I using the programs KINSIM40 and FITSIM40. Because the FRET signals are complicated by the GDP-mediated oligomerization at a higher concentration, we did not include data over 3 μM in the fitting. These kinetics were fit to the same scheme as the kinetics of FtsZ-L68W, namely a weak dimer nucleus followed by elongation. The major difference was a much weaker dimer nucleus, which is discussed below (Table I).
Fig. 3. The kinetics of FtsZ initial assembly detected by FRET.
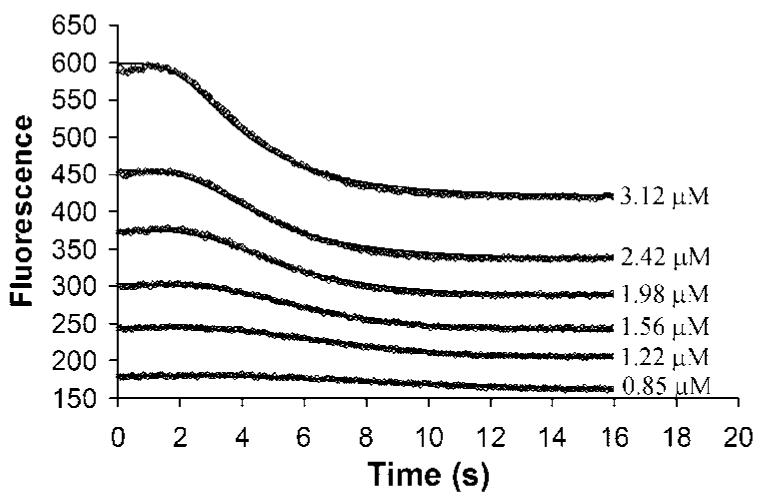
Assembly was initiated in the stopped-flow device by mixing with GTP, giving the indicated concentrations of FtsZ. The solid lines show the fitting to the dimer nucleation model.
TABLE I. FtsZ assembly rate constants in two different buffers.
Both buffers contain Mg2+, and they differ in pH. The rates from the present FRET assay are compared with those obtained previously for FtsZ-L68W. k1 and k-1 are the parameters for monomer activation, k2 and k-2 are for formation of the dimer nucleus, and ke and k-e are for elongation.
| Protein | Buffer | k1 | k-1 | k2 | ke | k-2 | k-e | k-2/k2 | k-e/ke |
|---|---|---|---|---|---|---|---|---|---|
| s-1 | s-1 | μM-1 s-1 | μM-1 s-1 | s-1 | s-1 | μM | μM | ||
| FtsZ-F268C | HMK | 0.38 | 0.01 | 0.72 | 6.63 | 199.6 | 4.0 | 277.2 | 0.60 |
| MMK | 0.38 | 0.01 | 0.79 | 6.60 | 199.8 | 3.48 | 252.9 | 0.53 | |
| FtsZ-L68W | HMK | 0.70 | 0.04 | 1.02 | 3.61 | 1.23 | 0.36 | 1.21 | 0.10 |
| MMK | 0.76 | 0.11 | 0.62 | 3.01 | 0.30 | 0.60 | 0.47 | 0.20 |
Assembly kinetics in HMK buffer at pH 7.7 were almost identical to the kinetics in MMK at pH 6.5 (Table I). We also measured the kinetics of the GDP assembly by mixing separate pools of donor and acceptor at 10 μM. The donor fluorescence decreased rapidly and was at a plateau in 200 ms.
Rapid Steady-state Subunit Turnover
We used the FRET assay to measure the rate of protofilament turnover at steady state. For this step, we first assembled donor FtsZ and acceptor FtsZ separately. These assembled pools were then mixed rapidly in the stopped-flow device, and the FRET signal was measured as the decrease in donor fluorescence. This FRET signal requires that the subunits disassemble from the separately labeled protofilaments and reassemble into mixed donor-acceptor protofilaments. In MMK buffer, the donor fluorescence decreased rapidly to a plateau (Fig. 4a). The data were fit well by a single exponential, F = Feq + α·e-t/τ. The reaction time τ was 9.3 s, which corresponds to a half-time of 7 s. At steady state, protofilament disassembly must be balanced by reassembly of new protofilaments, so this number measures the rate of each reaction. Thus this experiment shows that all protofilaments are disassembling and reassembling on the time scale of 9 s. The turnover rate was essentially the same for FtsZ concentrations from 3 to 10 μM. The fluorescence decrease was 30%, essentially the same as the 33% decrease for the initial assembly. This means that the turnover involved complete disassembly and reassembly of all protofilaments.
Fig. 4. The kinetics of subunit exchange when pools of preassembled donor and acceptor FtsZ protofilaments were mixed in 5mM Mg2+ (a) or in 2.5 mM EDTA (b).
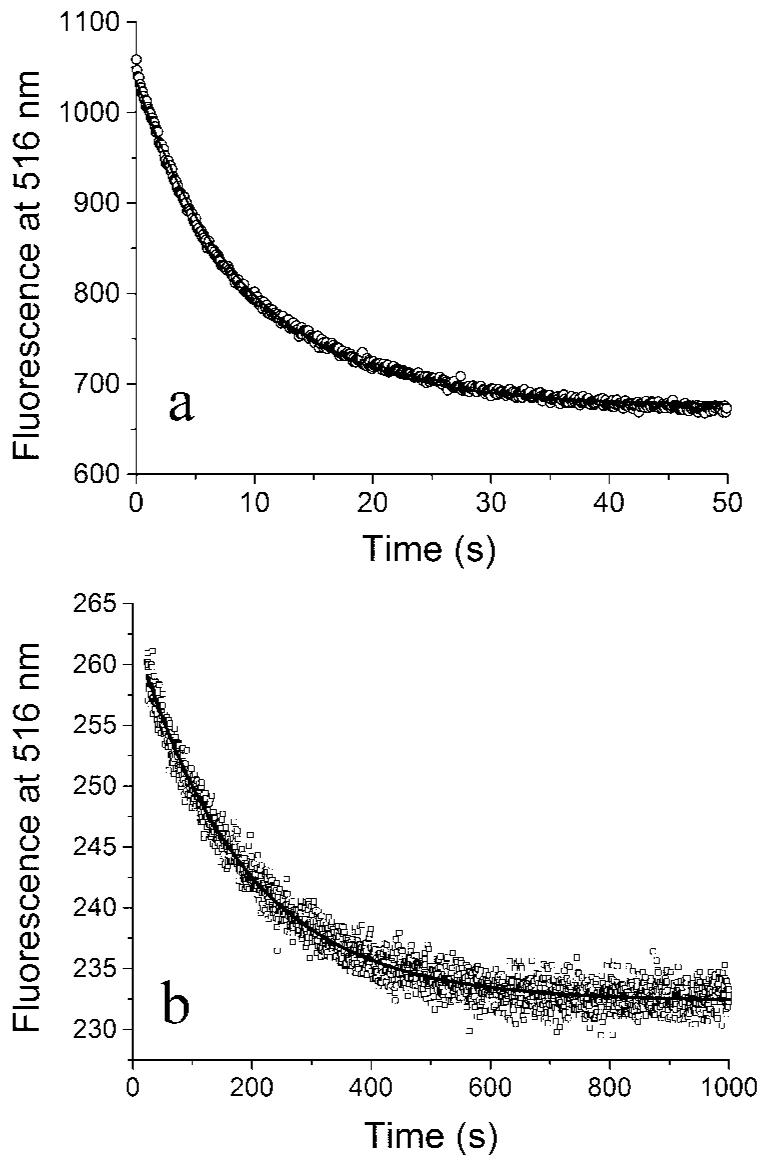
Note the longer time scale in b. The curves are fits with a single exponential (decay constant 9.3 and 127 s with and without Mg2+). FtsZ was at 6 μM.
To examine the turnover rate in the absence of GTP hydrolysis, we repeated the experiment in MEK buffer, where the chelation of Mg2+ permits protofilament assembly but blocks GTP hydrolysis (3, 18). After the mixing, the donor fluorescence decreased, and again the decrease could be fit to a single exponential (Fig. 4b). However, there were two differences from the assembly in Mg2+. First, the final decrease in fluorescence was only 12% in EDTA versus 30% in Mg2+. This suggests that only about one-third of the subunits participate in exchange in EDTA. Second, the reaction time was 127 s in EDTA versus 9.3 s in Mg2+. We believe the exchange in EDTA is consistent with reversible dissociation and re-association of subunits at the protofilament ends, with no turnover in the middle.
Finally, we repeated the mixing experiment with protofilaments assembled in 0.2 mM GMP-CPP. In this case, the mixing appeared to approach completion, but the reaction time was increased to 350 s. This is consistent with the previous observation that GMP-CPP is hydrolyzed 3–10-fold more slowly than GTP (11).
Rate of FtsZ Depolymerization with Added Excess GDP
Excess GDP can cause FtsZ depolymerization. To observe the kinetics of disassembly, we first assembled 3–10 μM mixed FtsZ (ratio of donor to acceptor was 1:1) in 100 μM GTP. GDP was added to 2 mM, and the sample was rapidly mixed by pipette. Fig. 5, a and b, shows the time course of donor fluorescence increase as the protofilaments disassembled. The reaction time for the exponential fit was 6 ± 1 s in MMK buffer (Fig. 5a) and 25 ± 5 s in MEK buffer (Fig. 5b).
Fig. 5. The disassembly kinetics of FtsZ polymer following the addition of excess GDP.
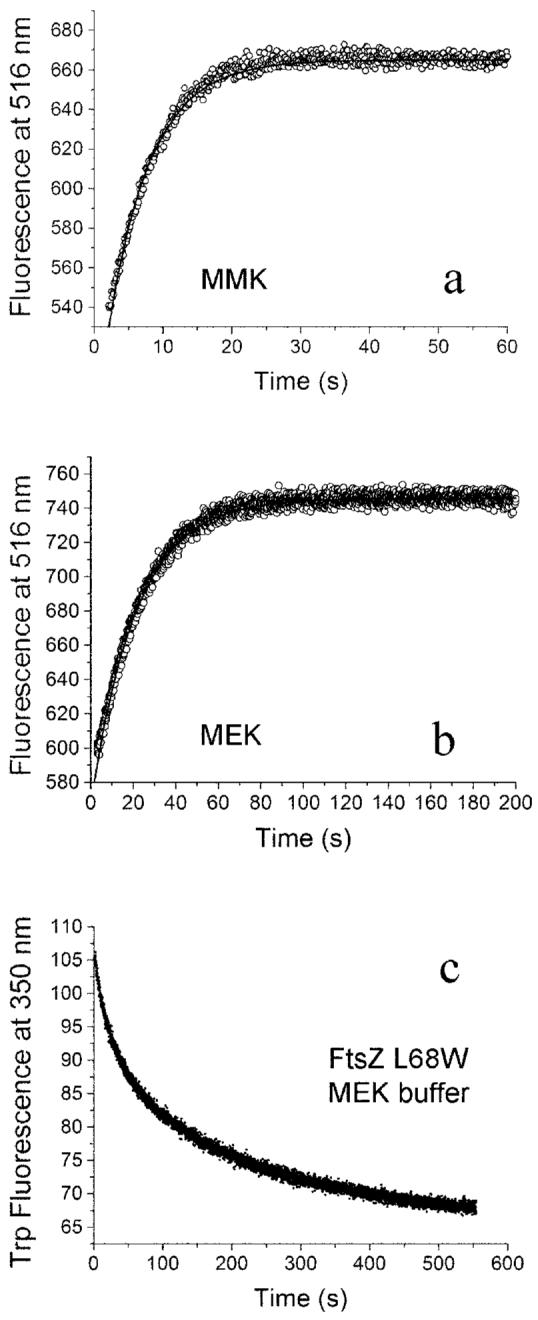
a, in MMK buffer, the decay constant for disassembly is 6 s. b, in MEK buffer, the decay constant for disassembly is 21 s. c, the disassembly of FtsZ-L68W assayed by the decrease in tryptophan fluorescence. The average decay constant is ∼120 s. FtsZ was at 6 μM.
We also examined the disassembly of the tryptophan mutant, FtsZ-L68W, monitoring the change in tryptophan fluorescence (Fig. 5c). The average lifetime of this decay was about 8 s in MMK buffer and 125 s in MEK buffer. The slower disassembly of L68W in MEK buffer is consistent with the 5–10-fold lower k-e of L68W relative to F268C, but it could also reflect differences in filament length.
We checked the effect of adding smaller amounts of GDP to protofilaments. In MEK buffer with 200 μM GTP, the addition of 100 and 200 μM GDP caused disassembly of 40 and 60% of the polymer. In MMK buffer, 200 μM GDP caused disassembly of 30% of the polymer. If we assume that GTP and GDP compete for binding and that subunits are inactivated when they have bound GDP, these results suggest that the affinity of FtsZ is somewhat higher for GDP in EDTA and somewhat higher for GTP in Mg2+ buffer. This is very different from tubulin, where the affinity for GDP is ∼3-fold lower than for GTP in Mg2+ and GTP binding is hardly measurable in EDTA (19).
DISCUSSION
Kinetics and Steady-state Assembly in GTP
The kinetics of initial assembly measured here by FRET were fit to the same model (Scheme I) used to fit the assembly of the tryptophan mutant, FtsZ-L68W (3). The model involves a step of monomer activation (probably the time needed for release of the initially bound GDP), the formation of a weak dimer nucleus, and a stronger association-giving elongation.
One concern in the previous study was that the Cc of the L68W mutant was about 5–10-fold smaller than that of wild-type FtsZ. The labeled protein used for the present FRET assay showed a Cc of 0.7 μM in steady-state measurements (Fig. 1, b—d) and 0.5–0.6 μM from kinetics (k-e/ke, Table I). This is very close to the Ccs of 0.9–1.25 μM measured by sedimentation for wild-type FtsZ (3) and 0.5 μM from GTPase (20). Furthermore, adding an equal amount of unlabeled FtsZ reduced the magnitude of the FRET signal but did not change the kinetics of assembly (not shown). Thus we believe that the assembly of labeled F268C is essentially identical to that of wild-type FtsZ.
The kinetic constants for F268C and L68W are compared in Table I. The interpretation of the kinetic constants is discussed in detail by Chen et al. (3). The major difference is that the dimer nucleus is much weaker for F268C than for L68W assembly. The KD for the dimer, given by k—2/k2, is about 500-fold larger than the KD for elongation, k–e/ke for F268C, versus only a 2.5–10-fold difference for L68W in Mg2+ buffers. Thus the kinetic evidence for a cooperative assembly is even stronger than it was for L68W. As discussed in more detail by Chen et al. (3), we still have no mechanism to explain how a protofilament that is 1 subunit thick can exhibit the characteristics of cooperative assembly and a dimer nucleus.
The plot of the steady-state FRET signal versus FtsZ concentration gave the expected results in MMK for FtsZ concentrations up to 3 μM (in our standard buffer with 5 mM Mg2+). Below the Cc of ∼0.7 μM, there was no FRET signal, and above this Cc, the donor fluorescence showed a linear decrease from 0.7 to 3 μM FtsZ. This FRET signal indicates a GTP-mediated assembly, which we interpret to be the straight, single-stranded protofilaments seen in Fig. 2a and in previous EM studies. It should be noted that this Cc for GTP assembly was about 0.7 μM at all Mg2+ concentrations (from 2.5 to 10 mM), implying that this assembly does not involve binding of additional Mg2+.
As we pointed out previously (3), the simple model used to fit the kinetic data ignores the role of GTP hydrolysis. Because hydrolysis occurs only slowly following entry of a subunit into the protofilament (20), the nucleation and initial elongation phases should not be affected. At steady state, however, the apparent k-e, which determines the apparent Cc, will mostly be because of dissociation of subunits following GTP hydrolysis, with a smaller contribution from dissociation of FtsZ-GTP. Unfortunately, at the present time we do not know where to place GTP hydrolysis in a kinetic scheme, so the mechanism must remain incomplete. Our confidence in the overall scheme, and in particular the dimer nucleus, is supported by our previous study of assembly in EDTA, which demonstrated similar cooperative assembly without the complication of GTP hydrolysis (3).
A Second Critical Concentration
An important new discovery of the FRET assay is a Mg2+-sensitive assembly pathway with a second Cc. FtsZ-GDP showed an abrupt and linear FRET signal (decrease in donor fluorescence) above 3 μM FtsZ (in 5 mM Mg2+). Sedimentation studies have already demonstrated an assembly of FtsZ-GDP into dimers and small oligomers (21, 22), and this assembly was Mg2+-dependent, similar to our results with the FRET assay. A major difference between our results and the previous sedimentation assays is that we found an abrupt transition to assembly above a Cc, whereas the previous studies were interpreted as a gradual isodesmic assembly. The Cc implies that assembly in GDP is cooperative, not isodesmic. We suggest that the sedimentation results might be reinterpreted as a cooperative assembly, with all subunits above the Cc incorporated into small oligomers of a similar length.
Remarkably, the second Cc was not just a phenomenon of GDP-mediated assembly but was also observed in all curves for GTP assembly. This second decrease in slope always occurred at the same Cc that was observed for GDP assembly. One possibility for this second step of GTP assembly is that it represents bundling of protofilaments. Indeed our EM analysis did show some bundling at higher protein concentrations. However, there are several problems with this interpretation. First, even at 10 μM FtsZ, the large majority of protofilaments are not bundled. Second, it is difficult to understand why bundling would exhibit a Cc, rather than a more gradual concentration dependence. Third, there is no explanation as to why this second Cc was the same in GDP and in GTP assembly. At present, we do not understand the mechanism of this second step of cooperative assembly.
No such additional break was seen in our previous study using the tryptophan fluorescence of L68W. This is understandable because the tryptophan fluorescence change is mediated only by the longitudinal contacts within the protofilament and is not likely to be affected by lateral association. The discovery of this second association was only possible with the FRET assay.
Steady-state Polymer Dynamics
A second important use of the FRET assay was to investigate assembly dynamics at steady state. This was not possible with any previous assay, including tryptophan fluorescence. We mixed preformed protofilaments labeled separately with donor and acceptor and found that they developed a FRET signal with a half-time of 7 s. This means that the pre-assembled protofilaments are completely disassembling and reassembling with this rapid half-time. This is very close to the 8–9 s half-time for FtsZ turnover in the Z-ring in vivo (2) and also to the rate of GTP hydrolysis in vitro (8/min in MMK (20) and 14/min in HMK (23)). This agreement of the turnover kinetics suggests that in vitro assembly is indeed close to the in vivo reaction, and both appear to be regulated by GTP hydrolysis.
This turnover rate implies a balance of protofilament disassembly and reassembly. We decided to test it further by looking at one side of the turnover, disassembly. To rapidly block assembly, we added an excess of GDP, which should replace the GTP on all free monomers and block their assembly into new protofilaments. As monomers disassemble, they presumably already have a bound GDP, and the excess prevents them from getting a GTP. The disassembly was somewhat faster than the steady-state turnover time, with a half-time of 5 s versus 7 s for turnover. This would be expected if the concurrent reassembly sometimes rescued protofilaments that would otherwise disassemble completely. This disassembly rate is also consistent with the k-e = 3.5 s-1 that we obtained from kinetics data (Table I). At this rate, a protofilament of the average length of 30 subunits would disassemble completely in 8.5 s.
The GDP-induced disassembly also addresses the issue of whether nucleotide can exchange within a protofilament. It was suggested previously that this might be possible and necessary to explain the high turnover rate of GTP hydrolysis (24). Recently a crystal structure of an FtsZ dimer showed a gap in the interface that might permit nucleotide exchange (10). We now believe that this is unlikely for three reasons. 1) Our new data show that the turnover rate of subunits at steady state (half-time, 7 s) is fully fast enough to accommodate GTP hydrolysis (8/min = 7.5 s/GTP hydrolyzed). 2) When we suddenly added excess GDP to assembled protofilaments, it caused disassembly with a half-time of 5 s, fully consistent with the normal disassembly rate during turnover. 3) When we added GDP to protofilaments assembled in EDTA, they disassembled at a much slower rate, consistent with their slower turnover. If GDP could displace GTP in assembled protofilaments, this should happen on a faster time scale, probably equivalent to the 1–3-s lag seen in the initial assembly kinetics. Overall, our data suggest a model wherein subunits need to disassemble to exchange the GDP for GTP and initiate a new round of assembly. This is similar to the mechanism of tubulin turnover.
This turnover rate also correlates nicely with the measured lengths of protofilaments. EM showed protofilaments averaging about 30 subunits (Fig. 2c). The initial assembly kinetics for elongation are diffusion-limited, with ke = 6.6 μM-1s-1 (Table I). At steady state, the free monomer concentration should be 0.7 μM, so monomers can add to the protofilament at a rate of 6.6 × 0.7 = 4.6 s-1. A protofilament that is 30 subunits long could therefore be assembled in 6.5 s. Longer protofilaments would not be possible with the observed turnover rate. The Z-ring in vivo, which has a circumference of ∼3,000 nm, shows the same turnover rate. We conclude that the Z-ring is built from overlapping segments of short protofilaments ∼120 nm in length.
We found that the distribution of protofilament lengths was the same at 2 and 10 μM total FtsZ. This independence of protofilament length on FtsZ concentration is expected from the rapid turnover. After 1–2 min of assembly, every protofilament will have turned over several times. Importantly, every reassembly will occur from the pool of free subunits at a concentration of 0.7 μM. Thus, higher concentrations of total FtsZ will produce more protofilaments of the same length.
Finally, the in vitro experiment provides new insight on the in vivo exchange into the Z-ring. The exchange in vivo could have been because of exchange of individual subunits or of whole protofilaments. The in vitro FRET experiment can only be explained by exchange of subunits, probably by dissociation and reassociation at protofilament ends. This suggests that the in vivo exchange, which has the same half-time, also occurs by exchange of individual subunits.
In conclusion, we suggest speculatively that the rapid assembly dynamics may operate by a mechanism related to dynamic instability of microtubules. Novel experimental approaches may be needed to explore the mechanism. The FRET assay described here provides one new tool for these future experiments.
Footnotes
This work was supported by National Institutes of Health Grant GM66014. The costs of publication of this article were defrayed in part by the payment of page charges. This article must therefore be hereby marked “advertisement” in accordance with 18 U.S.C. Section 1734 solely to indicate this fact.
- FRET
- fluorescence resonance energy transfer
- TMR
- tetramethylrhodamine
- Mes
- 4-morpholineethanesulfonic acid
- EM
- electron microscopy
- GMP-CPP
- guanosine 5′-(α,β-methylene)triphosphate.
REFERENCES
- 1.Stricker J, Maddox P, Salmon ED, Erickson HP. Proc. Natl. Acad. Sci. U. S. A. 2002;99:3171–3175. doi: 10.1073/pnas.052595099. [DOI] [PMC free article] [PubMed] [Google Scholar]
- 2.Anderson DE, Gueiros-Filho FJ, Erickson HP. J. Bacteriol. 2004;186:5775–5781. doi: 10.1128/JB.186.17.5775-5781.2004. [DOI] [PMC free article] [PubMed] [Google Scholar]
- 3.Chen Y, Bjornson K, Redick SD, Erickson HP. Biophys. J. 2005;88:505–514. doi: 10.1529/biophysj.104.044149. [DOI] [PMC free article] [PubMed] [Google Scholar]
- 4.Erickson HP, Stoffler D. J. Cell Biol. 1996;135:5–8. doi: 10.1083/jcb.135.1.5. [DOI] [PMC free article] [PubMed] [Google Scholar]
- 5.Corbalan-Garcia S, Teruel JA, Gomez-Fernandez JC. Eur. J. Biochem. 1993;217:737–744. doi: 10.1111/j.1432-1033.1993.tb18300.x. [DOI] [PubMed] [Google Scholar]
- 6.Glauner KS, Mannuzzu LM, Gandhi CS, Isacoff EY. Nature. 1999;402:813–817. doi: 10.1038/45561. [DOI] [PubMed] [Google Scholar]
- 7.Lu C, Stricker J, Erickson HP. BMC Microbiol. 2001;1:7. doi: 10.1186/1471-2180-1-7. [DOI] [PMC free article] [PubMed] [Google Scholar]
- 8.Bi E, Lutkenhaus J. J. Bacteriol. 1990;172:5602–5609. doi: 10.1128/jb.172.10.5602-5609.1990. [DOI] [PMC free article] [PubMed] [Google Scholar]
- 9.Cordell SC, Robinson EJ, Lowe J. Proc. Natl. Acad. Sci. U. S. A. 2003;100:7889–7894. doi: 10.1073/pnas.1330742100. [DOI] [PMC free article] [PubMed] [Google Scholar]
- 10.Oliva MA, Cordell SC, Lowe J. Nat. Struct. Mol. Biol. 2004;11:1243–1250. doi: 10.1038/nsmb855. [DOI] [PubMed] [Google Scholar]
- 11.Romberg L, Simon M, Erickson HP. J. Biol. Chem. 2001;276:11743–11753. doi: 10.1074/jbc.M009033200. [DOI] [PubMed] [Google Scholar]
- 12.Yu XC, Margolin W. EMBO J. 1997;16:5455–5463. doi: 10.1093/emboj/16.17.5455. [DOI] [PMC free article] [PubMed] [Google Scholar]
- 13.Lu C, Erickson HP. Methods Enzymol. 1998;298:305–313. doi: 10.1016/s0076-6879(98)98027-2. [DOI] [PubMed] [Google Scholar]
- 14.Barshop BA, Wrenn RF, Frieden C. Anal. Biochem. 1983;130:134–145. doi: 10.1016/0003-2697(83)90660-7. [DOI] [PubMed] [Google Scholar]
- 15.Zimmerle CT, Frieden C. Biochem. J. 1989;258:381–387. doi: 10.1042/bj2580381. [DOI] [PMC free article] [PubMed] [Google Scholar]
- 16.Frieden C. Methods Enzymol. 1994;240:311–322. doi: 10.1016/s0076-6879(94)40053-9. [DOI] [PubMed] [Google Scholar]
- 17.Dang Q, Frieden C. Trends Biochem. Sci. 1997;22:317. doi: 10.1016/s0968-0004(97)01062-1. [DOI] [PubMed] [Google Scholar]
- 18.Mukherjee A, Lutkenhaus J. J. Bacteriol. 1999;181:823–832. doi: 10.1128/jb.181.3.823-832.1999. [DOI] [PMC free article] [PubMed] [Google Scholar]
- 19.Correia JJ, Baty LT, Williams RC., Jr. J. Biol. Chem. 1987;262:17278–17284. [PubMed] [Google Scholar]
- 20.Romberg L, Mitchison TJ. Biochemistry. 2004;43:282–288. doi: 10.1021/bi035465r. [DOI] [PubMed] [Google Scholar]
- 21.Sossong TM, Brigham-Burke MR, Hensley P, Pearce KH. Biochemistry. 1999;38:14843–14850. doi: 10.1021/bi990917e. [DOI] [PubMed] [Google Scholar]
- 22.Rivas G, Lopez A, Mingorance J, Ferrandiz MJ, Zorrilla S, Minton AP, Vicente M, Andreu JM. J. Biol. Chem. 2000;275:11740–11749. doi: 10.1074/jbc.275.16.11740. [DOI] [PubMed] [Google Scholar]
- 23.Redick SD, Stricker J, Briscoe G, Erickson HP. J. Bacteriol. 2005;187:2727–2736. doi: 10.1128/JB.187.8.2727-2736.2005. [DOI] [PMC free article] [PubMed] [Google Scholar]
- 24.Mingorance J, Rueda S, Gomez-Puertas P, Valencia A, Vicente M. Mol. Microbiol. 2001;41:83–91. doi: 10.1046/j.1365-2958.2001.02498.x. [DOI] [PubMed] [Google Scholar]
- 25.Scheffers DJ, Den Blaauwen T, Driessen AJM. Mol. Microbiol. 2000;35:1211–1219. doi: 10.1046/j.1365-2958.2000.01791.x. [DOI] [PubMed] [Google Scholar]
- 26.Mukherjee A, Saez C, Lutkenhaus J. J. Bacteriol. 2001;183:7190–7197. doi: 10.1128/JB.183.24.7190-7197.2001. [DOI] [PMC free article] [PubMed] [Google Scholar]


