

Abstract
The auditory system can segregate sounds that overlap in time and frequency, if the sounds differ in acoustic properties such as fundamental frequency (f0). However, the neural mechanisms that underlie this ability are poorly understood. Responses of neurons in the inferior colliculus (IC) of the anesthetized chinchilla were measured. The stimuli were harmonic tones, presented alone (single harmonic tones) and in the presence of a second harmonic tone with a different f0 (double harmonic tones). Responses to single harmonic tones exhibited no stimulus-related temporal pattern, or in some cases, a simple envelope modulated at f0. Responses to double harmonic tones exhibited complex slowly modulated discharge patterns. The discharge pattern varied with the difference in f0 and with characteristic frequency. The discharge pattern also varied with the relative levels of the two tones; complex temporal patterns were observed when levels were equal, but as the level difference increased, the discharge pattern reverted to that associated with single harmonic tones. The results indicated that IC neurons convey information about simultaneous sounds in their temporal discharge patterns and that the patterns are produced by interactions between adjacent components in the spectrum. The representation is “low-resolution,” in that it does not convey information about single resolved components from either individual sound.
INTRODUCTION
Humans and nonhuman animals rarely process sounds in isolation; most listening is done in environments in which multiple sound-generating objects are present. In these situations, the signals generated by any number of simultaneous sound sources add linearly and arrive at each of the listener's ears as a single waveform whose spectrum includes all the components associated with all the sources. Even though the waveforms produced by separate sounds overlap in time and in frequency, the normal auditory system is able to segregate information arising from the individual sources so that the original sound-generating objects are accurately perceived. Segregation is part of the process described by terms such as auditory scene analysis (Bregman 1990) or sound-source determination (Yost 1993; Yost and Sheft 1993).
Several acoustic parameters or regularities may be exploited by the auditory system to accomplish sound source determination (Carlyon 2004; Darwin 2005; Darwin and Carlyon 1995; Yost 1993; Yost and Sheft 1993). One powerful cue is derived from harmonic structure; simultaneous periodic sounds that differ in fundamental frequency (f0) are more easily segregated than sounds that have the same f0. The use of f0 differences to segregate sounds has most often been studied by asking listeners to identify steady-state vowels presented simultaneously; the availability of the vowel label makes it easy for the listeners to report which sounds were heard. Vowels with the same f0 can be identified at levels greater than chance, but the introduction of small differences in f0, on the order of 1-6% (~1 semitone), leads to rapid improvement in identification accuracy. Differences in f0 >6% produce little or no additional improvement (Assmann and Summerfield 1989, 1990; Chalikia and Bregman 1989, 1993; Culling and Darwin 1994; de Cheveigné 1997, 1999). A difference in f0 also makes ongoing speech more intelligible in the presence of a competing voice (Brokx and Nooteboom 1982). Listeners can also use small differences in f0 to segregate pairs of nonspeech harmonic complex tones presented simultaneously (Carlyon and Shackleton 1994; Chalikia and Bregman 1989), although segregation of nonspeech harmonic sounds has been studied less often.
The neural mechanisms that underlie the ability to segregate sounds that differ in f0 are only beginning to be understood. Most previous studies have taken one of two approaches to addressing these mechanisms: one that provides insight into how acoustic properties of simultaneous sounds are encoded and another that seeks to identify changes in brain activity that indicate that segregation has been accomplished.
The first approach makes use of measurements of the responses of neurons at lower levels of the auditory system. Palmer (1990) examined the representation of simultaneous vowels with different f0s in the responses of auditory nerve fibers. That stimulus will be referred to here as a “double vowel,” and the spectrum of the double vowel will be referred to as the “composite spectrum.” Palmer reported that the pattern of synchronized responses provided precise and extensive information about the f0s and spectral profiles of the double vowels. Components from each individual vowel could be identified in the population synchronized response. Individual auditory nerve fibers tended to synchronize to large components in the composite spectrum, as they do in response to single vowels (Delgutte 1984; Young and Sachs 1979) and consonant-vowel syllables (Sinex and Geisler 1983). However, an auditory nerve fiber that responded to a component from one vowel at a moderate signal level could respond to a component from the other vowel when level was changed. Palmer noted that, although temporal discharge patterns provided much information about the stimulus spectrum, the data did not provide any basis for drawing conclusions about the way that information would be used by central neurons or circuits.
Responses of primarylike and chopper neurons in the ventral cochlear nucleus to double vowels were obtained by Keilson et al. (1997). A set of double vowels was synthesized and presented with systematic frequency shifts to simulate the responses of neurons with a greater range of characteristic frequencies (CFs) than could be studied directly. Primarylike neurons represented spectral information, including f0, in discharge synchrony, as was also the case in the experiment of Palmer (1990). Chopper neurons, in contrast, encoded the composite spectrum in the profile of average discharge rate, as they have been shown to do for single vowels (Blackburn and Sachs 1990). Chopper neurons did exhibit synchrony, but it was almost exclusively to f0 and not to the higher-frequency components whose relative amplitudes define the vowel. The particular f0 to which a chopper neuron synchronized varied with the effective spectrum of the frequency-shifted vowels. If a spectral peak from the vowel with the lower f0 was close to the neuron's CF, the neuron responded with synchrony to the lower f0. However, when a spectral peak from the vowel with the higher f0 was closest to the neuron's CF, the neuron responded with synchrony to the higher f0. The result was interpreted to suggest that the pattern of synchrony to f0 could “tag” the vowel that was responsible for driving the neuron.
Another approach to studying neural mechanisms of segregation based on f0 differences involves noninvasive measurement in human listeners. Alain and colleagues (Alain et al. 2001, 2002, 2005; Dyson and Alain 2004; reviewed by Alain 2007) have identified an evoked-potential component with a latency of ~140 ms called the object-related negativity (ORN) that is related to perceptual segregation. The ORN is derived from two separate event-related potentials: one elicited with a single vowel and one elicited with a double vowel. The amplitude of the ORN increases with the difference in f0. It does not depend strongly on the listener's attentional state; the same dependence on f0 difference was observed when listeners were not required to attend to the stimuli (although the overall amplitude of the ORN was lower in that condition). Alain et al. have also identified a later response component, called N2b, that is present only when listeners are required to attend to the stimuli.
Studies of the representation of double vowels by first- and second-order neurons make it clear that much information is carried in temporal discharge patterns. However, these observations provide little insight into how that information might be used by more central neurons and circuits. Noninvasive measurements in human listeners indicate that primitive or preattentive segregation (Bregman 1990) may be nearly complete by the time the neural representation of the stimulus reaches the cortical level. However, event-related potentials do not provide detailed information about the mechanisms that lead to the observed changes in responses.
Better understanding of the intermediate processing stages—those stages that follow the initial encoding of stimulus parameters but precede the generation of event-related potentials—is needed to help establish the actual contribution of discharge synchrony to spectral segregation. Information about processing at intermediate levels of the central auditory system is also needed to inform and constrain models of cortical processing based on noninvasive physiological measures or psychophysical data. The data reported here directly addressed the representation of simultaneous sounds with different f0s in the responses of neurons in the inferior colliculus (IC), a major integrative nucleus through which nearly all information destined for the primary auditory cortex must pass (Aitkin and Phillips 1984). These experiments extend previous studies of the representation of single harmonic tones with mistuned components (Sinex 2005; Sinex et al. 2002, 2003, 2005). Both types of complex stimuli are assumed to engage the same processing mechanisms that human listeners can use to segregate individual sound sources from more complex mixtures of natural sounds including speech. These results obtained with double harmonic tones indicated that information about composite sounds was represented in the IC in the form of a low-resolution temporal code created by interactions between adjacent spectral components. This type of coding seems to be incompatible with the assumptions of models of segregation that require high-resolution encoding of individual spectral components.
Some of these results were presented at the 28th Midwinter Meeting of ARO (Sinex and Li 2005).
METHODS
Animal preparation
Responses were obtained from units in the IC of the chinchilla. Data collection methods were identical to those described previously (Sinex et al. 2005), except that different complex-tone stimuli were presented. All procedures were approved by the Institutional Animal Care and Use Committees at Arizona State University and Utah State University.
Animals were anesthetized by injection of a mixture of 36 mg/kg ketamine and 4 mg/kg xylazine. Supplemental injections of ketamine or ketamine/xylazine were given as required to maintain a surgical level of anesthesia. Animals were placed in a stereotaxic instrument (David Kopf Instruments) in a double-walled sound-attenuating booth. The skull was opened, and a portion of nonauditory cerebral cortex directly above the IC on the right side was aspirated to expose the dorsal surface of the IC. Recording electrodes were placed above the IC at predetermined stereotaxic coordinates referenced to visual landmarks (Nuding et al. 1999) and advanced from outside the sound booth with a hydraulic microdrive (Trent-Wells, Coulterville, CA or Kopf, Tujunga, CA). The electrode trajectory passed through the central nucleus of the IC, in a parasagittal plane.
Responses were recorded with carbon-fiber microelectrodes (Kation Scientific, Minneapolis, MN). Most neurons exhibited secure, short-latency responses to tone bursts, and had sharp, V-shaped tuning and CFs that increased with increasing depth. These properties are consistent with those reported in previous studies of the central nucleus of the IC (Merzenich and Reid 1974; Nuding et al. 1999). Based on these physiological properties and the locations of the electrode penetrations, it is likely that all of the data presented here were obtained from neurons in the central nucleus.
Stimuli
The stimuli for the main study were single harmonic tones, generated by summing the first eight harmonics of a fundamental frequency f0, or double harmonic tones, generated by summing two single harmonic tones with different f0s. Tones were ≥500 ms long, with 5-ms linear rise-fall time, and the two single harmonic tones combined to form a double harmonic tone always had identical onset times and durations. Tones were presented once per second at levels between 10 and 70 dB SPL per sine-wave component. Individual components were always synthesized in sine phase, and the amplitudes of individual components were adjusted during synthesis so that they would have equal SPL at the eardrum. The overall SPL of a single harmonic tone was always 9 dB higher than the level of each individual component. The overall SPL of a double harmonic tone was always 12 dB higher than the level of each individual component and 3 dB higher than the level of a single harmonic tone presented at the same level per component.
The waveforms of single harmonic tones had a period of 1/f0 and a flat envelope (Fig. 1A). Adding a second harmonic tone changed the envelope and the fine structure of each waveform (Fig. 1, B-E) and also changed the fundamental frequency of the composite sound. The double harmonic tones in Fig. 1, B and C (Δf0 = 5 and 10 Hz) were periodic over 1/Δf0 ms. That was not the case for the double harmonic tones shown in Fig. 1, D and E (Δf0 = 20 and 30 Hz); for each of these double tones, the waveform was periodic over an interval of 100 ms. That occurred because the spacing of components in the spectrum after summing was not always an integer multiple of Δf0. For example, for the double harmonic tone with Δf0 = 30 Hz, the spacing between the seventh harmonic of 280 Hz and the eighth harmonic of 250 Hz was 40 Hz, which is an integer multiple of 10 Hz but not of 30 Hz. For this sound, the highest common subcomponent of the combined stimulus was 10 Hz.
Fig. 1.

Characteristics of single and double harmonic tone stimuli. In each panel, the left plot shows a 200-ms segment of the waveform; all stimuli were periodic over a 200-ms interval. Right plot is an idealized representation of the line spectrum of stimulus. A: single harmonic tone consisting of the 1st 8 harmonics of f0 = 0.250 kHz. B: double harmonic tone with f01 = 0.250 kHz and f02 = 0.255 kHz. Difference in f0 was 2%, or ~0.25 semitones. In the composite spectrum (right), harmonics of f02 are shown with slightly lower amplitude for clarity; during data collection, levels of these components could be the same as or different from levels of harmonics of f01. Each single tone consisted of the 1st 8 harmonics of its f0. Adjacent components in the composite spectrum were contributed by different single harmonic tones, and frequency difference between adjacent components increased with increasing harmonic number. C: same as B for f02 = 0.260 kHz. Difference in f0 was 4%, or ~0.68 semitones. D: same as B for f02 = 0.270 kHz. Difference in f0 was 8%, or ~1.34 semitones. In this case, frequency difference between adjacent components varied with increasing harmonic number in a more complicated way; for example, spacing between the 7th harmonic of f02 and 8th harmonic of f01 was smaller than spacing between the 8th harmonic of f01 and 8th harmonic of f02. E: same as D for f02 = 0.280 kHz. Difference in f0 was 12%, or ~1.97 semitones.
The following terminology is used to describe double harmonic tones. The two fundamental frequencies are designated f01 and f02 and are given in kilohertz. The difference between f01 and f02 is called Δf0 and is given in hertz. The level of the tone with f01 is given as SPL1, and the tone with f02 as SPL2. SPL1 and SPL2 always indicate the level per sine-wave component and not the overall level. The spectrum of a double harmonic tone is referred to as a “composite” spectrum (Alain 2007; Sinex 2005). In the composite spectrum of each double harmonic tone used in this study, the odd-numbered components originated with the single harmonic tone with the lower f0, the even-numbered components originated with the single harmonic tone with the higher f0, and any pair of adjacent components always originated with different single harmonic tones.
Data collection and analysis
Stimulus generation, stimulus presentation, and data collection were controlled by computer. Waveforms were digitally synthesized with a sample frequency of 80.13 kHz, passed through digital-analog converters, programmable attenuators, and anti-aliasing filters (all from TDT, Alachua, FL), and delivered to a closed acoustic system incorporating ER2A insert earphones and an ER7 probe-tube microphone (Etymotic Research, Elk Grove Village, IL). The acoustic system was calibrated for each experiment. Tones were always delivered monaurally to the contralateral ear. Typically, each complex tone was presented 75 times.
When a neuron was isolated, an estimate of its CF was obtained manually. After this initial characterization of the neuron, a detailed frequency-response map was obtained with an automated procedure that presented tones at multiple frequencies and levels in a random sequence (Nuding et al. 1999). These data were used to make a more precise estimate of CF and threshold at CF. In most cases, this frequency-response map was remeasured in the presence of a fixed-level CF tone. The fixed tone elicited a consistent background response that made it possible to determine the frequency-SPL regions within which the variable tones produced discharge rate decreases. These regions were presumed to provide inhibitory input to the neuron, and the result of this measurement is referred to as the inhibitory response area (Li et al. 2006).
Responses to 500-ms tone bursts at CF were also obtained and used to classify each neuron according to the shape of its peristimulus time (PST) histogram and first-spike latency (Nuding et al. 1999; Sinex et al. 2005). Sustained units exhibited first-spike latencies that were usually <20 ms and responded throughout the CF tone, although the PST histogram often exhibited a peak at tone onset. Pauser units exhibited a short-latency transient response and a second sustained response, separated by a silent interval of several msec duration. Some sustained neurons exhibited pauser responses at higher SPLs, so the distinction between these categories is somewhat arbitrary. Transient units exhibited short-latency spikes just after stimulus onset but were silent or nearly silent afterward. Long-latency units could exhibit sustained or transient discharge patterns, but their first-spike latencies were >30 ms. Responses to double harmonic tones did not seem to depend strongly on PST classification, with the exception of long-latency neurons that responded poorly to all stimuli and are not considered further.
Spikes were displayed as PST or cycle histograms. PST histograms were generated with 1-ms bins. Cycle histograms were constructed from spikes occurring between 100 and 500 ms after tone onset, with a 5-ms correction for response latency. A correction for latency was made to include as many spikes as possible in the analysis. A constant correction was used, rather than a unique correction for each neuron, so that any time shifts in the discharge patterns could be attributed to properties of the stimuli or the neurons, rather than to the latency corrections. For analysis, cycle histograms were generated with 512 bins per 400-ms cycle. Four hundred milliseconds was two times the shortest interval over which every studied double harmonic tone was periodic. For the figures included here, cycle histograms were recalculated with a 200-ms cycle length to improve visual clarity. To determine the “response spectrum,” the discrete Fourier transforms of the 400-ms cycle histograms were calculated. Individual peaks in the response spectrum are referred to as response frequencies or response components.
RESULTS
The data presented below are representative of the responses of 41 IC units that were studied with at least one double harmonic tone. Thirty-three were well-isolated single neurons, and eight were multiunits. Recordings were judged to be from single neurons if the peaks of spike waveforms could be discriminated from peaks in the background noise (WPI 121, Sarasota, FL) so that the waveforms of successive spikes superimposed when displayed on an oscilloscope. Properties observed in recordings from single neurons were also observed in multiunit responses; however, all of the examples shown here were obtained from single neurons. Of the single neurons, 16 (48%) were classified as sustained, 7 (21%) as pausers, 8 (24%) as transient, and 2 (6%) as long-latency. The CFs of the single neurons ranged from 0.24 to 3.1 kHz, which slightly exceeds the bandwidth of the double harmonic tones. The responses of a subset of the same neurons to mistuned tones have been previously reported (Sinex et al. 2005).
Typical responses to single and double harmonic tones
Figure 2 shows the responses of one representative IC neuron to a pure tone, a single harmonic tone, and a double harmonic tone. This neuron was classified as exhibiting a transient response to tones at CF; although a few sustained spikes were observed, the response adapted strongly after 100-200 ms (Fig. 2A). The response to the single harmonic tone was more robust, 41 spikes/s compared with 15 spikes/s for the pure tone, but the time course of adaptation was similar. Although the overall level of the single harmonic tone was 9 dB higher than the level of the pure tone, the level increase did not account for the increases in discharge rate, because a pure tone presented at a level 10 dB higher also elicited a discharge rate of 15 spikes/s (data not shown). In addition, the single harmonic tone elicited a temporally patterned response whose periodicity matched the frequency of f0 (0.250 kHz). Because the neuron's CF was high relative to f0, it is most likely that this response frequency was attributable to interactions between adjacent components in the stimulus rather than to direct responses to the f0 component in the tone.
FIG. 2.
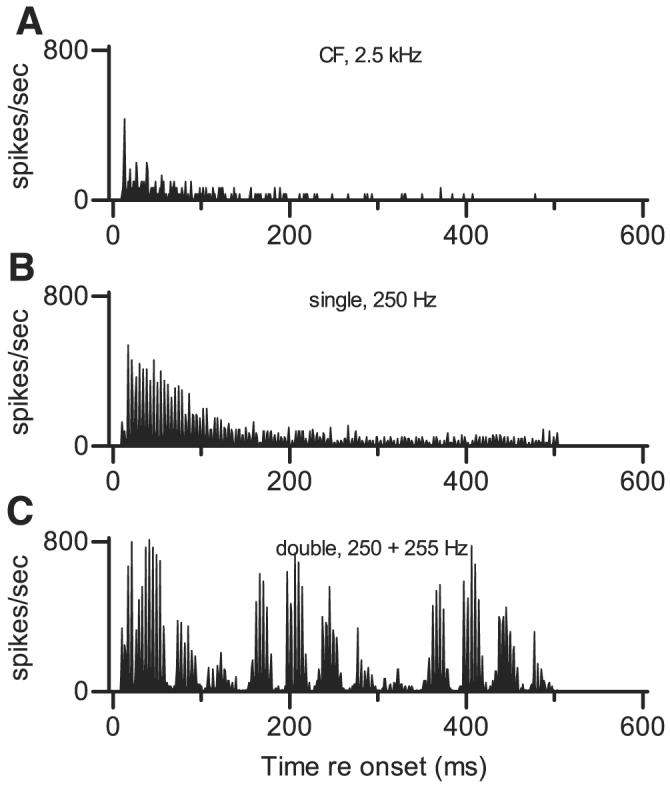
Temporal discharge patterns of 1 representative neuron to simple and complex sounds, shown as peristimulus time (PST) histograms. Abscissa represents time relative to stimulus onset; each stimulus was 500 ms long. Ordinate scale indicates discharge rate in spikes/s per 1-ms bin; very high rates indicate that spikes occurred with precise timing. Scale is the same in each panel so that overall response magnitudes can easily be compared. Neuron 418-12, characteristic frequency (CF) = 2.5 kHz, transient PST for tones at CF. A: response to a pure tone at 2.5 kHz (neuron's CF), presented at 50 dB SPL. B: response to a single harmonic tone with f01 = 0.250 kHz, presented at 50 dB SPL per component. Characteristics of this stimulus are summarized in Fig. 1A. C: response to a double harmonic tone. f01 = 0.250 kHz, presented at 50 dB SPL per component. f02 = 0.255 kHz also presented at 50 dB SPL per component. Δf0 = 5 Hz, SPL2 = SPL1. Characteristics of this stimulus are summarized in Fig. 1B.
The neuron's response to a double harmonic tone, shown in Fig. 2C, differed in at least three ways from its response to single tones. First, a distinctive temporal pattern, reflecting at least three different response frequencies, was observed. Quantitative analyses of temporal patterns like this one are presented below; for now it will be mentioned that the temporal discharge pattern was characterized by low-frequency modulation that was not observed in the responses to either single stimulus. Second, the neuron's average discharge rate was substantially higher in response to the double harmonic tone; that rate, 86 spikes/s, was a factor of 5.7 larger than the response to a pure tone. Again, this cannot be explained by the increase in overall level that resulted from the addition of the second tone (3 dB at the level of the single harmonic tone and 12 dB at the level of the pure tone). Third, the response to the double harmonic tone did not adapt over the 500-ms duration of the stimulus.
The data in Fig. 2 are replotted as cycle histograms and response spectra in Fig. 3 to allow the details of the temporal discharge patterns to be seen more clearly. Because of adaptation, the pure tone at CF elicited very few spikes during the analysis window, and no temporal pattern of any kind was apparent. The single harmonic tone elicited a pattern of peaks and valleys synchronized to the fundamental period of the stimulus, as mentioned above; the periodicity apparent in this cycle histogram matched the interval between peaks in the stimulus waveform shown in Fig. 1A. Accordingly, the response spectrum was characterized by a large peak at 0.250 kHz.
FIG. 3.

Same data shown in Fig. 2, replotted as cycle histograms (left) and response spectra (right). For cycle histograms, abscissa represents time relative to a 200-ms window; generation of cycle histograms is described in the text. Ordinate scale is in spikes/s per 0.78-ms bin. Scale is the same in each panel so that overall response magnitudes can easily be compared. Response spectra were computed as described in text. Filled symbols mark frequencies of 1 or more stimulus components. Because response synchronized to frequencies higher than f0 were rarely observed and were never observed in the absence of responses at low frequencies, abscissa in each response spectrum plot has been truncated. A: response to a pure tone at 2.5 kHz (neuron's CF), 50 dB SPL. B: response to a single harmonic tone. f01 = 0.25 kHz, 50 dB SPL per component. C: response to a double harmonic tone. f01 = 0.250 kHz, 50 dB SPL per component. f02 = 0.255 kHz, 50 dB SPL per component. Δf0 = 5 Hz, SPL2 = SPL1.
The double harmonic tone elicited the most complex pattern. Slow modulation with a period equal to the 200-ms histogram length can be seen. In addition, within that 200-ms interval, discharge rate rose and fell with a period of ~40 ms; note the rate maxima near 60, 100, and 140 ms. Finally, a fine structure was also observed. Although the higher-frequency periodicity in this discharge pattern resembled the one shown in Fig. 3B, the magnitude of the largest peaks in discharge rate was much higher in response to the double harmonic tone. Responses at 0.250 kHz (f01) and 0.255 kHz (f02) were apparent in the response spectrum (filled symbols). However, the neuron also exhibited synchronized responses that were nearly as large at 0.225, 0.230, and 0.025 kHz. These frequencies were not present in the stimulus, but they could be created by interactions between components in the complex sounds. In this double harmonic tone, the fourth harmonic of f02 was 1.020 kHz, the fifth harmonic of f01 was 1.250 kHz, the fifth harmonic of f02 was 1.275 kHz, and the sixth harmonic of f01 was 1.500 kHz. Responses synchronized to these components could interact to produce “beats” with the observed frequencies; beat as used here refers to a modulated neural response rather than to an acoustic interaction. By this argument, a response component at 0.225 kHz could arise from beating between neural inputs synchronized to 1.500 and 1.275 kHz. A component at 0.025 kHz could arise from beating between responses synchronized to 1.275 and 1.250 kHz, and a response at 0.230 kHz could arise from beating between responses at 1.250 and 1.020 kHz.
Temporal discharge patterns elicited from one neuron by different double harmonic tones are shown in Fig. 4. In each condition shown in Fig. 4, f01 was fixed at 0.250 kHz while f02 varied. Each double tone elicited a response with a distinctive temporal pattern, and the patterns changed in an apparently complex way as Δf0 increased. The waveforms of the stimuli that produced these responses (Fig. 1, B-E) also changed with Δf0. However, judged qualitatively, the change in waveforms was much smaller and more systematic than the changes in discharge pattern. Also, in no case did the discharge pattern seem to be simply related to the stimulus waveform or its overall envelope. The response spectra show that in addition to components at the two f0 frequencies (filled symbols on the figure), the neuron exhibited large responses synchronized to low frequencies that were not present in the stimulus (the unfilled symbol on each response spectrum marks the largest of these components). In each of the four examples, the low-frequency response component was equal to or larger than the response component at 0.250 kHz. The argument about neural beats from the previous paragraph can also be made here. In each of these examples, the large low-frequency response component occurred at the same frequency as the difference between the fourth harmonic of f02 and the fourth harmonic of f01. Those components, which varied from 1.000 (4 × 0.250 kHz) to 1.120 kHz (4 × 0.280 kHz), were close to the neuron's CF.
FIG. 4.

Effect of varying Δf0. Each panel displays temporal discharge pattern of 1 neuron to a double harmonic tone with a different f02, as a cycle histogram and as a response spectrum. Unfilled symbols on response spectra identify a large response component mentioned in text. Filled symbols mark stimulus frequencies as described for Fig. 3. In each panel, f01 = 0.250 kHz, presented at 50 dB SPL per component. Neuron 419-2, CF = 0.73 kHz, sustained PST. A: f02 = 0.255 kHz, 50 dB SPL per component. Δf0 = 5 Hz, SPL2 = SPL1. B: f02 = 0.260 kHz, 50 dB SPL per component. Δf0 = 10 Hz, SPL2 = SPL1. C: f02 = 0.270 kHz, 50 dB SPL per component. Δf0 = 20 Hz, SPL2 = SPL1. D: f02 = 0.280 kHz, 50 dB SPL per component. Δf0 = 30 Hz, SPL2 = SPL1.
Figure 5 compares discharge patterns elicited by double harmonic tones in which Δf0 was fixed while f01 and f02 varied. In contrast to the diversity of patterns shown in the previous figure, the responses to these stimuli were highly consistent across stimulus conditions, even though the frequencies of the actual spectral components varied. In the extreme case, the composite spectrum of the stimulus that elicited the response shown in Fig. 5C had no components in common with the spectrum of the stimulus used to generate the data in Fig. 5A. The property of the stimuli that was consistent across these conditions was the spacing between adjacent components in the composite spectrum. For example, in the stimulus that produced the response in Fig. 5A, the fourth harmonic of f01 was 1.000 kHz and the fourth harmonic of f02 was 1.020 kHz. Responses synchronized to these components could interact to produce a beat with a frequency of 20 Hz, as described previously. In the stimulus that produced the response in Fig. 5C, the fourth harmonic of f01 was 0.096 kHz and the fourth harmonic of f02 was 0.098 kHz. The component frequencies differed, but the beat or envelope frequency was the same (20 Hz). In each panel of Fig. 5, a large response component at the 20-Hz beat frequency was observed. Each response also included higher-frequency components, which changed with the stimulus and accounted for slight differences in the fine structure in the cycle histograms.
FIG. 5.

Effect of constant Δf0. Each panel is the cycle histogram of responses of 1 neuron to a double harmonic tone with the same Δf0, 5 Hz, produced by different f0 pairs, and the accompanying response spectrum. For each double tone, SPL1 = 40 dB SPL and SPL2 = SPL1. Neuron 412-3, CF = 0.90 kHz, transient PST. A: f01 = 0.250 kHz, f02 = 0.255 kHz. B: f01 = 0.250 kHz, f02 = 0.245 kHz. C: f01 = 0.240 kHz, f02 = 0.245 kHz.
Effects of characteristic frequency
Neurons tuned to different frequency regions could exhibit different responses to the same stimulus. Examples are shown in Fig. 6, which compares the discharge patterns of three neurons from one animal to one double harmonic tone. Response periodicity varied with CF. The neuron with the lowest CF (0.4 kHz; Fig. 6A) exhibited broad response peaks, with a fine structure (the 0.260-kHz component in the response spectrum) that probably did represent a direct response to the stimulus component at f02, given this neuron's low CF. The neuron's response spectrum also indicated a component at 10 Hz (unfilled symbol), the difference frequency between f01 and f02. The neuron in Fig. 6B, with CF = 0.9 kHz, exhibited a response modulated with a period of ~25 ms corresponding to a frequency of 40 Hz, as shown by the unfilled symbol on the response spectrum. Response peaks separated by shorter intervals provide evidence for other, higher-frequency response frequencies. The neuron whose response is shown in Fig. 6C, with CF = 2.5 kHz, responded with a fine structure, suggesting it was driven by inputs at even higher frequencies. Peaks separated by ~5 ms indicated an effective input at 200 Hz, and modulation with a period of 20 ms suggested an input at 50 Hz. Response components at these frequencies can be seen on the response spectrum.
FIG. 6.

Effect of CF. Each panel displays temporal discharge pattern of a different neuron from the same animal to the same double harmonic tone as a cycle histogram. f01 = 0.250 kHz, 50 dB SPL per component. f02 = 0.260 kHz, 50 dB SPL per component. Δf0 = 10 Hz, SPL2 = SPL1. A: neuron 418-1, CF = 0.4 kHz, sustained PST. B: neuron 418-7, CF = 0.9 kHz, sustained PST. C: neuron 418-12, CF = 2.5 kHz, transient PST.
Although the stimulus was the same in each of these cases, the neurons' discharge patterns indicated that the frequency or frequencies present in the effective waveform increased with CF. These responses also reinforce the observation made previously that the temporal discharge pattern did not resemble the stimulus waveform, because these disparate responses were elicited by stimuli with identical waveforms. The increase in response frequency is consistent with the suggestion that each neuron's temporal discharge pattern was determined by beats produced by adjacent components in a unique region of the stimulus spectrum. The frequency of beats produced by this particular stimulus increased with harmonic number. A neuron driven by, for example, the f0 components of each single harmonic tone would be expected to respond with a periodicity corresponding to 10 Hz, as in Fig. 6A. A neuron driven by the fourth harmonics of each single harmonic tone would be expected to respond with a periodicity corresponding to 40 Hz, as in Fig. 6B.
Discharge patterns could vary with CF, but they could also vary across neurons with similar CFs. Figure 7A shows the discharge pattern elicited by the double harmonic tone with f01 = 0.250 kHz and f02 = 0.270 kHz from a neuron with CF = 0.8 kHz. The discharge pattern shown in Fig. 7A exhibited little fine structure and broad peaks separated by 50 ms, consistent with a predominant response frequency of 20 Hz (marked on the response spectrum by the unfilled symbol). Response components at 40 Hz and higher are likely to be artifacts caused by rectification (Young and Sachs 1979). This response can be compared with the discharge pattern elicited from a different neuron by the same sound shown in Fig. 7B (also in Fig. 4C). The largest component in that neuron's synchronized response was at 80 Hz, as noted previously. The neurons had comparable CFs but were recorded in different parallel electrode tracks in the same animal. The units were separated by several hundred micrometers and differed in properties other than CF.
FIG. 7.

Additional effects of CF. A: cycle histogram (left) and response spectrum (right). f01 = 0.250 kHz, 50 dB SPL per component. f02 = 0.270 kHz, 50 dB SPL per component. Δf0 = 20 Hz, SPL2 = SPL1. Neuron 419-10, CF = 0.80 kHz, sustained PST. B: same as A for neuron 419-2, CF = 0.73 kHz, sustained PST. This response is also shown in Fig. 4C. C, left: isointensity response area obtained at 60 dB SPL for neuron 419-10 whose responses to double harmonic tones are shown in A. Arrow marks neuron's CF, estimated from responses to threshold-level tones. C, right: isointensity response area repeated in the presence of a fixed tone at CF. Arrow marks the same frequency as it does in the left panel. Average response to fixed tone was subtracted from each point, so that 0 spikes/s represents average response to fixed tone. Shaded areas below horizontal lines represent frequency-SPL regions in which tones produced rate decreases, presumably because of inhibition. D: same as C for neuron 419-2, whose response was shown in B. Arrow in each panel marks CF of neuron whose response area was shown in C to emphasize similarity. For this neuron, effects of inhibition were less apparent.
The differences between these discharge patterns indicated that the frequency content of the input to the two neurons varied even though their CFs were similar. The neuron in Fig. 7B was driven by stimulus components near its CF, whereas the neuron in Fig. 7A was influenced by lower-frequency stimulus harmonics even though its CF was essentially the same. To quantify possible differences in input, excitatory and inhibitory response areas were obtained for each neuron. These measurements confirmed that although the neurons' central excitatory response areas spanned similar frequency ranges (Fig. 7, C and D, left panels), they differed in overall shape and in the amount and frequency region of inhibitory input. The neuron whose discharge pattern was shown in Fig. 7B received primarily excitatory input, as indicated by the absence of a pattern of discharge rate decreases and the preservation of robust responses at frequencies below CF in the inhibitory response area (Fig. 7D, right panel). In contrast, the neuron whose discharge pattern was shown in Fig. 7A received strong inhibitory input from frequency regions below CF, indicated by large decreases in the response to the fixed tone (Fig. 7C, right panel).
Effects of stimulus level
Temporal discharge patterns were relatively stable over a range of stimulus levels. An example is shown in Fig. 8. At the lowest level shown, 30 dB SPL, a pattern of peaks separated by ~33 ms can be seen (Fig. 8A). The response spectrum confirmed that the largest component in the synchronized response was at 30 Hz. This pattern was largely maintained at 50 and 70 dB SPL and at other levels not shown in the figure. The pattern changed only at the highest tested level, 70 dB SPL, at which new response peaks appeared in the cycle histogram, interspersed with the original peaks. These changes appeared in the response spectrum as components at higher frequencies including a small component at f01. The change in the response spectrum was small, relative to the consistency observed over a 40-dB range of lower levels.
FIG. 8.

Effect of overall SPL. Each panel shows cycle histogram of responses of 1 neuron to the same double harmonic tone (left) and response spectrum computed from the same data (right). f01 = 0.250 kHz, f02 = 0.280 kHz. Δf0 = 30 Hz, SPL2 = SPL1. Neuron 408-17, CF = 0.65 kHz, pauser PST. A: 30 dB SPL per component. B: 50 dB SPL per component. C: 70 dB SPL per component.
Changes in the relative levels of the two harmonic tones had a much larger effect on discharge patterns, as shown in Fig. 9. Each panel presents data obtained when one harmonic tone was presented at 40 dB SPL, and the second harmonic tone was presented at equal or lower level. The equal level condition (Fig. 9D) elicited a complex temporal discharge pattern, with periodicities indicative of driving by low-frequency beats or envelopes; in the response spectrum, the largest component occurred at 40 Hz. When the level of one tone was decreased, the temporal pattern approached the pattern expected in response to the single harmonic tone with the higher level. Level differences of as little as 10 dB eliminated most or all of the contribution of the lower level tone to the discharge pattern. This is indicated by the large response component at 0.250 kHz in Fig. 9, A-C, and the component at 0.280 kHz in Fig. 9, E and F.
FIG. 9.
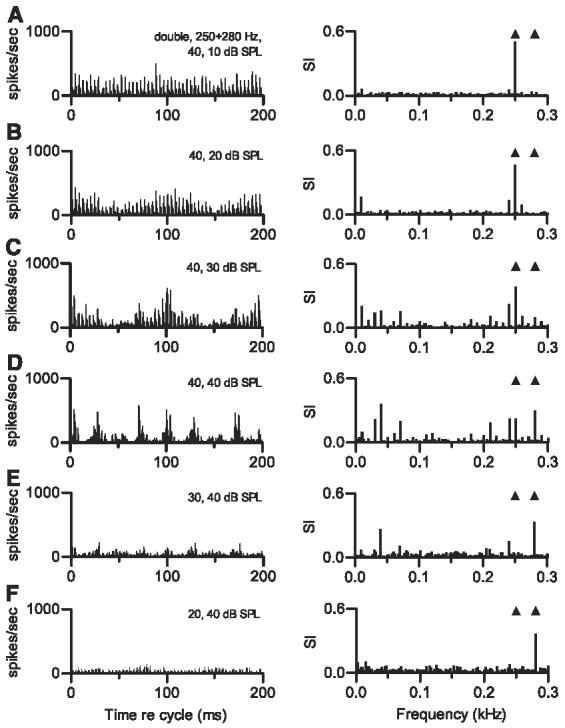
Effect of relative SPL. Each panel shows cycle histogram of responses of 1 neuron to the double harmonic tone with f01 = 0.250 kHz and f02 = 0.280 kHz. Δf0 = 30 Hz. Neuron 420-12, CF = 3.0 kHz, sustained PST. Right panels show response spectra calculated from the same data. All stimulus levels are in dB SPL per component. A: SPL1 = 40 dB SPL, SPL2 = 10 dB SPL. B: SPL1 = 40 dB SPL, SPL2 = 20 dB SPL. C: SPL1 = 40 dB SPL, SPL2 = 30 dB SPL. D: SPL1 = 40 dB SPL, SPL2 = 40 dB SPL (equal-level condition). E: SPL1 = 30 dB SPL, SPL2 = 40 dB SPL. F: SPL1 = 20 dB SPL, SPL2 = 40 dB SPL.
Summaries of response spectra
Distributions of response frequencies across the population of neurons are summarized in Fig. 10 for the two double harmonic tones studied most often. Each symbol in these plots represents the frequency of the single largest component in one response spectrum, shown as a function of the neuron's CF. The distribution of response components elicited by the double harmonic tone with f01 = 0.250 kHz and f02 = 0.255 kHz is shown in Fig. 10A. A large majority of the studied neurons exhibited low-frequency periodicity, as has been noted. These low-frequency response components can be seen with greater resolution in Fig. 10B. In this figure, each horizontal line marks the difference in frequency between two adjacent components in the spectrum of the composite stimulus. These lines are centered along the CF axis at the locations of the actual components, although the horizontal extent of the lines is arbitrary. As was first shown in Fig. 1B, the separation between adjacent components for this double harmonic tone increases with component number. Three aspects of the data should be noted. The first is that every response frequency in Fig. 10B corresponded to one of the possible beat frequencies marked by the lines. Second, many of the points fell not just at a frequency marked by a line, but within the shaded area. For those neurons, the dominant response periodicity was attributable to unresolved components of the composite spectrum that were closest to the neurons' CFs. A neuron exhibiting this pattern was shown in Fig. 4. Third, many neurons exhibited the periodicities produced by interactions between components well below CF. These are the 5-Hz responses observed in neurons with CFs covering a broad range ≤3 kHz.
FIG. 10.
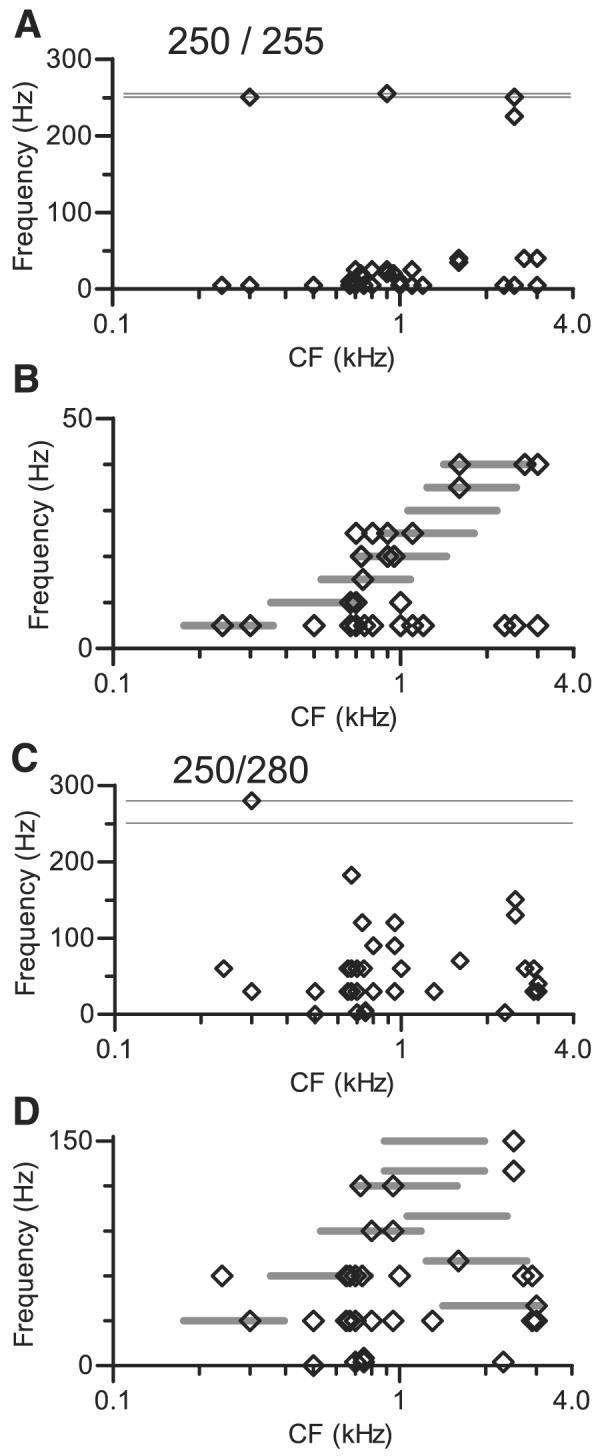
A: relation between response frequency and CF. Each point represents frequency of largest component in synchronized response of 1 neuron to double harmonic tone with f01 = 0.250 kHz, f02 = 0.255 kHz, plotted at the neuron's CF. Horizontal lines indicate fundamental frequencies f01 and f02; any point falling below these lines indicates periodicity at a frequency not present in stimulus. Level per component varied from 20 to 70 dB SPL, but more than one half of points were obtained at 40 or 50 dB SPL per component. SPL2 was always equal to SPL1. n = 55 conditions, presented to 25 neurons, so 1 neuron may contribute >1 point. B: subset of data from A, shown at higher resolution. Horizontal shaded lines are plotted at ordinate values that mark difference in frequency between 2 adjacent components in composite stimulus. These lines are positioned along abscissa to encompass locations in kilohertz of harmonics that produce each beat frequency; each line extends from one-half octave below lower-frequency harmonic to one-half octave above higher-frequency harmonic. Higher-frequency beats are produced by higher-numbered harmonics. C: same as A, for double harmonic tone with f01 = 0.250 kHz, f02 = 0.280 kHz, Δf0 = 30 Hz. n = 54 conditions, presented to 25 neurons. D: subset of data from C, shown at higher resolution. Horizontal lines provide same information as in B, but pattern and frequency dependence of possible difference frequencies is more complex.
The distribution of response frequency for a different double harmonic tone is shown in the same format in Fig. 10, C and D. It can be seen in Fig. 10C that this double harmonic tone also elicited primarily low-frequency responses, although the range was not as compressed as that shown in Fig. 10A. The distribution is shown with greater resolution in Fig. 10D. The horizontal lines in this figure have the same meaning as those in Fig. 10B, although they form a more complicated pattern, in that low difference frequencies were produced by stimulus components in the higher-CF regions as well as in the low-CF region. This occurs because, as harmonic number n increased, the frequency of the nth harmonic of f02 eventually approached that of the n + 1-th harmonic of f01 (also see Fig. 1E). For this stimulus, that accounts for the second set of horizontal lines that shows a decrease in the difference frequency as center frequency increases. The distribution of response frequencies for this double harmonic tone exhibited the same trends described for Fig. 10, A and B, with quantitative differences attributable to the larger Δf0. With this stimulus, more high-CF neurons exhibited periodicities associated with high-numbered harmonics. For example, at CF = 3 kHz, one neuron responded at 40 Hz, a frequency that could arise from interaction between the seventh harmonic of 0.280 kHz and the eighth harmonic of 0.250 kHz. Two other neurons at the same CF responded at 30 Hz, which could arise from interaction between the two f0 components.
Patterns of average discharge rate
In the data shown in Fig. 2, the double harmonic tone elicited many more spikes than either a pure tone at CF or a single harmonic tone. The generality of this finding is shown in Fig. 11. In each panel of the figure, the average discharge rate elicited by double harmonic tones is shown as the change in rate compared with that elicited by a reference stimulus. For Fig. 11, A and B, the reference stimulus was a pure tone at CF, presented at the same level as the level per component of the double harmonic tone. In Fig. 11C, the reference stimulus was the single harmonic tone with f0 = 0.250 kHz. In each plot, neurons that exhibited low discharge rates to the reference stimulus exhibited higher discharge rates to double harmonic tones. This trend was most pronounced when responses to double harmonic tones were compared with responses to single harmonic tones; the double tone elicited a higher rate in 74% of the 39 measurements, and only 7 of 39 comparisons produced rate decreases of >1 spike/s. In contrast, when the reference stimulus elicited a response greater than ~40 spikes/s, the response to the double harmonic tone was more likely to be the same as or lower than the response to the reference stimulus.
FIG. 11.
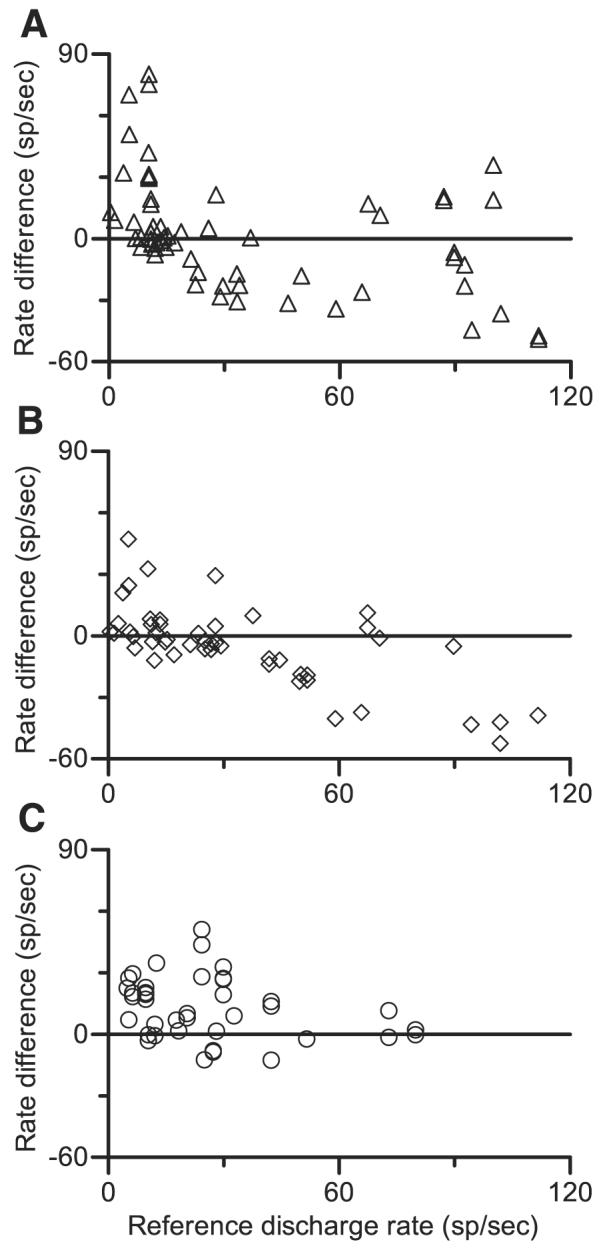
Patterns of average discharge rate. Each point represents difference between discharge rate elicited a double harmonic tone and rate elicited by a reference stimulus; positive values indicate larger responses to double harmonic tones. Discharge rates were calculated from spikes occurring between 100 and 500 ms after stimulus onset, which is the same analysis window used to calculate cycle histograms. A: responses elicited by double harmonic tones with f01 = 0.250 kHz and f02 = 0.255 kHz compared with discharge rates elicited by a pure tone at CF. The 60 values shown were obtained from 25 neurons at levels from 30 to 50 dB SPL per component. SPL2 always equaled SPL1. B: same as A, for double harmonic tone with f01 = 0.250 kHz and f02 = 0.280 kHz. The 48 values shown were obtained from 23 neurons at levels from 30 to 50 dB SPL per component. SPL2 always equaled SPL1. C: responses elicited by double harmonic tones compared with discharge rates elicited by single harmonic tones. For double harmonic tones, Δf0 and level per component varied. Single harmonic tones were always presented at the same level, and f0 for the single tone was always the same as 1 f0 in the double tone. The 39 values shown were obtained from 13 neurons at levels from 20 to 60 dB SPL per component and with Δf0 from 5 to 30 Hz. SPL2 always equaled SPL1.
DISCUSSION
IC neurons responded to double harmonic tones with a variety of complex temporal discharge patterns. Stimulus properties that most influenced the discharge patterns included the difference in fundamental frequencies Δf0 and the relative levels of the two single harmonic tones. Properties of neurons that differentially affected the response included CF and the presence or absence of inhibitory sidebands. In contrast, discharge patterns were less strongly affected by the exact f01 and f02 values used to produce a particular Δf0 (within the narrow range that was studied) or by overall SPL. Many of the details in the observed temporal discharge patterns can be understood to be a consequence of interactions between responses synchronized to a small number of adjacent components in the spectrum of the composite stimulus. These interactions are presumed to take place at or below the IC; the integrative bandwidth of the IC neuron determined which components would most affect its discharge pattern. The results provided no indication that individual components were isolated from the composite stimulus; that is, single components were not resolved as is assumed by some models of the processing of simultaneous sounds. There was also no indication that responses were affected by series of harmonics originating in one or the other single harmonic tone. Instead, IC neurons responded almost exclusively to unresolved components in the double harmonic tones. In the text that follows, this will be referred to as a low-resolution representation of the spectrum of the composite stimulus.
Mechanisms that produce the discharge patterns
The complex temporal discharge patterns elicited from IC neurons by double harmonic tones occur as a result of processing that includes two key steps, narrowband envelope extraction, and across-frequency integration. These mechanisms have been inferred from examination of the data and from analyses and simulations carried out with a phenomenological computational model described previously (Sinex et al. 2005).
Evidence that IC neurons respond primarily to envelopes was presented in individual examples of response spectra and in the summaries shown as Fig. 10. Large responses synchronized to either or both f0 components in a double harmonic tone were not common (Fig. 10). IC neurons clearly were able to synchronize to those components, because they did so in response to single harmonic tones. A representative response to a single harmonic tone was shown in Figs. 2B and 3B. Also, Fig. 9 showed that discharges synchronized to one f0 emerged when the relative level of the competing harmonic tone was decreased. Instead, IC neurons exhibited synchrony at low frequencies that nearly always could be accounted for by assuming that adjacent components in the composite stimulus interacted to create an envelope at the difference frequency. The origin of these low-frequency responses is considered further in the next section.
Direct evidence for integration across frequency was presented in Fig. 7. The predominant response component shown in Fig. 7A was at 20 Hz. A beat at that frequency would most likely be produced by the two f0 components: 0.250 and 0.270 kHz. These components were far below the neuron's CF, but occurred in a frequency region that strongly inhibited the neuron's response to a CF tone. The implication is that this neuron's response to double harmonic tones was shaped by temporally patterned inhibition (Li et al. 2006) originating in that frequency region. Additional evidence can be seen in the summary of Fig. 10. Although many neurons responded to beats produced by components near their CFs, many others responded at frequencies indicating that the beats were generated by components away from CF.
Indirect evidence for the role of envelopes and integration across frequency has been obtained from simulations carried out with the three-stage model first used by Sinex et al. (2005) to interpret the responses of IC neurons to harmonic tones with mistuned components. The model was capable of reproducing the discharge patterns observed in this study, given appropriate parameter values. As in the previous study, successful simulations required an initial stage in which a small number of adjacent stimulus components elicited a synchronized response, a second stage in which the fine structure of that response was removed, leaving the envelope, and a third stage in which the on-CF envelope was inhibited by one or more envelopes from different spectral regions. The fact that model outputs can duplicate the complicated and diverse discharge patterns observed in IC neurons suggests, but obviously cannot prove, that the integrative processing that takes place in the brain stem includes steps that resemble the stages of the model.
Origin of response components at low frequencies
The interactions between adjacent stimulus components described in the previous section could take place in the cochlea, in the form of beats in the pattern of basilar membrane displacement produced by the complex sounds. Alternatively, the interaction could occur in the central auditory system, if neurons integrated responses synchronized to different stimulus components. It is not possible to decide definitively which of these mechanisms is operating, and both may contribute. However, previous direct measurements of the responses of auditory nerve fibers to mistuned tones (Sinex et al. 2003) and double vowels (Palmer 1990) suggest that central, neural interactions make a larger contribution to the discharge patterns of IC neurons than peripheral, mechanical interactions do. In those studies, synchrony that matched difference frequencies was observed at low stimulus levels, but as level increased, auditory nerve fibers synchronized almost exclusively to a small number of components present in the stimulus. Responses of auditory nerve fibers to double harmonic tones like those presented in the present study have not been reported, but it was argued above that responses to mistuned tones arise from the same neural mechanisms as those reported here. If that is the case, then at the stimulus levels most often represented in Fig. 10, the output of the cochlea would not contain prominent low-frequency envelopes. That would imply that response components at low frequencies arise from neural interactions within or below the IC.
Relation to the representation of “mistuned tones” in the inferior colliculus
Sinex and colleagues (Sinex 2005; Sinex et al. 2002, 2005) have previously described the responses of IC neurons to single harmonic tones with a mistuned component. The mistuned-tone stimulus is a relatively simple sound whose parameters can be systematically varied to study the same neural mechanisms for segregation that are engaged by more complex sound mixtures (Alain et al. 2001; Hartmann 1988; Moore et al. 1986; Roberts and Brunstrom 1998). Sinex et al. found that mistuned tones elicited distinctive temporal discharge patterns that were quite different from the patterns elicited by single harmonic tones without mistuning. The results reported here were qualitatively consistent with the results of the previous studies of responses to mistuned tones, in that the discharge patterns overwhelmingly reflected interactions between adjacent, unresolved components in the composite stimuli. A major quantitative difference was that in a double harmonic tone (and in simultaneous natural sounds), the number of possible response frequencies is much larger than in a mistuned tone. In a tone with a single mistuned harmonic, no more than three difference frequencies can be created directly. A difference frequency equal to f0 is created by any pair of consecutive unaltered harmonics. A second difference frequency, lower than f0, is created by the mistuned component and the harmonic toward which it is shifted. The third difference frequency is higher than f0 and is created by the mistuned component and the harmonic it was shifted away from. The similarity across IC neurons of the discharge pattern elicited by one particular mistuned tone (Sinex et al. 2005) is likely attributable to the small number of possible difference frequencies in a mistuned tone. In contrast, for two single tones each consisting of the first eight harmonics of an f0, as many as 15 unique difference frequencies may be produced when the tones are added to produce a double harmonic tone. Each of these will be less than f0, and an envelope whose frequency corresponds to that of either f0 will not occur. However, the mechanism by which these difference frequencies come to drive the output of IC neurons seems to be qualitatively the same as was the case for mistuned tones.
Effects of inhibition
Sinex et al. (2005) concluded that inhibitory input to IC neurons was an essential determinant of their temporal responses to mistuned tones. A related effect of temporally patterned inhibition was reported by Li et al. (2006), who found that modulated tones whose carrier frequencies were placed away from CF could impose a modulated pattern on what would otherwise be an unmodulated response to a steady-state tone. These results provide further support for that conclusion. The data summarized in Fig. 7 confirmed that temporal discharge patterns varied with the amount and frequency bandwidth of inhibition. Inhibition may also contribute to the pattern of change in average discharge rate shown in Figs. 2 and 11. The increase in discharge rate observed in neurons that exhibited low rates of response to pure tones and single harmonic tones may have occurred because the low-FM inherent in double harmonic tones created intervals of release from tonic inhibition. Sinex et al. (2005) found a similar effect in responses of IC neurons to mistuned tones. Mistuned tones on the average elicited slightly higher discharge rates than did the original harmonic tones, possibly because mistuning created low-frequency modulated inputs that created opportunities for release from inhibition.
It is well known that the responses of many IC neurons are inhibited by tones at frequencies remote from CF (LeBeau et al. 1996, 2001; Palombi and Caspary 1996). It is often suggested or implied that the functional significance of these inputs is to sharpen frequency selectivity. The results presented here and the related results of Sinex et al. (2005) raise the possibility that sideband inhibition may actually serve a different, equally important function by enabling IC neurons to compute the difference between the spectrum in a central excitatory region and in regions remote from the excitatory center. That is, the role of wideband inhibition may be to add relevant detail to the representation of the spectrum, rather than to eliminate or reject information, as is implied by the frequency-sharpening view. A spectral representation of this kind may underlie psychophysical observations showing that listeners make use of temporal information distributed across frequency (Grose et al. 2005; Hall et al. 1984).
Relation to the perception of double vowels
Studies of the psychophysical processing of single or double harmonic sounds have led to models that may suggest potential neural coding mechanisms. These models often assume that spectral components associated with a particular f0 are isolated from the background of spectral components that originated with different f0s (de Cheveigné 1993; Duifhuis et al. 1982; Goldstein 1973; Meddis and Hewitt 1992). That general view will be referred to here as a “high-resolution” model of spectral segregation. Although many psychophysical abilities depend on high-resolution analysis of frequency (Moore et al. 1986; Plack and Oxenham 2005), other observations argue against high-resolution analysis (Culling and Darwin 1994; Hartmann 1988, 2004; Roberts 2005; Roberts and Brunstrom 1998, 2001). For example, Culling and Darwin (1994) presented listeners with “interleaved vowels.” These were double vowels in which the spectral profile of each individual vowel was defined by some harmonics of one f0 and some harmonics of the other f0. The interleaved vowels were presented in pairs, such that the total number and frequencies of components in a pair was the same as in a control condition consisting of two simultaneous unmodified vowels. With these stimuli, a high-resolution process that rejected components that were not harmonics of the desired f0 would extract a set of spectral components unrelated to one another, from which the intended vowel could not be identified. However, for small f0 separations, listeners were able to identify interleaved vowels as accurately as they identified the unmodified double vowels. Also, as noted in the Introduction, many studies of the perception of double vowels have found that rapid improvement in identification performance occurs as Δf0 increases from 0 to ~6% (Assmann and Summerfield 1990; Chalikia and Bregman 1989). Adjacent components in these composite stimuli are too close to one another to be resolved, as that term is used in psychoacoustics (Glasberg and Moore 1990).
The results presented here suggest that the information that may eventually result in the perception of two sounds is available as a result of interactions between adjacent unresolved components, even when those components were associated with different f0s or with no f0 at all. That is, the segregation of simultaneous sounds may be based on a low-resolution representation of relatively local spectral structure. That structure is determined by the spacing between adjacent components, rather than by a global spectral structure determined by the harmonic relations among a larger series of components. The representation of double harmonic tones reported here and the previous descriptions of the representation of mistuned tones (Sinex 2005; Sinex et al. 2002, 2005) are consistent with this view; those data provided little direct evidence for high-resolution processing of composite spectra, as would be typical of natural sounds with f0 differences such as competing speech sounds. The data also indicated that even though components may have been resolved in the cochlea (Sinex et al. 2003), they will still interact in the central auditory system. Overall, these results indicate that the representation is primarily local, in that it conveys information about restricted regions of the spectrum but not about the structure of the entire spectrum. This kind of representation is consistent with the psychophysical observations already mentioned. For example, a code of this type would be expected to represent local spectral regions in interleaved vowels in a way that was similar to the representation of the original double vowel; as noted, listeners identify these different stimuli equally well, at least for small Δf0 (Culling and Darwin 1994). It would also be resistant to spectral manipulations such as “stretching” or frequency shifting; psychophysical experiments indicate that manipulations of this type have little effect on perceptual segregation (Roberts and Brunstrom 2001). A coding strategy based on low-resolution local interactions offers some advantages over a high-resolution strategy. One is that it is simpler; it does not require computation of the exact frequencies of components, the identification of particular filters or processing channels in which those components fall, or the harmonic relation of one component to other components remote in frequency. The fact that components from two sources are interspersed in the composite spectrum is irrelevant. Finally, a code based on low-frequency envelopes would be somewhat resistant to the exact phases of the interacting components. Sinex et al. (2005) found that the stereotypical features of the temporal discharge patterns elicited by mistuned tones were only modestly affected by shifts in the phases of individual components in those tones. Shifts in component phase are unavoidable and unpredictable in realistic sound mixtures.
In conclusion, double harmonic tones elicit a broad range of complex temporal discharge patterns from neurons in the IC. Temporal details of these patterns are strongly affected by Δf0, CF, and relative level. The patterns are produced by interactions between adjacent components in the stimulus tones; that is, by interactions that are local within the composite spectrum of the stimulus. These observations, and related psychophysical findings from other laboratories, suggest that the representation and eventual segregation of simultaneous harmonic sounds is based on “low-resolution” processing, which does not require components or subsets of components from any individual sound to be processed in isolation from components of competing sounds.
ACKNOWLEDGMENTS
A. Zhou provided comments on a draft of the manuscript.
GRANTS This study was supported by National Institute of Deafness and Communication Disorders Grant DC-00341 D. G. Sinex.
REFERENCES
- Aitkin LM, Phillips SC. Is the inferior colliculus an obligatory relay in the cat auditory system? Neurosci Lett. 1984;44:259–264. doi: 10.1016/0304-3940(84)90032-6. [DOI] [PubMed] [Google Scholar]
- Alain C. Breaking the wave: effects of attention and learning on concurrent sound perception. Hear Res. 2007;225:225–236. doi: 10.1016/j.heares.2007.01.011. [DOI] [PubMed] [Google Scholar]
- Alain C, McDonald KL, Ostroff JM, Schneider B. Age-related changes in detecting a mistuned harmonic. J Acoust Soc Am. 2001;109:2211–2216. doi: 10.1121/1.1367243. [DOI] [PubMed] [Google Scholar]
- Alain C, Reinke K, He Y, Wang C, Lobaugh N. Hearing two things at once: neurophysiological indices of speech segregation and identification. J Cogn Neurosci. 2005;17:811–818. doi: 10.1162/0898929053747621. [DOI] [PubMed] [Google Scholar]
- Alain C, Schuler BM, McDonald KL. Neural activity associated with distinguishing concurrent auditory objects. J Acoust Soc Am. 2002;111:990–995. doi: 10.1121/1.1434942. [DOI] [PubMed] [Google Scholar]
- Assmann PF, Summerfield Q. Modeling the perception of concurrent vowels: vowels with the same fundamental frequency. J Acoust Soc Am. 1989;85:327–338. doi: 10.1121/1.397684. [DOI] [PubMed] [Google Scholar]
- Assmann PF, Summerfield Q. Modeling the perception of concurrent vowels: vowels with different fundamental frequencies. J Acoust Soc Am. 1990;88:680–697. doi: 10.1121/1.399772. [DOI] [PubMed] [Google Scholar]
- Blackburn CC, Sachs MB. The representations of the steady-state vowel sound /eh/ in the discharge patterns of cat anteroventral cochlear nucleus neurons. J Neurophysiol. 1990;63:1191–1212. doi: 10.1152/jn.1990.63.5.1191. [DOI] [PubMed] [Google Scholar]
- Bregman AS. Auditory Scene Analysis. MIT Press; Cambridge, MA: 1990. [Google Scholar]
- Brokx J, Nooteboom S. Intonation and the perceptual separation of simultaneous voices. J Phonetics. 1982;10:23–26. [Google Scholar]
- Carlyon RP. How the brain separates sounds. Trends Cogn Sci. 2004;8:465–471. doi: 10.1016/j.tics.2004.08.008. [DOI] [PubMed] [Google Scholar]
- Carlyon RP, Shackleton TM. Comparing the fundamental frequencies of resolved and unresolved harmonics: evidence for two pitch mechanisms? J Acoust Soc Am. 1994;95:3541–3554. doi: 10.1121/1.409970. [DOI] [PubMed] [Google Scholar]
- Chalikia MH, Bregman AS. The perceptual segregation of simultaneous auditory signals: pulse train segregation and vowel segregation. Percept Psychophysiol. 1989;46:487–496. doi: 10.3758/bf03210865. [DOI] [PubMed] [Google Scholar]
- Chalikia MH, Bregman AS. The perceptual segregation of simultaneous vowels with harmonic, shifted, or random components. Percept Psychophysiol. 1993;53:125–133. doi: 10.3758/bf03211722. [DOI] [PubMed] [Google Scholar]
- Culling JF, Darwin CJ. Perceptual and computational separation of simultaneous vowels: cues arising from low-frequency beating. J Acoust Soc Am. 1994;95:1559–1569. doi: 10.1121/1.408543. [DOI] [PubMed] [Google Scholar]
- Darwin C. Pitch and auditory grouping. In: Plack CJ, Oxenham AJ, Fay RR, Popper AN, editors. Pitch: Neural Coding and Perception. Springer; New York: 2005. pp. 278–305. [Google Scholar]
- Darwin C, Carlyon R. Auditory grouping. In: Moore BC, editor. Hearing. Academic; San Diego, CA: 1995. pp. 387–424. [Google Scholar]
- de Cheveigné A. Separation of concurrent harmonic sounds: fundamental frequency estimation and a time-domain cancellation model of auditory processing. J Acoust Soc Am. 1993;93:3271–3290. [Google Scholar]
- de Cheveigné A. Concurrent vowel identification: III. A neural model of harmonic interference cancellation. J Acoust Soc Am. 1997;101:2857–2865. [Google Scholar]
- de Cheveigné A. Vowel-specific effects in concurrent vowel identification. J Acoust Soc Am. 1999;106:327–340. doi: 10.1121/1.427059. [DOI] [PubMed] [Google Scholar]
- Delgutte B. Speech coding in the auditory nerve: II. Processing schemes for vowel- like sounds. J Acoust Soc Am. 1984;75:879–886. doi: 10.1121/1.390597. [DOI] [PubMed] [Google Scholar]
- Duifhuis H, Willems LF, Sluyter RJ. Measurement of pitch in speech: an implementation of Goldstein's theory of pitch perception. J Acoust Soc Am. 1982;71:1568–1580. doi: 10.1121/1.387811. [DOI] [PubMed] [Google Scholar]
- Dyson BJ, Alain C. Representation of concurrent acoustic objects in primary auditory cortex. J Acoust Soc Am. 2004;115:280–288. doi: 10.1121/1.1631945. [DOI] [PubMed] [Google Scholar]
- Glasberg BR, Moore BC. Derivation of auditory filter shapes from notched-noise data. Hear Res. 1990;47:103–138. doi: 10.1016/0378-5955(90)90170-t. [DOI] [PubMed] [Google Scholar]
- Goldstein JL. An optimum processor theory for the central formation of the pitch of complex tones. J Acoust Soc Am. 1973;54:1496–1516. doi: 10.1121/1.1914448. [DOI] [PubMed] [Google Scholar]
- Grose J, Hall JI, Buss E. Across-channel spectral processing. In: Malmierca MS, Irvine DR, editors. Auditory Spectral Processing. Elsevier; San Diego, CA: 2005. pp. 88–120. [Google Scholar]
- Hall J, Haggard M, Fernandes M. Detection in noise by spectro-temporal pattern analysis. J Acoust Soc Am. 1984;76:50–56. doi: 10.1121/1.391005. [DOI] [PubMed] [Google Scholar]
- Hartmann WM. Pitch perception and the segregation and integration of auditory entities. In: Edelman G, Gall W, Cowan W, editors. Auditory Function: Neurobiological Bases of Hearing. John Wiley; New York: 1988. pp. 623–645. [Google Scholar]
- Hartmann WM. Detecting a mistuned harmonic. Michigan State Psychoacoustics Report #129. 2004
- Keilson SE, Richards VM, Wyman BT, Young ED. The representation of concurrent vowels in the cat anesthetized ventral cochlear nucleus: evidence for a periodicity-tagged spectral representation. J Acoust Soc Am. 1997;102:1056–1071. doi: 10.1121/1.419859. [DOI] [PubMed] [Google Scholar]
- LeBeau FEN, Malmierca MS, Rees A. Iontophoresis in vivo demonstrates a key role for GABA(A) and glycinergic inhibition in shaping frequency response areas in the inferior colliculus of guinea pig. J Neurosci. 2001;21:7303–7312. doi: 10.1523/JNEUROSCI.21-18-07303.2001. [DOI] [PMC free article] [PubMed] [Google Scholar]
- LeBeau FEN, Rees A, Malmierca MS. Contribution of GABA- and glycine-mediated inhibition to the monaural temporal response properties of neurons in the inferior colliculus. J Neurophysiol. 1996;75:902–919. doi: 10.1152/jn.1996.75.2.902. [DOI] [PubMed] [Google Scholar]
- Li H, Sabes JH, Sinex DG. Responses of inferior colliculus neurons to SAM tones located in inhibitory response areas. Hear Res. 2006;220:116–125. doi: 10.1016/j.heares.2006.07.012. [DOI] [PMC free article] [PubMed] [Google Scholar]
- Lin JY, Hartmann WM. The pitch of a mistuned harmonic: evidence for a template model. J Acoust Soc Am. 1998;103:2608–2617. doi: 10.1121/1.422781. [DOI] [PubMed] [Google Scholar]
- Meddis R, Hewitt MJ. Modeling the identification of concurrent vowels with different fundamental frequencies. J Acoust Soc Am. 1992;91:233–245. doi: 10.1121/1.402767. [DOI] [PubMed] [Google Scholar]
- Merzenich M, Reid M. Representation of the cochlea within the inferior colliculus of the cat. Brain Res. 1974;77:397–415. doi: 10.1016/0006-8993(74)90630-1. [DOI] [PubMed] [Google Scholar]
- Moore BC, Glasberg BR, Peters RW. Thresholds for hearing mistuned partials as separate tones in harmonic complexes. J Acoust Soc Am. 1986;80:479–483. doi: 10.1121/1.394043. [DOI] [PubMed] [Google Scholar]
- Nuding S, Chen G-D, Sinex DG. Monaural response properties of single neurons in the chinchilla inferior colliculus. Hear Res. 1999;131:89–106. doi: 10.1016/s0378-5955(99)00023-4. [DOI] [PubMed] [Google Scholar]
- Palmer AR. The representation of the spectra and fundamental frequencies of steady-state single- and double-vowel sounds in the temporal discharge patterns of guinea pig cochlear-nerve fibers. J Acoust Soc Am. 1990;88:1412–1426. doi: 10.1121/1.400329. [DOI] [PubMed] [Google Scholar]
- Palombi P, Caspary D. GABA inputs control discharge rate primarily within frequency receptive fields of inferior colliculus neurons. J Neurophysiol. 1996;75:2211–2219. doi: 10.1152/jn.1996.75.6.2211. [DOI] [PubMed] [Google Scholar]
- Plack CJ, Oxenham AJ. The psychophysics of pitch. In: Plack CJ, Oxenham AJ, Fay RR, Popper AN, editors. Pitch: Neural Coding and Perception. Springer; New York: 2005. pp. 7–55. [Google Scholar]
- Roberts B. Spectral pattern, grouping, and the pitches of complex tones and their components. Acta Acustica. 2005;91:945–957. [Google Scholar]
- Roberts B, Brunstrom JM. Perceptual segregation and pitch shifts of mistuned components in harmonic complexes and in regular inharmonic complexes. J Acoust Soc Am. 1998;104:2326–2338. doi: 10.1121/1.423771. [DOI] [PubMed] [Google Scholar]
- Roberts B, Brunstrom JM. Perceptual fusion and fragmentation of complex tones made inharmonic by applying different degrees of frequency shift and spectral stretch. J Acoust Soc Am. 2001;110:2479–2490. doi: 10.1121/1.1410965. [DOI] [PubMed] [Google Scholar]
- Sinex DG. Spectral processing and sound source determination. In: Malmierca M, Irvine D, editors. Auditory Spectral Processing. Elsevier; San Diego, CA: 2005. pp. 371–398. [DOI] [PMC free article] [PubMed] [Google Scholar]
- Sinex DG, Geisler CD. Responses of auditory nerve fibers to consonant-vowel syllables. J Acoust Soc Am. 1983;73:602–615. doi: 10.1121/1.389007. [DOI] [PubMed] [Google Scholar]
- Sinex DG, Guzik H, Li H, Henderson Sabes J. Responses of auditory nerve fibers to harmonic and mistuned complex tones. Hear Res. 2003;182:130–139. doi: 10.1016/s0378-5955(03)00189-8. [DOI] [PubMed] [Google Scholar]
- Sinex DG, Li H. Responses of inferior colliculus neurons to simultaneous complex tones with different fundamental frequencies. Abstr Assoc Res Otolaryngol. 2005;28:340. [Google Scholar]
- Sinex DG, Li H, Velenovsky DS. Prevalence of stereotypical responses to mistuned complex tones in the inferior colliculus. J Neurophysiol. 2005;94:3523–3537. doi: 10.1152/jn.01194.2004. [DOI] [PMC free article] [PubMed] [Google Scholar]
- Sinex DG, Sabes JH, Li H. Responses of inferior colliculus neurons to harmonic and mistuned complex tones. Hear Res. 2002;168:150–162. doi: 10.1016/s0378-5955(02)00366-0. [DOI] [PubMed] [Google Scholar]
- Yost WA. Overview: psychoacoustics. In: Yost W, Popper A, Fay R, editors. Human Psychophysics. Springer-Verlag; New York: 1993. pp. 1–12. [Google Scholar]
- Yost WA, Sheft S. Auditory perception. In: Yost WA, Popper AN, Fay RR, editors. Human Psychophysics. Springer-Verlag; New York: 1993. pp. 193–236. [Google Scholar]
- Young ED, Sachs MB. Representation of steady-state vowels in the temporal aspects of the discharge patterns of populations of auditory-nerve fibers. J Acoust Soc Am. 1979;66:1381–1403. doi: 10.1121/1.383532. [DOI] [PubMed] [Google Scholar]