

Abstract
The underlying stereochemical mechanisms for the dramatic differences in autooxidation and hemin loss rates of fish versus mammalian hemoglobins (Hb) have been examined by determining the crystal structures of perch, trout IV, and bovine Hb at high and low pH. The fish Hbs autooxidize and release hemin ∼50 to 100-fold more rapidly than bovine Hb. Five specific amino acid replacements in the CD corner and along the E helix appear to cause the increased susceptibility of fish Hbs to oxidative degradation compared to mammalian Hbs. Ile is present at the E11 helical position in most fish Hb chains whereas a smaller Val residue is present in all mammalian α and β chains. The larger IleE11 side chain sterically hinders bound O2 and facilitates dissociation of the neutral superoxide radical, enhancing autooxidation. Lys(E10) is found in most mammalian Hb and forms favorable electrostatic and hydrogen bonding interactions with the heme-7-propionate. In contrast, Thr(E10) is present in most fish Hbs and is too short to stabilize bound heme, and causes increased rates of hemin dissociation. The especially high rates of hemin loss in perch Hb are also due to a lack of electrostatic interaction between His(CE3) and the heme-6 propionate in α subunits whereas this interaction does occur in trout IV and bovine Hb. There is also a larger gap for solvent entry into the heme crevice near β CD3 in the perch Hb (∼8Å) compared to trout IV Hb (∼6Å) which in turn is significantly higher than that in bovine Hb (∼4Å) at low pH. The amino acids at CD4 and E14 differ between bovine and the fish Hbs and have the potential to modulate oxidative degradation by altering the orientation of the distal histidine and the stability of the E-helix. The generally rapid rates of lipid oxidation in fish muscle can be partly attributed to the fact that fish Hbs are highly susceptible to oxidative degradation.
Keywords: Crystallography, heme protein, oxidation, redox stability, heme affinity, lipids, myoglobin
Introduction
Hemoglobin (Hb) and myoglobin (Mb) play a key role in oxygen delivery to tissues. These heme proteins have been implicated as potential agents in various pathologies including atherosclerosis, rhabdomyolysis, ischemia-reperfusion injury, brain injury, and various hemoglobinopathies 1-4. Hbs have been suggested to play a key role in atherosclerosis due to the oxidation of low density lipoproteins by hemin iron(III) atoms 5. In addition to the medical pathologies, the oxidation of heme proteins and subsequent lipid oxidation are also detrimental to muscle preservation and of great interest to the food industry. The quality, odor, and flavor of meats are significantly affected and results in loss of sales 6. Thus, structural mechanisms by which oxidation of heme and its release from Hb occur would be beneficial for understanding such diverse problems as plaque development in arteries and the shortening of meat-product shelf-life.
Previous research has shown that the autooxidation of the heme iron results in the formation of superoxide and hydrogen peroxide, (Figure 1). The resultant metHb can then react with H2O2 or lipid hydroperoxides to form a ferryl protein radical, which promotes rapid lipid oxidation 7. Accordingly, Hbs with high rates of heme iron oxidation cause higher rates of lipid oxidation 8. In general, heme is more weakly anchored in the globin after oxidation 9 and its release from the protein and subsequent uptake in membranes further enhances lipid oxidation by decomposition of pre-formed lipid hydroperoxides 10, even though the exact reactions of free hemin (Fe(III)-protoporphyrin IX) with lipid membranes are poorly understood 11.
Figure 1.

Mechanism of iron oxidation in heme. The heme iron can be oxidized in two mechanisms: when the concentration of O2 is high (the top method) or low (the bottom method) (Adapted from 14). Under high concentrations of O2 (1), a hydronium molecule bonds with O2 and the ligand leaves as a neutral superoxide radical. A water can then hydrogen bond with the distal His. Under low concentrations of O2 (2), a water molecule can displace the ligand. Reentry of O2 can remove an electron from the heme iron in which the coordinated water facilitates the removal of the iron electron to O2. The ligand leaves the heme pocket as superoxide anion radical. In both scenarios the iron heme is oxidized to Fe(III).
Although there is high sequence homology among mammalian and fish Hbs, the oxidation and hemin loss rates between these vertebrates can vary significantly. Trout and perch Hbs have been shown to oxidize much more rapidly than bovine and avian Hbs 12,13. As a result, the rates of lipid oxidation by fish Hbs were also much greater than those for Hbs from the terrestrial species 12,13 . Oxidation of lipids can occur by the build up of radical oxygen species, primarily superoxide, peroxide, and hydroxyl radicals or by direct interactions with ferric or ferryl heme complexes. Thus, the structural changes in Hb that cause high rates of autooxidation and hemin loss are of interest to cardiovascular medicine and the food industry.
At high oxygen concentrations, metHb formation occurs by spontaneous dissociation of the neutral superoxide radical (•OOH), which requires protonation of bound O2 by solvent water (Figure 1)14. At low oxygen concentrations ([O2] ≈ P50), water present in the distal pocket of deoxyHb can weakly coordinate to the iron atom and facilitate an outer sphere reaction with free O2 to produce superoxide anion and metHb. The higher rate of the latter reaction accounts for the “bell-shaped” dependence of the rate of autooxidation on [O2] 14,15. Increased access of H2O to both the distal and proximal portions of the heme pocket in metMb also accelerates hemin loss, which causes even greater oxidative stress in the surrounding media 15.
To examine the mechanistic causes of the higher rates of autooxidation and hemin loss in fish hemoglobins, we determined the first crystal structures of trout IV Hb and perch Hb and compared them to new crystal structures of bovine Hb. Hemin loss and autooxidation rate constants were determined for the three Hbs. The structures were determined in a pro-oxidative environment at pH 5.7 and 6.3 and an environment that is not conducive to oxidation at pH 8.0. The pH values 5.7 and 6.3 coincide with the post-mortem pH of the muscles of many agriculturally important mammal and fish species and are conditions of importance to the food industry for shelf life and quality issues. The structures were then analyzed and compared in terms of observed rates of oxidative degradation and known effects of mutagenesis in recombinant Mb and Hb model systems. The results of these comparisons have led to a structural rationale for the significantly high rates of autooxidation and hemin loss rates for the fish Hbs.
Materials and Methods
Sequencing of perch α and β subunits
Total mRNA from the red blood cells (RBCs) of yellow perch, Perca flavescens, was prepared according to the Invitrogen RNA isolation protocol (Cat. No. 15596-018, Madison, WI). The single-stranded cDNA were synthesized using a ThermoScript RNase H-Reverse Transcriptase using an Oligo(dT)20 primer (Invitrogen, Madison, WI). The cDNA was amplified for 34 cycles each consisting of 0.5 minutes at 94° C for denaturation, 0.5 minutes at 60° C or 52° C for annealing, and 68° C for primer extension, by PCR using high fidelity Taq polymerase (Invitrogen, Madison, WI). The first ten amino acids of the β subunit N-terminus were sequenced at the University of Texas Medical Branch (Galveston, TX). Degenerate primers were designed using this amino acid sequence for the forward primers and sequence alignment of twenty fish Hb β subunits were used for the reverse primers. The forward primer used for cloning of the β chain was: 5′-GTY GTK TGG ACM GAY TTY GAG CGH GCY AC-3′; the reverse primer was: 5′-YAG TGG TAC TKY YTD CCM AG-3′. A single amplified product was produced via PCR using an annealing temperature of 52° C, cleaned by Promega Wizard SV Gel and PCR Clean-Up System (Madison, WI), and then ligated into the pGEM-T Easy Vector overnight. After mini-prep plasmid purification, the DNA was sequenced at the Biotech Center at the University of Wisconsin-Madison.
Several forward and reverse degenerate primers were designed based on alignments of twenty fish Hb α subunits as acetylation of the N-terminus inhibited sequencing the initial N-terminal residues of the α subunit. The forward primers were: 5′-ATG AGT CTS WCW GSA ARG GAC AA-3′, 5′-ATG AGT CTG ACA GCA AAG GAC AA-3′, and 5′-ATG AGT CTC TCT GGA AAG GAC AA-3′. The reverse primers were: 5′-TTA KCK GTA TYT STC RGC CAG-3′, 5′-TTA TCT GTA TTT GTC AGC CAG-3′, and 5′-TTA GCG GTA TCT CTC GGC CAG-3′. A single amplified product was produced via PCR using an annealing temperature of 48° C using combinations of the forward and reverse primers, cleaned by Promega Wizard SV Gel and PCR Clean-Up System (Madison, WI), and then ligated into the pGEM-T Easy Vector overnight and sequenced as described for the β subunit.
The clones for the α-subunit from the perch cDNA indicated several amino sequences, all with a length of 141 residues. The inferred protein sequences showed 97% identity to one another. This result suggests the possibility of multiple, very similar perch α-chain isoforms. ESI-MS data from perch hemolysates suggested two α-chains were present and differed by ∼50 daltons (data not shown). The cloned sequences of the α subunit were used as the starting model for crystallographic refinement, and the exact amino acid at given position was altered when modeled side chain was surrounded by significant levels of negative density at 3σ or positive density at 3σ in the Fo-Fc difference maps. Amino acid residue changes were accepted when the difference map surrounding the residues showed no peaks at ±3σ. The resulting perch α subunit amino acid sequence determined by both cDNA sequencing and crystallography defined a MW equal to 15500.9 Da and a pI of 8.59. The majority of differences between the cDNA and crystallographically determined sequences lay in the N- and C-terminal regions of the protein. There were no differences in the heme pocket region. The perch cDNA β gene showed no ambiguity and indicated a single β globin of 148 amino acids with a molecular weight of 16067.5 Da and a pI of 7.52, which corresponds closely to the 16072 Da MW measured from the ESI-MS β peak of perch hemolysate. There were no discrepancies in the electron density difference maps for the perch β subunits.
Purification of hemoglobins
Perch blood was removed from P. flavescens and placed on ice in vials containing 150 units•ml−1 sodium heparin and 150 mM NaCl to prevent clotting. One ml anticoagulant was present for every 4 ml of blood obtained. Purification followed previous methods 16 and differed as follows. After extracting the Hb from perch blood, the Hb was run through a Superdex 200 gel filtration column (GE Healthcare, Piscataway, NJ) with CO-flushed 10 mM Tris, 25 mM NaCl at pH 8.0–8.2 at 4° C. The perch Hb was collected and concentrated to 20 mg•ml−1 for crystallization.
Blood from rainbow trout, Onchorhyncus mykiss, was placed on ice in vials containing 150 units•ml−1 sodium heparin and 150 mM NaCl to prevent clotting. Purification followed previous methods 16 and differed as follows. The Hb solution was run through a DEAE-52 anion exchange column equilibrated with 10 mM Tris at pH 8.0 at 4° C. Trout I, II, and III Hb were eluted and the column was washed with CO-flushed 10 mM Tris at pH 8.0 for approximately one hour at 4° C. Trout IV Hb was then eluted from the column with 10 mM Tris, 0.5 M NaCl at pH 8.0, was collected and dialyzed overnight against 10 mM Tris, 25 mM NaCl at pH 8.0 at 4° C, and was run through a Superdex 200 gel filtration column with CO-flushed 10 mM Tris, 25 mM NaCl at pH 8.0–8.2 at 4° C. The Trout IV Hb was collected and concentrated to 20 mg•ml−1 for crystallization. Trout IV accounts for around 65% of the total Hb in Rainbow trout while components I, II, and III comprise the remainder 17.
Bovine blood was removed from Angus cattle, Bos taurus, and placed on ice in vials containing 150 units•ml−1 sodium heparin and 150 mM NaCl to prevent clotting. Purification followed previous methods 16 and differed as follows. After extracting the Hb from bovine blood, the Hb was run through a G25 superfine Sephadex column with CO-flushed 10 mM Tris, 25mM NaCl at pH 8.0–8.2 at 4° C and then was run through a Superdex 200 gel filtration column with 10 mM Tris, 25 mM NaCl at pH 8.0–8.2 at 4° C. The bovine Hb was collected and concentrated to 15 mg•ml−1 for crystallization.
Crystallization of hemoglobins
Crystals of the purified perch Hb were grown at room temperature using the batch method. For crystals grown at pH 5.7, 15 mg•ml−1 of CO-bound perch Hb in 25 mM NaCl, 10 mM Tris at pH 8.0 (Buffer P) were mixed one to one with the CO-flushed well solution yielding a final concentration of 0.1 M sodium cacodylate at pH 5.7 and 15% polyethylene glycol (PEG) 4K. Crystals grew between 2 to 3 days and were cryo-protected step-wise in 15% PEG 4K, 27.5% glycerol, and 0.1 M sodium cacodylate at pH 5.7. For crystals grown at pH 6.3, 15 mg•ml−1 of CO-bound perch Hb in Buffer P were mixed one to one with the CO-flushed well solution yielding a final concentration of 0.1 M N-(2-Acetamido) Iminodiacetic Acid (ADA) at pH 6.3 and 17% PEG 4K. Crystals grew within 2 days and were cryo-protected in one-step with 17% PEG 4K, 27.5% glycerol, and 0.1 M ADA at pH 6.3. For crystals grown at pH 8.0, 10 mg•ml−1 of CO-bound perch Hb in Buffer P were mixed one to one with the CO-flushed well solution to yield a final concentration of 0.1 M Tris at pH 8.0 and 16.5% polyethylene glycol (PEG) 4K. Crystals were cryo-protected with 16.5% PEG 4K, 25% ethylene glycol, and 0.1 M Tris at pH 8.0.
Crystals of the purified CO-bound trout IV Hb were grown using the hanging drop method. For crystals at pH 5.7, 15 mg•ml−1 of CO-bound trout IV Hb were mixed one to one with the CO-flushed well solution to yield a final concentration of 22.5% PEG 1.5K and 0.04–0.06 M MES/Acetate at pH 5.7. The solutions were pHed to verify that the crystallization conditions were at pH 5.7 due to the lower buffer molarity. Crystals took approximately four to five days to grow at 4° C. Crystals were cryo-protected with 22.5% PEG 1.5K, 22.5% ethylene glycol, 0.04–0.06 M MES/Acetate at pH 5.7 in a single step. For crystals at pH 6.3, 12–20 mg•ml−1 of protein were mixed one to one with the CO-flushed well solution to yield a final concentration of 20% PEG 4K and 0.1 M BisTris at pH 6.3. Crystals took approximately three to four days to grow at room temperature. Crystals were cryo-protected with 20% PEG 4K, 20% glycerol, and 0.1 M BisTris at pH 6.3 in a single step. For crystals at pH 8.0, 11.25 mg•ml−1 of CO-bound trout IV Hb mixed one to one with the CO-flushed well solution to yield a final concentration of 0.1 M Tris at pH 8.0 and 2.05 M ammonium sulfate. Crystals were cryo-protected step-wise with 2.05 M ammonium sulfate, 25% glycerol, and 0.1 M Tris at pH 8.0.
Crystals of the purified bovine Hb were grown at room temperature using the hanging drop method. For crystals at pH 5.7, 15 mg•ml−1 of CO-bound bovine Hb were mixed one to one with the CO-flushed well solution yielding a final concentration of 0.4 M sodium cacodylate at pH 5.7 and 12–15% PEG 3350. Crystals grew within 2 days and were cryo-protected in one-step with 12% PEG 3350, 20% glycerol, and 0.4 M sodium cacodylate at pH 5.7. For crystals at pH 6.3, 15 mg•ml−1 of CO-bound bovine Hb and mixed one to one with the CO-flushed well solution yielding a final concentration of 0.30–0.35 M sodium cacodylate at pH 6.3 and 12–17% PEG 3350. Crystals grew within 2 days and were cryo-protected in one-step with 12% PEG 4K, 20% glycerol, and 0.3 M sodium cacodylate at pH 6.3.
Refinement of hemoglobin structures
X-ray collection for perch Hb at pH 5.7, 6.3, and 8.0 were collected using the 19-BM beamline at the Advanced Photon Source (APS) at the Argonne National Laboratory (Argonne, IL) at a wavelength of 0.979 Å. Perch crystallographic data sets were integrated and scaled using HKL-2000 and Scalepack 18. Molecular replacement was done with AMoRe 19 using CO-bound trout Hb I with the same P212121 space group (PDB code 1OUU) for initial phases 20. Perch Hb was refined using REFMAC5 21 with TLS refinement 22 and manually fitted in COOT 23. Rfree was calculated by setting aside 5% of the diffraction data.
X-ray diffraction data were collected on the bovine Hbs at pH 5.7 and 6.3 in house using a Bruker AXS PROTEUM R detector and a Bruker AXS MICROSTAR generator (Bruker, Madison, WI). Scaling was completed in ShelX and molecular replacement was completed in AMoRe 19 using the CO-bound bovine Hb at pH 8.5 for initial phases. Refinement was carried out in REFMAC5 21 with TLS refinement 22 and manual fitting was performed in COOT 23. A CO-bound bovine Hb structure at pH 8.5 was published in 2000 24 and the same refinement methods were carried out on the pH 8.5 structure as the pH 5.7 and 6.3 structures. Structure factors from the CO-bound bovine Hb at pH 8.5 (PDB ID 1G0A) were downloaded and 5% were set aside for Rfree calculations. Refinement was carried out in REFMAC5 21 with TLS refinement 22 and manual fitting was performed in COOT 23. The resultant bovine Hb at pH 8.5 reduced the Rwork and Rfree to 15.7 and 20.6%, respectively.
X-ray diffraction data for the trout IV Hb structure at pH 8.0 were collected at the NE-CAT 8-BMB beamline at the APS. Diffraction data for the pH 6.3 structure were collected at the Life Sciences Collaborative Access Team (LS-CAT) Sector 21ID-D beamline at the APS; diffraction data were collected for the pH 5.7 structure at the LS-CAT Sector 21ID-D beamline at the APS. The crystallographic data for trout IV Hb at pH 8.0 were integrated and scaled using HKL-2000 and Scalepack 18,25. Previous research indicated a C212121 space group for trout IV Hb at pH 8.0, but a structure was unable to be solved 26. Instead, our data indicated a P21 space group and a reasonable molecular replacement solution was found using CO-bound trout Hb I in the P212121 space group (PDB code 1OUU, 20) for initial phases in MolRep 27. The model for trout IV Hb at pH 8.0 were refined and fitted using REFMAC5 21 and manually fitted in COOT 23. The Rfree remained high (Rfree ∼34.0%) and was used as a starting model for the pH 6.3 and 5.7 structures, but was not used in comparative analysis to the perch and bovine Hbs. The crystallographic data for trout IV Hb at pH 5.7 and 6.3 were integrated and scaled using HKL-2000 and Scalepack 18,25. A reasonable molecular replacement solution found using the CO-bound trout Hb IV Hb at pH 8.0 structure was used as the starting solution for initial phases in MolRep 27. Both were refined using REFMAC5 21 and manually fitted in COOT 23. The trout IV Hb structure at pH 6.3 also used TLS refinement 22. Rfree was calculated by setting aside 5% of the diffraction data.
Structure comparisons and overall solvent accessibility calculations
Structures were compared by calculating rmsd values between selected protein structures using VMD 28. Figures were prepared in PyMOL 29. The solvent accessible surface area of the heme and the total surface area of the protein contact to the heme structures were calculated using AREAIMOL 30. In the Hb structures, the propionates of the heme either make contact with other parts of the Hb surface or protrude to the solvent exterior. Thus, in order to minimize differences in surface area calculations due to propionate placement and look at the internal heme pocket, propionate atoms O1(A/D), O2(A/D), CG(A/D), and CB(A/D) were removed before calculations were made.
Determining hemin loss and autooxidation rates
Hemin loss rates at 25°C were measured by mixing the apoglobin form of H64Y sperm whale Mb with the oxidized forms of the fish and bovine holoHbs (10 uM) at pH 5.7, 6.3, and 8.0, and time courses for the uptake of hemin by the apoMb reagent were measured spectrophotometrically following previously published methods 31. Igor Pro software (WaveMetrics Inc., Portland, OR) was used to determine the rates of hemin loss by curve fitting using a double exponential function. Recombinant sperm whale H64Y apoMb was prepared as described in previous methods 32 and hemin was removed using the methyl ethyl ketone method 32,33.
The rate of metHb formation was determined from absorbance changes at 630, 576, and 560 nm as described previously 34. Samples were measured using reduced Hb in 200 mM Bis-Tris at pH 5.7 and 6.3 and in 200 mM Tris at pH 8.0 and contained 3 mmol of superoxide dismutase and catalase per mol of heme to remove any superoxide and hydrogen peroxide formation that occurs during metHb formation. Shikama and coworkers have shown previously that mammalian Hbs show biphasic time courses for autooxidation due to differences between the α and β subunits 35. Thus, all the autooxidation data were fitted to a two exponential expression. In many cases, the time course could have been fitted to a single exponential expression and one rate constant would be sufficient to describe the results. However, to be consistent with the previous human HbA results, we report two rates.
RESULTS AND DISCUSSION
Autooxidation and hemin loss rates
Perch and Trout Hbs have dramatic 30 to 80-fold higher autooxidation rates at both pH 5.7 and 6.3 compared to bovine Hb under the same conditions (Table I). In contrast, the fish Hbs autooxidize only about two times more rapidly than bovine Hb at pH 8.0. Bovine HbO2 at pH 5.7, 6.3, and 8.0 and the perch and trout IV HbO2s at pH 8.0 show only a single phase for autooxidation. A second phase could be present at pH 8.0, but at a rate that is too slow to be observed in the 24 hour time period that was examined. All three Hbs exhibit significantly larger rates of autooxidation as the pH was decreased. Perch Hb also has dramatic, ∼50-fold higher hemin loss rates at pH 5.7 and 6.3 compared to bovine Hb (Table II). The hemin loss rates from trout IV are 10 to 30-fold faster than bovine Hb at these low pH values. As in the case of autooxidation, all three animal Hbs generally show significantly larger rates of hemin loss as pH is decreased.
Table I.
Autooxidation rates (kox) of bovine, trout IV, and perch Hb (80 μM, heme basis). Rates were calculated at pH 5.7, 6.3, and 8.0. A fast rate, kf, and a slow rate, ks, are given. Measurements were made at 25° C.
| pH | Hb | kf (h−1) | ks (h−1) |
|---|---|---|---|
| 5.7 | Bovine | 0.016 ± 0.001 | 0.016 ± 0.001 |
| Trout IV | 0.45 ± 0.04 | 0.39 ± 0.01 | |
| Perch | 1.35 ± 0.08 | 0.64 ± 0.04 | |
| 6.3 | Bovine | 0.007 ±0.001 | 0.006 ± 0.001 |
| Trout IV | 0.13 ± 0.010 | 0.047 ± 0.005 | |
| Perch | 0.18 ± 0.003 | 0.065 ± 0.007 | |
| 8.0 | Bovine | 0.015 ± 0.002 | 0.003 ± 0.001 |
| Trout IV | 0.025 ± 0.003 | 0.007 ± 0.004 | |
| Perch | 0.033 ± 0.001 | 0.008 ± 0.001 |
Table II.
Hemin loss rates (kH−)of bovine, trout IV, and perch Hb (10 μM, heme basis). Hemin loss rates were measured at pH 5.7, 6.3, and 8.0. A fast rate, k−H(fast) , and a slow rate, k−H(slow), for each is listed. Measurements were made at 25° C.
| pH | Hb | k−H (fast, h−1) | k−H (slow, h−1) |
|---|---|---|---|
| 5.7 | Bovine | 0.32 ±0.001 | 0.015 ± 0.001 |
| Trout IV | 3.2 ± 0.05 | 0.014 ± 0.003 | |
| Perch | 13 ± 0.08 | 0.045 ± 0.006 | |
| 6.3 | Bovine | 0.20 ±0.01 | 0.010±0.001 |
| Trout IV | 5.5 ±0.02 | 0.033±0.023 | |
| Perch | 11 ±1.06 | 0.089±0.034 | |
| 8.0 | Bovine | 0.90 ± 0.001 | 0.014 ± 0.002 |
| Trout IV | 1.0 ± 0.39 | 0.16 ± 0.014 | |
| Perch | 1.7 ± 0.97 | 0.15 ± 0.20 |
X-ray crystallographic structural analysis
The Hb structures were solved in a variety of liganded states, at several pH values, and at various resolutions (see Tables III-V for X-ray crystallization statistics). Bovine Hb structures were solved in the metHb form at pH 5.7 and the CO-bound form at pH 6.3 and 8.5 (Table III) at resolutions between 1.75–2.05 Å. Trout IV Hb structures were solved in the met-Hb form at pH 5.7 and 6.3 (Table IV) at resolutions of 1.35 and 1.90 Å, respectively. The 1.35 Å trout IV metHb structure at pH 5.7 is one of the highest resolution Hb structures currently reported. Perch Hb structures were solved in the metHb form (Table V) at pH 5.7, 6.3, and 8.0 at resolutions between 1.90–2.10 Å. All contain one tetramer in the asymmetric unit and were solved using molecular replacement (Figure 2A).
Table III.
Crystallographic statistics for the refinement of bovine Hb at pH 5.7, 6.3 and 8.5. Statistics listed in parentheses are for those in reported in the last refinement shell listed in the resolution range.
| Bovine Hb | |||
|---|---|---|---|
| pH 5.7 | pH 6.3 | pH 8.5 | |
| Data Collection | |||
| Resolution range (Å) | 63.63–1.85 (1.90–1.85) |
63.63–1.75 (1.80–1.75) |
65.65–2.05 (2.10–2.05) |
| Space Group | P212121 | P212121 | P212121 |
| Unit cell dimensions a × b × c(Å) |
65.0 × 78.3 × 109.1 α=β=γ=90° |
65.0 × 78.3 ×109.2 α=β=γ=90° |
73.8 × 131.4 × 63.1 α=β=γ=90° |
| Unique reflections | 48,062 | 53,213 | 37869 |
| Completeness (%) | 99.6 (96.5) | 98.4 (83.5) | 96.9 (76.5) |
| Average I/σI | 24.3 (3.1) | 25.8 (2.0) | --- |
| Redundancy | 7.4 (3.7) | 7.9 (4.0) | --- |
| Ligand State | Met | CO-bound | CO-bound |
| Refinement Statistics | |||
| Rwork | 18.7 (25.1) | 17.7 (27.5) | 15.7 (16.2) |
| Rfree | 25.8 (33.9) | 22.5 (30.4) | 20.6 (21.9) |
| Average B-value (Å2) | 19.2 | 23.2 | 17.3 |
| Protein B-value (Å2) | 18.2 | 21.5 | 16.3 |
| Water B-value (Å2) | 26.4 | 34.8 | 35.1 |
| Heme B-value (Å2) | 16.5 | 24.8 | 19.8 |
| No. of atoms in assym. unit |
5317 | 5291 | 4835 |
| In most favored regions (%) | 93.1 | 93.1 | 93.3 |
| In allowed regions (%) | 6.9 | 6.9 | 6.7 |
| PDB ID | 2QSP | 2QSS | 1G0A |
Table V.
Crystallographic statistics for the refinement of perch Hb at pH 5.7, 6.3, and 8.0. Statistics listed in parentheses are for those in reported in the last refinement shell listed in the resolution range.
| Perch Hb | |||
|---|---|---|---|
| pH 5.7 | pH 6.3 | pH 8.0 | |
| Data Collection | |||
| Resolution range (Å) | 69.67–1.90 (1.95–1.90) |
70.01–2.00 (2.05–2.0) |
69.50–2.10 (2.16–2.10) |
| Space Group | P212121 | P212121 | P212121 |
| Unit cell dimensions a × b × c (Å) |
57.2 × 84.8 × 121.9 α=β=γ=90° |
57.6 × 85.0 × 123.2 α=β=γ=90° |
57.7 × 84.9 × 121.5 α=β=γ=90° |
| Unique reflections | 46,999 | 42,699 | 37,394 |
| Completeness (%) | 98.7 (84.5) | 96.3 (69.9) | 97.4 (86.8) |
| Average I/σI | 14.5 (3.1) | 16.2 (2.9) | 12.8 (3.3) |
| Redundancy | 8.3 (4.1) | 9.2 (4.0) | 5.9 (4.3) |
| Ligand State | Met | Met | Met |
| Refinement Statistics | |||
| Rwork | 18.5 (22.9) | 18.4 (21.9) | 20.4 (24.6) |
| Rfree | 23.0 (27.7) | 23.2 (31.1) | 25.2 (30.2) |
| Average B-value (Å2) | 17.6 | 23.0 | 29.8 |
| Protein B-value (Å2) | 15.1 | 21.6 | 28.6 |
| Water B-value (Å2) | 42.1 | 40.5 | 48.7 |
| Heme B-value (Å2) | 33.3 | 33.1 | 42.4 |
| No. of atoms in assym. unit |
4974 | 4950 | 4828 |
| Rmsd bond length (Å) | 0.017 | 0.021 | 0.014 |
| Coordinate error (maximum likelihood, Å) |
0.11 | 0.13 | 0.18 |
|
Ramachandran plot, residues |
|||
| In most favored regions (%) |
93.7 | 92.2 | 91.8 |
| In allowed regions (%) | 6.3 | 7.8 | 8.2 |
| PDB ID | 3BJ1 | 3BJ2 | 3BJ3 |
Table IV.
Crystallographic statistics for the refinement of trout IV Hb at pH 5.7 and 6.3. Statistics listed in parentheses are for those in reported in the last refinement shell listed in the resolution range.
| Trout IV Hb | ||
|---|---|---|
| pH 5.7 | pH 6.3 | |
| Data Collection | ||
| Resolution range (Å) | 78.57–1.35 (1.39–1.35) |
76.92–1.90 (1.95–1.90) |
| Space Group | P21 | P21 |
| Unit cell dimensions a × b × c (Å) |
57.5 × 63.2 × 78.7 α=γ=90°, β=93.1° |
57.1 × 63.0 × 77.0 α=γ=90°, β=92.2° |
| Unique reflections | 120,196 | 42,904 |
| Completeness (%) | 97.4 (78.3) | 98.6 (88.0) |
| Average I/σI | 16.0 (2.0) | 25.1 (2.7) |
| Redundancy | 7.0 (4.2) | 7.2 (5.2) |
| Ligand state | Met | Met |
| Refinement Statistics | ||
| Rwork | 17.0 (24.9) | 17.0 (21.9) |
| Rfree | 21.2 (26.5) | 22.0 (32.6) |
| Average B-value (Å2) | 20.2 | 21.3 |
| Protein B-value (Å2) | 17.7 | 19.6 |
| Water B-value (Å2) | 34.2 | 33.2 |
| Heme B-value (Å2) | 18.9 | 27.7 |
| No. of atoms in assym. unit |
5636 | 5139 |
| Rmsd bond length (Å) | 0.009 | 0.016 |
| Coordinate error (maximum likelihood, Å) |
0.04 | 0.11 |
|
Ramachandran plot, residues |
||
| In most favored regions (%) |
93.4 | 93.2 |
| In allowed regions (%) | 6.6 | 6.8 |
| PDB ID | 3BOM | 2R1H |
Figure 2.

(A) Tetrameric structure of bovine Hb at pH 5.7 (heme groups are shown in red). (B) Highlighted amino acid differences in the E helix and CD turn. The structure of the trout IV β subunit is shown. The amino acid residues listed in Table VI are highlighted in red and labeled. The C, D, E, and F helices and the CD turn are labeled along with the heme and proximal and distal histidine residues.
Trout IV and perch Hb α subunits are 54% and 56% identical in sequence to bovine Hb α, respectively, and 68% identical to one another. Trout IV and perch Hb β subunits both are 47% identical to bovine Hb β and 65% identical to one another. Although most differences are outside of the heme pocket, there are several significant residue changes in the heme pocket of the fish α and β subunits compared to bovine Hb subunits (Table VI and Figure 2B). The altered amino acid side chains have been shown to be important in regulating hemin loss and autooxidation rates in recombinant sperm whale Mb and human Hb model systems (Table VI) and provide a rational explanation for the higher rates of hemin loss and autooxidation of the fish Hbs. The following structural data indicate that there are four mechanisms by which autooxidation and hemin loss occur much more rapidly in fish Hbs compared to mammalian Hbs. These mechanisms are: (1) steric displacement of bound ligand(s); (2) weak anchoring of the heme propionates to the globin; (3) larger channels for solvent entry into the heme pocket; and (4) weakened interactions with the distal histidine.
Table VI.
Amino acid differences in the E helix and CD turn of bovine, trout IV and perch Hb. Amino acid (AA) changes are listed in the table for both the α and βs of each Hb. The known effects in oxidation (kox) and hemin loss (k−H) rates in sperm whale Mb and human Hb are listed. The appropriate references are cited.
| Residue position |
Bovine α/β AAs |
Trout IV α/β AAs |
Perch α/β AAs |
Known effect in Myoglobin or Hemoglobin |
Reference |
|---|---|---|---|---|---|
| E10 | K/K | T/T | T/T | 1.9 × decrease in kox with T67R Mb |
14 |
| E11 | V/V | I/V | I/I | 15 × increase in kox with V68I Mb |
14 |
| CD4 | F/F | W/F | W/F | 1.8 × increase in kox and 2.6 × increase in k−H with F46W Mb |
39,44 |
| CD3 | H/S | H/T | H/N | 10 × decrease in k−H, for β Ser(CD3)His mutation in HbA | 55 |
| E14 | A/S | N/G | G/G | Not documented | --- |
Steric hindrance of the bound ligand(s) by IleE11
The E11 side chain is in the distal portion of the heme pocket and part of the hydrophobic core that surrounds the heme near the ligand binding-site (Figure 2B). A Val is present at the E11 position in bovine and most other mammalian Hb α and β subunits and the trout IV β subunit. In contrast, an Ile is present at this position in trout IV α subunits and in both subunits of perch Hb (Table VI). A 15-fold increase in the rate of autooxidation occurred when ValE11 was replaced by Ile in sperm whale Mb 14. This increase was attributed to hindrance by the δ methyl group of Ile(E11), which is located much closer to the heme iron atom of the heme moiety than the γ methyl group of the shorter Val(E11) side chain 36. In the structure of IleE11 MbCO, the distance between the CO atoms and the end of sec-butyl side chain is small, ∼2.5 Å, indicating significant steric hindrance. Brantley et al. 14 suggested that this hindrance enhances displacement of both O2 and its protonated form, which increases the rate of autooxidation by the pathways shown in Figure 1.
In bovine HbCO α and β subunits, the γ2 methyl grop of ValE11 is 3.2-3.4 Å away from the bound ligand (Figure 3A–B). This distance is similar to that seen in various sperm whale MbCOs 37,38, indicating only modest steric hindrance. The distance between the bound ligand and the Val(E11) Cγ2 atom in trout IV β subunits is also 3.1 Å (Figure 3B). In contrast, when Ile(E11) is present in the perch Hb subunits and trout IV α, the distance between the Cδ atom of the sec-butyl side chain and the bound ligand is much shorter, 1.8 to 2.6 Å, indicating strong steric clashes with the bound ligand (Figure 3A–B). This increased steric hindrance creates disorder in the conformation of the E11 side chain and the geometry of the bound ligand (Figure 3A). The 0.6 Å difference between the two side chain to ligand distances in perch αCO chains is due to an alternate conformation of the Cδ atom of Ile (Fig. 3A, right panel). Even in the met structures of the perch Hb subunits and trout IV αHb at low pH, the edge of IleE11 side chain is sterically hindering the coordinated water (Figs. 3C and D). These structural data demonstrate that IleE11 in the Fish Hb subunits hinders the bound ligand to a much greater extent than ValE11, and thus, as in the case of the V68I Mb mutant, the presence IleE11 is expected to enhance the rate of •OOH dissociation and autooxidation, which is what is observed experimentally for the fish Hbs (Table VI and Figure 1).
Figure 3.
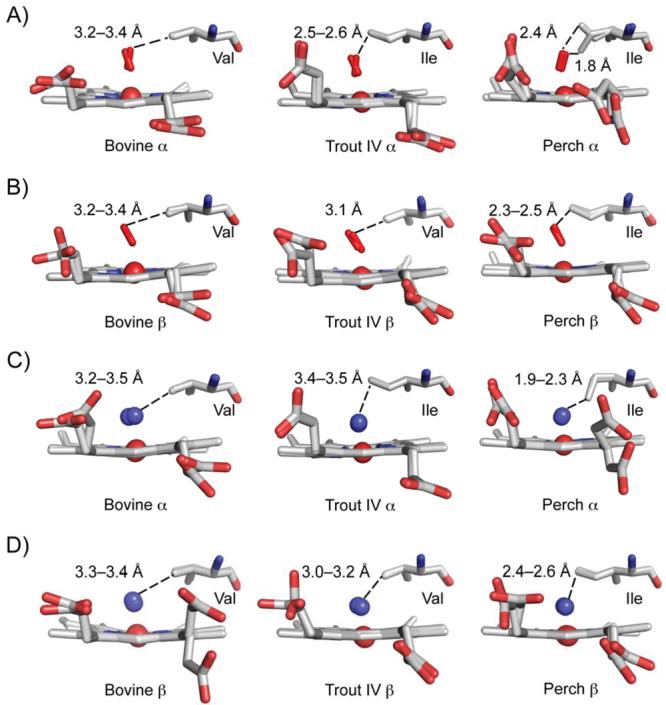
E11 positioning in the bovine, trout IV, and perch Hb. The CO-bound bovine at pH 8.5, the met-trout IV at pH 6.3, and the met-perch at pH 8.0 structures are shown for the A) α and B) β subunits. The CO-bound bovine at pH 8.5 was overlaid onto the trout IV and perch Hbs to place the CO (red) and calculate ligand distances to the E11 residue. The met-structure of the bovine, trout IV, and perch at pH 5.7 are shown for the C) α and D) β subunits with the water above the heme iron represented as a blue sphere. The E11 residues and distances to the ligand are listed for A–D). The two α and β subunits of each Hb structure were overlaid onto one another. The Ile in the perch α structure differs in conformation between the two α subunits.
Weak anchoring of the heme propionates by ThrE10 and α CE3 side chains in Fish Hbs
The E10 helical position is on the surface of the heme pocket near the distal His (Figure 2B). LysE10 in both bovine Hb subunits hydrogen bonds indirectly through a water molecule to the heme-7-propionate (Figure 4A). The HisE7 Nε-Owater distance is between 2.6–3.3 Å and the 7-propionate Oγ-Owater distance is between 2.4–2.8 Å. In contrast, the ThreE10 in both subunits of both fish Hbs are too short to hydrogen bond, either directly or indirectly through water molecule, to the 7-propionate (Figure 5). As a result there are no favorable electrostatic interactions of ThrE10 with the heme group, and as a result, the rate of hemin release is increased. Hemin loss rates have been shown to increase when hydrogen bonding to or favorable electrostatic interactions with the heme propionates are removed in sperm whale metMb 39.
Figure 4.

E10 Lys interactions with the distal His and heme propionate atoms in bovine Hb. A) The large positively charged portion of E10 interacts with the heme propionate oxygen atom and the distal His through separate water molecules in bovine Hb at pH 6.3 in the α subunit. B) E10 interacts directly with the distal His in the bovine Hb at pH 8.5 in the β subunit.
Figure 5.

Structural differences in the heme pocket of bovine, trout IV, and perch Hb. Structural differences of heme pocket residues are shown for the bovine Hb at pH 8.5, the trout IV Hb at pH 6.3, and the perch Hb at pH 8.0 are shown for the A) α and B) β subunits. The CO-bound bovine at pH 8.5 was overlaid onto the trout IV and perch Hbs to place the CO (in the red stick model). The residues are labeled accordingly and contact distances to the heme propionates are listed in black for the structures shown and in parentheses calculated using the structures at pH 5.7 for all three Hbs.
The CD3 residue is on the other side of the HisE7 side chain and can, if large and positively charged, interact favorably with the heme-6-propionate (Figures 2B and 5). The CD3 position is part of the turn between the C and D helices of β chains. Because α chains lack a D-helix, this position is called CE3 and, as in β subunits, this turn helps form the heme binding pocket in all globins. However, the distances from the Cα of this amino acid to the heme-6-propionate varies greatly between the three Hbs examined. In the α subunits of all three Hbs, a His is found at the CE3 position and has the potential to hydrogen bond to the carboxyl O atoms of the heme-6-propionate depending on the distance between the contact points. In bovine Hb, the distance between Nε of His(CE3) and the propionate O atom is 2.6–2.7 Å at pH 6.3 and 8.5 (Figure 5A), and comparable distances of 2.7–2.8 Å are seen in the structure of Trout IV metHb α chains at pH 5.7 and 6.3 (Figure 5A). In contrast, the HisCE3 Nε-O distance is between 3.2–4.7 Å in perch metHb at pH 6.3 and 5.7 (Figure 5A), which indicates little or no electrostatic stabilization of the heme-6-propionate. Previous studies with recombinant human HbA β subunits showed that SerCD3 cannot stabilize the heme-6-propionate and that the lack of this interaction is the major cause of the higher rate of hemin loss from human β subunits when compared to that for α subunits, which also have a HisCE3 that is close enough to stabilize electrostatically the heme-6-propionate group 40. Substituting β SerCD3 with His in human HbA decreases the hemin loss rate, k−H, over 10-fold (Table VI). This idea is supported by the 3 to 4-fold increase in the rate of hemin loss from sperm whale and pig Mb when ArgCD3 is replaced with Ser 39. Interestingly, HisCE3 in one of the α subunits of the bovine pH 5.7 swings out towards the solvent and is located 7.5 Å from the heme propionate (Figure 5A). This movement is almost certainly caused by the tendency of the distal His E7 to become protonated at low pH and swing out toward the solvent “pushing” the CE3 side chain outward and away from the propionate. This phenomenon has been documented for the ArgCD3 side chain in the structures of sperm whale Mb at low pH 41 and accounts in part for the much higher rates of hemin loss at low pH.
Larger channels for solvent entry into the heme pocket at β CD3 and by GlyE14
Increased access of water molecules to the heme pocket increases hemin release in myoglobin mutants 15. Similarly, increased access of solvent water molecules and hydronium ions to the heme pocket will increase autooxidation (Figure 1). The amino acid residue at the CD3 position in the β subunits varies amongst the three Hbs and none appear to be able to hydrogen bond to the heme-6-propionate O atoms (Figure 5B). However, the distance between the surface CD3 residue and the heme does differ among the three Hbs. The farther the residue is from the heme, the greater the opening that is created for water or hydronium cations to enter the heme pocket, facilitating autooxidation and hemin loss. In the high pH structures, the Ser CD3 O atom in bovine Hb is 4.8–5.3 Å away, the Thr CD3 O atom in trout IV Hb is 5.6–6.1 Å away, and the Asn CD3 Nδ in perch is 3.8–5.3 Å away from the nearest propionate oxygen atom (Figure 5B). These distances vary with pH (Figure 5B). At pH 5.7, this distance decreases to 3.9–4.4 Å in bovine Hb β subunits, increases to 5.6–6.6 Å in trout IV Hb β subunits, and to 7.0–9.0 Å perch Hb β subunits (Figure 5B). The perch and trout IV β subunit show greater distance from the terminal atom of the CD3 side chain to the heme-6- propionate O atom and therefore have a larger opening to the heme pocket at CD corner compared to bovine Hb at low pH.
The residue at the E14 helical position lies on the more interior side of the heme in comparison to the CD3 residue (Figure 2B). It is near a hydrophobic edge of the porphyrin ring, and depending on its size could expose the heme edge to solvent. When comparing 32 species of vertebrate hemoglobins, αE14 is Ala in each case whereas Ser is typically found at βE14 42. In bovine Hb, the E14 is an Ala in α subunits and a Ser in the β subunits. In trout Hb IV, the E14 α residue is an Asn and the β E14 residue is a Gly. In contrast, the perch Hb contains Gly at the E14 position in both subunits. The differences in the distance from the E14 Cα atom to the heme edge are 0.3 to 1.0 Å larger in the fish Hb subunits containing Gly at pH 5.7 than in the other animal subunits containing Ala, Ser, or Asn(Figure 5A–B). These comparisons indicate that the internal edges of the heme in trout IV βHb are more accessible to solvent than in perch and bovine βHb subunits at high pH. The presence of Gly at the E14 position could also facilitate unfolding of the E-helix in the fish Hbs at low pH, which would also facilitate autooxidation and hemin loss. However, these suggestions are speculative and Gly E14 mutations have not been examined systematically in recombinant Mb or Hb model systems.
Loss of favorable interactions between the distal histidine and ThrE10 and enhancement of steric interactions with TrpCD4
Hydrogen bonding of the distal His to bound O2 inhibits outward rotation of the imidazole side chain 37. This electrostatic interaction will also inhibit autooxidation by limiting access of solvent to the heme crevice, maintaining a relatively high oxygen affinity, and inhibiting protonation of the bound O2 (Figure 1). Likewise, hydrogen bonding of the distal His to coordinated water in oxidized Hb will decrease the rate of hemin loss 15,43. LysE10 in both bovine Hb subunits interacts directly or through a water molecule with HisE7, making the imidazole side chain a stronger hydrogen bond donor (Figure 4A and 4B). Trout IV and perch Hbs contain Thr at E10 in both the α and β subunits (Figure 5). ThrE10 cannot interact with HisE7 directly or indirectly because it is too far away for the imidazole side chain to donate a hydrogen bond to the imidazole side chain.
The PheCD4 residue has been shown to position the distal His at an optimal distance and angle for strong hydrogen bonding to bound O2 44. PheCD4 is a highly conserved residue in Mb and Hbs and is found in the β subunits of all of the Hbs examined and in bovine α subunits (Figure 5B). In the trout IV and perch α subunits the CD4 residue is a Trp (Figure 5A). Increasing the size of the CD4 amino acid to Trp increased the rates of autooxidation and hemin loss 2 to 3 fold in sperm whale Mb 39,44, presumably by sterically hindering the distal His and facilitating its outward movement creating greater access of the active site to solvent. In the perch and trout α subunits only small changes in position of the HisE7 are observed compared to bovine α subunits (Figure 5), and thus, the role that this large CD4 residue has in affecting autooxidation and hemin loss in the fish Hbs is not clear.
Role of oxygen affinity
Trout IV has a much lower O2 affinity at pH values around 6 compared to mammalian Hbs 45. This increase in P50 will accelerate the bimolecular autooxidation rate in the deoxyHb-mediated pathway (Figure 1) and can also partially explain the more rapid kox of trout IV compared to bovine Hb at pH 5.7 and 6.3 (Table I).
Reasons Perch Hb is especially susceptible to autooxidation and hemin loss
As noted above, α HisCD3 in trout IV is close enough to interact electrostatically with the heme-6-propionate whereas the distance is too large in the case at α HisCD3 in perch Hb (Figure 5A). Ile is present at E11 in both subunits of perch Hb compared to trout Hb IV, which only has a IleE11 in the α subunits (Table VI). It should be noted that substitution of ValE11 by Ile in human Hb α subunits produced only a small decrease in O2 affinity, whereas the IleE11 mutation in β subunits decreased O2 10-50-fold, indicating a significant steric hindrance of the bound ligand 46. Perch Hb also has the smaller GlyE14 residue in both subunits, which can further increase solvent access to the heme crevice whereas trout Hb IV has Gly only in β subunits. Also the channel for solvent entry at CD3 is larger in perch Hb β subunits compared to trout Hbβ IV at pH 5.7 (Figure 5B). The net results is that the perch Hb subunits have active sites which are more open to solvent and have more sterically hindered bound ligands, both of which should great accelerate both autooxidation and hemin loss as is observed.
Effect of pH
For all three hemoglobins, autooxidation and hemin loss rates increase dramatically and sharply as pH is decreased. The underlying cause of the pH dependence involves protonation of: (1) the distal His, which disrupts stabilization of the bound O2 and causes outward rotation of the imidazole side chain; (ii) bound O2, which allows dissociation of •OOH and formation of metHb; (iii) the proximal His, which breaks the coordination bond with the heme iron; (iv) the heme propionates, which disrupts favorable electrostatic interactions with amino acids at the E10 and CD3 positions. Thus, the pH dependence for spontaneous oxidative degradation of hemoglobin is steep and involves multiple ionizations. In the case of the fish hemoglobins, large rates of autooxidation and hemin loss persist at higher pH values in comparison to the corresponding rates for bovine Hb, indicating higher pKa values for protonation of HisE7, bound O2, HisF8, and the heme propionates in trout and perch Hbs. The pKa ascribed to HisF8 in sperm whale Mb is around 3.5, suggesting that this residue may be minimally protonated 47 even at pH 5.7, and in contrast, pKas of 5.0 and 5.5 were reported for the heme propionates in Mb and almost certainly play a role in accelerating both autooxidation and hemin loss 48.
Subunit differences and dimer formation
Hemin loss from tetrameric human hemoglobin (α2β2) is characterized by two distinct phases assigned to heme release from α chains (slow phase) and β chains (fast phase). Dilution of human Hb into the < 50 μM range causes substantial dissociation of the tetramer into dimers. Dilute Hb is likely relevant in biological tissues because erythrocyte lysis will result in a large decrease in hemoglobin concentration, and human Hb dimers have greatly increased rates of hemin loss and autooxidation 40.
Dilution to around 0.12 μM (heme basis) caused significant dissociation of trout IV Hb tetramers into dimers 45. Our hemin loss measurements were made at 10 μM hemoglobin (heme basis) and thus a small amount of dimers was probably present in the fish Hb solutions. However, the tetramer to dimer dissociation constant was estimated to be 3-fold less in trout IV Hb compared to human Hb 49. The tetramer to dimer dissociation constant of bovine HbO2 has not been measured, but if it were similar to that of human HbA, then more dissociation into dimers would occur than in the fish Hb samples. Thus, it seems unlikely that the much greater hemin loss rates for the fish Hb at pH 5.7 and 6.3 are due to dimerization; instead the enhanced rates appear to be due to the the amino acid replacements described Table VI.
The time courses for autooxidation of tetrameric human hemoglobin (α2β2) are also characterized by two distinct phases, assigned to autooxidation of the α chains (fast phase) and β chains (slow phase) 35. Human Hb dimers also autooxidize ∼ 6-fold more rapidly compared to tetramers 50. Thus, dimer formation, even in small amounts can contribute to kox 51. The dimerization constant (KD or K4,2) is ∼10−6 for fully oxygenated Hbs (R-state), around <10−10 for deoxyHb (T-state), and ∼10−5 for metHb 51,52. Our kox studies were done at 80 μM (heme basis), and thus, if bovine Hb has a dimerization constant similar to human HbA, αβ dimers may contribute to the observed rates of autooxidation. However, again Trout IV Hb is reported to have a 3-fold lower equilibrium constant for dimerization compared to human HbO2 (and presumbably bovine HbO2) and thus the dramatic differences between the fish and mammalian Hbs are unlikely to be due to dimer formation but rather to the amino acid differences at the solvent interface of the distal portion of the heme pocket.
It is clear that autooxidation accelerates hemin dissociation from all Hbs because apoglobins normally have a 60-fold lower affinity for hemin (Fe3+) than for heme (Fe2+) 9. It is also likely that hemin loss accelerates autooxidation in Hb tetramers because as each hemin dissociates, the resulting apoglobin subunit will tend to denature rapidly at room temperature and cause dissociation of the tetramer into less stable dimers and eventually monomers, 53 both of which are much more susceptible to autooxidation. Thus autooxidation accelerates hemin loss and vice versa. This cycle of events explains the observation that fish Hbs visibly precipitate at pH 5.7 and 6.3 with extended storage, whereas bovine Hb remains soluble. This rapid degradation of fish hemoglobins accounts for the high rate of fish meat deterioration due to lipid oxidation by the released free hemin, which in turn causes rancidity before any bacterial growth 32.
CONCLUSIONS
We initially thought that the overall solvent accessibility to the heme pocket could be higher in the perch and trout Hbs compared to bovine Hb in order to possibly account for the rapid oxidative degradation in the fish Hbs. However, the calculated solvent accessibilities are all relatively similar in the three Hbs studied (Table VII) and do not account for the dramatic 50 to 80-fold differences in autooxidation and hemin loss rates between the fish and bovine Hbs.
Table VII.
Surface area calculations of the heme accessible surface and the protein contact. Calculations were made for the various pHs of each Hb subunit structure and averaged between the α and β subunits.
| Hb | pH | Heme surface accessible area (Å2) |
Internal protein contact with heme (Å2) |
||
|---|---|---|---|---|---|
| α | β | α | β | ||
| Bovine | 5.7 | 75.2 | 95.0 | 469.5 | 429.8 |
| 6.3 | 72.8 | 93.9 | 445.1 | 427.4 | |
| 8.5 | 67.2 | 84.5 | 457.1 | 437.8 | |
| Trout IV |
5.7 | 82.7 | 99.5 | 423.1 | 432.2 |
| 6.3 | 82.0 | 100.4 | 418.0 | 417.6 | |
| Perch | 5.7 | 89.7 | 81.6 | 457.8 | 472.9 |
| 6.3 | 91.6 | 83.0 | 473.8 | 478.5 | |
| 8.0 | 81.6 | 74.7 | 475.7 | 474.0 | |
Instead, the five specific amino acid differences highlighted in Table VI are sufficient to explain the markedly increased rates of autooxidation and hemin loss in the fish Hbs compared to those for bovine and presumably most other mammalian Hbs. These differences in turn account for the higher rates of lipid oxidation in fish muscle tissue which, even in the absence of Mbs, are exposed to the animal's blood 54. A remaining puzzle is the selective pressure that has led to more stable mammalian Hbs with respect to oxidative degradation. This pressure may be related to the fact that fish erythrocytes are nucleated while mammalian erythrocytes are not 55. Because the fish erythrocytes can continuously synthesize Hb, there is almost certainly less selective pressure for their Hbs to be stable compared to mammalian Hbs. In fact, it may be advantageous to have a relatively rapid breakdown of oxyhemoglobin in those fishes with multiple Hb genes to allow changes in their relative amounts to meet the physiological needs of the animal.
ACKNOWLEDGEMENTS
This project was supported by National Research Initiative Grant no. 2002-35503-12671 and 2005-35503-16134 from the USDA Cooperative State Research, Education, and Extension Service Improving Food Quality and Value program and National Institutes of Health Grant 5 T32 GM08349. JSO is supported by NIH grants GM 35649 and HL 47020 and Grant C-0612 from the Robert A. Welch Foundation. GM/CA-CAT has been funded in whole or in part with Federal funds from the National Cancer Institute (Y1-CO-1020) and the National Institute of General Medical Science (Y1-GM-1104). Use of the LS-CAT Sector 21 was supported by the Michigan Economic Development Corporation and the Michigan Technology Tri-Corridor for the support of this research program (Grant 085P1000817). Use of the 19-BM SBC beamline and the Advanced Photon Source was supported by the U.S. Department of Energy, Basic Energy Sciences, Office of Science, under contract No. DE-AC02-06CH11357 (GM/CA-CAT, LS-CAT, SBC-CAT). We are appreciative of the access to crystallization equipment and X-ray facilities at the Center for Eukaryotic Structural Genomics at the University of Wisconsin-Madison and Drs. Craig A. Bingman and Eduard Bitto for their crystallographic support. We also thank Dr. Terence P. Barry for maintaining fish stocks and blood withdrawals.
REFERENCES
- 1.Alayash AI, Brockner Ryan BA, Eich RF, Olson JS, Cashon RE. Reactions of sperm whale myoglobin with hydrogen peroxide. Effects of distal pocket mutations on the formation and stability of the ferryl intermediate. J Biol Chem. 1999;274:2029–2037. doi: 10.1074/jbc.274.4.2029. [DOI] [PubMed] [Google Scholar]
- 2.Trent RJ, Webster B, Bowden DK, Gilbert A, Holl PJ, Lindeman R, Lammi A, Rowell J, Hinchcliffe M, Colley A, Wilson M, Saleh M, Blackwell J, Petrou V. Complex phenotypes in the haemoglobinopathies: recommendations on screening and DNA testing. Pathology. 2006;38(6):507–519. doi: 10.1080/00313020601027634. [DOI] [PubMed] [Google Scholar]
- 3.Umbreit J. Methemoglobin--it's not just blue: a concise review. Am J Hematol. 2007;82(2):134–144. doi: 10.1002/ajh.20738. [DOI] [PubMed] [Google Scholar]
- 4.Watanabe J, Chou KJ, Liao JC, Miao Y, Meng HH, Ge H, Grijalva V, Hama S, Kozak K, Buga G, Whitelegge JP, Lee TD, Farias-Eisner R, Navab M, Fogelman AM, Reddy ST. Differential association of hemoglobin with proinflammatory high density lipoproteins in atherogenic/hyperlipidemic mice. A novel biomarker of atherosclerosis. J Biol Chem. 2007;282(32):23698–23707. doi: 10.1074/jbc.M702163200. [DOI] [PubMed] [Google Scholar]
- 5.Grinshtein N, Bamm VV, Tsemakhovich VA, Shaklai N. Mechanism of low-density lipoprotein oxidation by hemoglobin-derived iron. Biochemistry. 2003;42(23):6977–6985. doi: 10.1021/bi020647r. [DOI] [PubMed] [Google Scholar]
- 6.Kanner J. Oxidative processes in meat and meat products: quality implications. Meat Sci. 1994;36:169–189. doi: 10.1016/0309-1740(94)90040-X. [DOI] [PubMed] [Google Scholar]
- 7.Harel S, Kanner J. Hydrogen peroxide-activated methaemoglobin and other methaemoproteins as initiators of membranal lipid peroxidation. In: Rotilio G, editor. Superoxide and superoxide dismutase in chemistry, biology, and medicine. Elsevier Science; New York: 1986. pp. 25–28. [Google Scholar]
- 8.Chan WKM, Faustman C, Yin M, Decker EA. Lipid oxidation induced by oxymyoglobin and metmyoglobin with involvement of H2O2 and superoxide anion. Meat Sci. 1997;46(2):181–190. doi: 10.1016/s0309-1740(97)00014-4. [DOI] [PubMed] [Google Scholar]
- 9.Tang Q, Kalsbeck WA, Olson JS, Bocian DF. Disruption of the heme iron-proximal histidine bond requires unfolding of deoxymyoglobin. Biochemistry. 1998;37(19):7047–7056. doi: 10.1021/bi9729413. [DOI] [PubMed] [Google Scholar]
- 10.Van der Zee J, Barr DP, Mason RP. ESR spin trapping investigation of radical formation from the reaction between hematin and tert-Butyl hydroperoxide. Free Radic Biol Med. 1996;20(2):199–206. doi: 10.1016/0891-5849(95)02031-4. [DOI] [PubMed] [Google Scholar]
- 11.Everse J, Hsia N. The toxicities of native and modified hemoglobins. Free Radical Biol Med. 1997;22:1075–1099. doi: 10.1016/s0891-5849(96)00499-6. [DOI] [PubMed] [Google Scholar]
- 12.Richards MP, Dettmann MA. Comparative analysis of different hemoglobins: autoxidation, reaction with peroxide, and lipid oxidation. J Agric Food Chem. 2003;51:3886–3891. doi: 10.1021/jf0212082. [DOI] [PubMed] [Google Scholar]
- 13.Richards MP, Modra AM, Li R. Role of deoxyhemoglobin in lipid oxidation of washed cod muscle mediated by trout, poultry and beef hemoglobins. Meat Sci. 2002;62:157–163. doi: 10.1016/s0309-1740(01)00242-x. [DOI] [PubMed] [Google Scholar]
- 14.Brantley RE, Smerdon SJ, Wilkinson AJ, Singleton EW, Olson JS. The mechanism of autooxidation of myoglobin. J Biol Chem. 1993;268:6995–7010. [PubMed] [Google Scholar]
- 15.Liong EC, Dou Y, Scott EE, Olson JS, Phillips GN., Jr. Waterproofing the heme pocket. J Biol Chem. 2001;276:9093–9100. doi: 10.1074/jbc.M008593200. [DOI] [PubMed] [Google Scholar]
- 16.Perutz MF. Preparation of haemoglobin crystals. J Crystal Growth. 1968;2:54–56. [Google Scholar]
- 17.Binotti I, Giovenco S, Giardina B, Antonini E, Brunori M, Wyman J. Studies on the functional properties of fish hemoglobins. II. The oxygen equilibrium of the isolated hemoglobin components from trout blood. Arch Biochem Biophys. 1971;142:274–280. doi: 10.1016/0003-9861(71)90284-0. [DOI] [PubMed] [Google Scholar]
- 18.Otwinowski Z, Minor W. Processing of x-ray diffraction data collected in oscillation mode. Methods in Enzymology. 1997;276:307–326. doi: 10.1016/S0076-6879(97)76066-X. Macromolecular Crystallography, part A. [DOI] [PubMed] [Google Scholar]
- 19.Navaza J. Implementation of molecular replacement in AMoRe. Acta Crystallogr D Biol Crystallogr. 2001;57(Pt 10):1367–1372. doi: 10.1107/s0907444901012422. [DOI] [PubMed] [Google Scholar]
- 20.Tame JR, Wilson JC, Weber RE. The crystal structures of trout Hb I in the deoxy and carbonmonoxy forms. J Mol Biol. 1996;259(4):749–760. doi: 10.1006/jmbi.1996.0355. [DOI] [PubMed] [Google Scholar]
- 21.Murshudov GN, Vagin AA, Dodson EJ. Refinement of macromolecular structures by the maximum-likelihood method. Acta Crystallogr D Biol Crystallogr. 1997;53(Pt 3):240–255. doi: 10.1107/S0907444996012255. [DOI] [PubMed] [Google Scholar]
- 22.Painter J, Merritt EA. Optimal description of a protein structure in terms of multiple groups undergoing TLS motion. Acta Crystallogr D Biol Crystallogr. 2006;62(Pt 4):439–450. doi: 10.1107/S0907444906005270. [DOI] [PubMed] [Google Scholar]
- 23.Emsley P, Cowtan K. Coot: model-building tools for molecular graphics. Acta Crystallogr D Biol Crystallogr. 2004;60:2126–2132. doi: 10.1107/S0907444904019158. [DOI] [PubMed] [Google Scholar]
- 24.Mueser TC, Rogers PH, Arnone A. Interface sliding as illustrated by the multiple quaternary structures of liganded hemoglobin. Biochemistry. 2000;39(50):15353–15364. doi: 10.1021/bi0012944. [DOI] [PubMed] [Google Scholar]
- 25.PROJECT CC The CCP4 Suite: Programs for Protein Crystallography. Acta Cryst. 1994;D50:760–763. doi: 10.1107/S0907444994003112. [DOI] [PubMed] [Google Scholar]
- 26.Dodson GG, Richard VR, Tolley SP, Waller DA, Weber RE. Crystallization of the rainbow trout (Salmo gairdneri) haemoglobin IV. J Mol Biol. 1990;211(4):691–692. doi: 10.1016/0022-2836(90)90069-X. [DOI] [PubMed] [Google Scholar]
- 27.Vagin A, Teplyakov A. MOLREP: an automated program for molecular replacement. J Appl Cryst. 1997;30:1022–1025. [Google Scholar]
- 28.Humphrey W, Dalke A, Schulten K. VMD: visual molecular dynamics. J Mol Graph. 1996;14(1):33–38. doi: 10.1016/0263-7855(96)00018-5. 27-38. [DOI] [PubMed] [Google Scholar]
- 29.DeLano WL. The PyMOL Molecular Graphics System. Palo Alto, CA; USA: 2002. [Google Scholar]
- 30.Lee B, Richards FM. The interpretation of protein structures:estimation of static accessibilty. J Mol Biol. 1971;55:379–400. doi: 10.1016/0022-2836(71)90324-x. [DOI] [PubMed] [Google Scholar]
- 31.Hargrove MS, Singleton EW, Quillin ML, Ortiz LA, Phillips GN, Jr., Olson JS, Mathews AJ. His64(E7)-->Tyr apomyoglobin as a reagent for measuring rates of hemin dissociation. J Biol Chem. 1994;269:4207–4214. doi: 10.2210/pdb1mgn/pdb. [DOI] [PubMed] [Google Scholar]
- 32.Grunwald EW, Richards MP. Studies with myoglobin variants indicate that released hemin is the primary promoter of lipid oxidation in washed fish muscle. J Agric Food Chem. 2006;54:4452–4460. doi: 10.1021/jf0603228. [DOI] [PubMed] [Google Scholar]
- 33.Ascoli F, Fanelli MR, Antonini E. Preparation and properties of apohemoglobin and reconstituted hemoglobins. Methods Enzymol. 1981;76:72–87. doi: 10.1016/0076-6879(81)76115-9. [DOI] [PubMed] [Google Scholar]
- 34.Benesch RE, Benesch R, Yung S. Equations for the spectrophotometric analysis of hemoglobin mixtures. Anal Biochem. 1973;55:245–248. doi: 10.1016/0003-2697(73)90309-6. [DOI] [PubMed] [Google Scholar]
- 35.Tsuruga M, Matsuoka A, Hachimori A, Sugawara Y, Shikama K. The molecular mechanism of autoxidation for human oxyhemoglobin. J Biol Chem. 1998;273:8607–8615. doi: 10.1074/jbc.273.15.8607. [DOI] [PubMed] [Google Scholar]
- 36.Quillin ML, Li T, Olson JS, Phillips GN, Jr., Dou Y, Ikeda-Saito M, Regan R, Carlson M, Gibson QH, Li H, et al. Structural and functional effects of apolar mutations of the distal valine in myoglobin. J Mol Biol. 1995;245(4):416–436. doi: 10.1006/jmbi.1994.0034. [DOI] [PubMed] [Google Scholar]
- 37.Aranda Rt, Levin EJ, Schotte F, Anfinrud PA, Phillips GN., Jr. Time-dependent atomic coordinates for the dissociation of carbon monoxide from myoglobin. Acta Crystallogr D Biol Crystallogr. 2006;62(Pt 7):776–783. doi: 10.1107/S0907444906017318. [DOI] [PubMed] [Google Scholar]
- 38.Kachalova GS, Popov AN, Bartunik HD. A steric mechanism for inhibition of CO binding to heme proteins. Science. 1999;284:473–476. doi: 10.1126/science.284.5413.473. [DOI] [PubMed] [Google Scholar]
- 39.Hargrove MS, Wilkinson AJ, Olson JS. Structural factors governing hemin dissociation from metmyoglobin. Biochemistry. 1996;35:11300–11309. doi: 10.1021/bi960372d. [DOI] [PubMed] [Google Scholar]
- 40.Hargrove MS, Whitaker T, Olson JS, Vali RJ, Mathews AJ. Quaternary structure regulates hemin dissociation from human hemoglobin. J Biol Chem. 1997;272:17385–17389. doi: 10.1074/jbc.272.28.17385. [DOI] [PubMed] [Google Scholar]
- 41.Yang F, Phillips GN., Jr. Crystal structures of CO-, deoxy- and met-myoglobins at various pH values. J Mol Biol. 1996;256(4):762–774. doi: 10.1006/jmbi.1996.0123. [DOI] [PubMed] [Google Scholar]
- 42.Fermi G, Perutz MF. In: Atlas of molecular structures in biology: Haemoglobin and myoglobin. Phillipis DC, Richards FM, editors. Clarendon Press; Oxford: 1981. p. 102. [Google Scholar]
- 43.Hargrove MS, Barrick D, Olson JS. The association rate constant for heme binding to globin is independent of protein structure. Biochemistry. 1996;35:11293–11299. doi: 10.1021/bi960371l. [DOI] [PubMed] [Google Scholar]
- 44.Lai HH, Li T, Lyons DS, Phillips GN, Jr., Olson JS, Gibson QH. Phe-46(CD4) orients the distal histidine for hydrogen bonding to bound ligands in sperm whale myoglobin. Proteins. 1995;22(4):322–339. doi: 10.1002/prot.340220404. [DOI] [PubMed] [Google Scholar]
- 45.Manning JM, Dumoulin A, Li X, Manning LR. Normal and abnormal protein subunit interactions in hemoglobins. J Biol Chem. 1998;273:19359–19362. doi: 10.1074/jbc.273.31.19359. [DOI] [PubMed] [Google Scholar]
- 46.Mathews AJ, Rohlfs RJ, Olson JS, Tame J, Renaud JP, Nagai K. The effects of E7 and E11 mutations on the kinetics of ligand binding to R state human hemoglobin. J Biol Chem. 1989;264(28):16573–16583. [PubMed] [Google Scholar]
- 47.Giacometti GM, Traylor TG, Ascenzi P, Brunori M, Antonini E. Reactivity of ferrous myoglobin at low pH. J Biol Chem. 1977;252(21):7447–7448. [PubMed] [Google Scholar]
- 48.Maman N, Brault D. Kinetics of the interactions of a dicarboxylic porphyrin with unilamellar lipidic vesicles: interplay between bilayer thickness and pH in rate control. Biochim Biophys Acta. 1998;1414(1-2):31–42. doi: 10.1016/s0005-2736(98)00149-7. [DOI] [PubMed] [Google Scholar]
- 49.Brunori M. Molecular adaptation to physiological requirements: the hemoglobin system of trout. Curr Top Reg. 1975;9:1–39. doi: 10.1016/b978-0-12-152809-6.50008-1. [DOI] [PubMed] [Google Scholar]
- 50.Griffon N, Baudin V, Dieryck W, Dumoulin A, Pagnier J, Poyart C, Marden MC. Tetramer-dimer equilibrium of oxyhemoglobin mutants determined from auto-oxidation rates. Protein Sci. 1998;7:673–680. doi: 10.1002/pro.5560070316. [DOI] [PMC free article] [PubMed] [Google Scholar]
- 51.Zhang L, Levy A, Rifkind JM. Autoxidation of hemoglobin enhanced by dissociation into dimers. J Biol Chem. 1991;266(36):24698–24701. [PubMed] [Google Scholar]
- 52.Hensley P, Edelstein SJ, Wharton DC, Gibson QH. Conformation and spin state in methemoglobin. J Biol Chem. 1975;250(3):952–960. [PubMed] [Google Scholar]
- 53.Hargrove MS, Olson JS. The stability of holomyoglobin is determined by heme affinity. Biochemistry. 1996;35:11310–11318. doi: 10.1021/bi9603736. [DOI] [PubMed] [Google Scholar]
- 54.Richards MP, Hultin HO. Contributions of blood and blood components to lipid oxidation in fish muscle. J Agric Food Chem. 2002;50:555–564. doi: 10.1021/jf010562h. [DOI] [PubMed] [Google Scholar]
- 55.Lund SG, Phillips MC, Moyes CD, Tufts BL. The effects of cell ageing on protein synthesis in rainbow trout (Oncorhynchus mykiss) red blood cells. J Exp Biol. 2000;203(Pt 14):2219–2228. doi: 10.1242/jeb.203.14.2219. [DOI] [PubMed] [Google Scholar]
- 56.Whitaker T. Residues controlling the function and stability of the CD corner in myoglobins and hemoglobins. Rice University; Houston, TX: 1995. Ph.D. dissertation. [Google Scholar]