

Abstract
We studied the organization of leg and trunk muscles into groups (M-modes) and co-variation of M-mode involvement (M-mode synergies) during whole-body tasks associated with large variations of the moment of force about the vertical body axis. Our major questions were: (1) Can muscle activation patterns during such tasks be described with a few M-modes common across tasks and subjects? (2) Do these modes form the basis for synergies stabilizing MZ time pattern? (3) Will this organization differ between an explicit body rotation task and a task associated with locomotor-like alternating arm movements? Healthy subjects stood barefoot on the force platform and performed two motor tasks while paced by the metronome at 0.7, 1.0, and 1.4 Hz: Cyclic rotation of the upper body about the vertical body axis (body rotation task), and alternating rhythmic arm movements imitating those during running or quick walking (arm movement task). Principal component analysis was used to identify three M-modes within the space of integrated indices of muscle activity. The M-mode vectors showed clustering neither across subjects nor across frequencies. Variance in the M-mode space across sway cycles was partitioned into two components, one that did not affect the average value of MZ shift ("good variance") and the other that did. An index was computed reflecting the relative amount of the "good variance"; positive values of this index have been interpreted as reflecting a multi-M-mode synergy stabilizing the MZ trajectory. On average, the index was positive for both tasks and across all frequencies studied. However, the magnitude of the index was smaller for the intermediate frequency (1 Hz). The results show that the organization of muscles into groups during relatively complex whole-body tasks can differ significantly across both task variations and subjects. Nevertheless, the central nervous system seems to be able to build MZ stabilizing synergies based on different sets of M-modes, within the approach accepted in this study. The drop in the synergy index at the frequency of 1 Hz, which was close to the preferred movement frequency, may be interpreted as corroborating the neural origin of the M-mode co-variation.
Keywords: synergy, whole-body rotation, principal component analysis, muscle mode, uncontrolled manifold analysis, human
Introduction
The control of large muscle groups has been addressed using the classical notion of multi-muscle synergies (Bernstein 1967). In all these studies, an assumption has been made that the central nervous system (CNS) manipulates a few variables to produce task-specific changes in many muscles (Krishnamoorthy et al. 2003a,b, 2004; Ivanenko et al. 2004, 2005; Ting and Macpherson 2005; Wang et al. 2005, 2006; Danna-Dos-Santos et al. 2007). Different matrix factorization techniques (d’Avella et al. 2003; Ivanenko et al. 2004, 2005; Tresch et al. 2006) have been used to identify such stable muscle groups addressed is some studies as “muscle synergies” (Ivanenko et al. 2004, 2005; Ting and Macpherson 2005) and in other studies as “muscle modes” (or M-modes, Krishnamoorthy et al. 2003a,b, 2004; Wang et al. 2005, 2006; Danna-Dos-Santos et al. 2007). The latter term reflects a view that the CNS creates synergies in a low-dimensional space of elemental variables (magnitudes of M-modes) to stabilize important mechanical variables (Scholz and Schoner 1999; reviewed in Latash et al. 2002, 2007; Latash 2008).
Several recent studies have confirmed that repetitive trials at a number of whole-body tasks (such as standing, swaying, and stepping) show co-variation of magnitudes of the M-modes compatible with a stable trajectory of such variables as coordinate of the center of pressure (COP, the point of application of the resultant force acting on the body from the support surface) and shear force magnitude (Krishnamoorthy et al. 2003; Danna-Dos-Santos et al. 2007; Robert et al. 2008). In this study, we focus on a different mechanical variable, namely the moment of force about the longitudinal axis of the body; for brevity, we will address it as MZ. Control of this variable may be important for a number of everyday actions associated with asymmetrical limb actions, for example locomotion or fast one-arm movements. Only a few studies have addressed issues of muscle coordination during large MZ changes (e.g., Aruin et al. 2001).
Recently, an observation has been made that some patients with spinal cord injury who cannot move their legs voluntarily, demonstrate alternating leg swings when they are asked to perform vigorous alternating arm movements while suspended using a parachute strap as well as while lying on the back with the legs suspended (Shapkova EYu 1997, 2003). These leg movements were associated with cyclic muscle activation changes. Such patterns were not observed when the patients rotated the upper body with the arms crossed on the chest, although they could emerge after several weeks of training. These findings were interpreted as reflecting activation of a hypothetical locomotion pattern generator at the lumbar spinal level via propriospinal pathways or via cyclically modulated reflexes from proprioceptors induced by the mechanical coupling of the body segments.
In this study, we explore multi-M-mode synergies involved in asymmetrical upper body actions. In particular, we have been interested in possible differences between the organization of muscle activation patterns during alternating bilateral arm movements (as during running or quick walking) and during upper-body rotation that does not involve arm movements. We focused on the following three hypotheses: (1) Muscle activation patterns during such tasks can be described with a few M-modes, consistent across persons; (2) These modes form the basis for synergies stabilizing MZ time pattern; and (3) This organization will differ between an explicit body rotation task and a task associated with alternating arm movements.
The first two hypotheses follow our earlier studies that showed sets of a few M-modes associated with tasks when the subjects were asked to control different mechanical variables such as coordinate of the center of pressure and shear force (Danna-Dos-Santos et al. 2007; Robert et al. 2008). In the cited studies, there were synergies stabilizing the time patterns of those mechanical variables based on co-varied involvement of the M-modes. In this study, we tested whether this principle of muscle organization works for tasks associated with MZ shifts.
Note that, in earlier studies, the M-mode composition was similar across the subjects and across a variety of tasks that involved such dissimilar actions as load release from extended arms, voluntary sway, and stepping (Krishnamoorthy et al. 2003; Wang et al. 2005; Danna-Dos-Santos et al. 2007). Hence, we did expect to see a common organization of M-modes across subjects and variations of each task, but not across the two tasks because one of them (arm movements) was expected to be associated with involvement of structures associated with locomotion, while the other one (body rotation) was not.
Methods
Subjects
Ten healthy subjects, 5 females and 5 males, mean weight 66.1 kg (2.5 SE), mean age 28.9 (2.6 SE) and mean height 174.2 cm (2.09 SE) participated in the experiment. All the subjects were healthy, without any known neurological or muscular disorder. All the subjects were right-handed based on their preferential hand usage during writing and eating. All the subjects gave informed consent based on the procedures approved by the Office for Research Protection of The Pennsylvania State University.
Apparatus
A force platform (AMTI, OR-6) was used to record the moment of force around the vertical axis (Mz). Disposable self-adhesive electrodes (3M Corporation) were used to record the surface electrical activity (electromyogram, EMG) of the following muscles from the right side of the body: gastrocnemius lateralis (GL), tibialis anterior (TA), biceps femoris (BF), semi-tendinosus (ST), vastus medialis (VM), rectus femoris (RF), tensor fasciae latae (TFL), gluteus maximus (GT), obliques abdominis (OA), rectus abdominis (RA), serratius (SER), lumbar erector spinae (ERL), and thoracic erector spinae (ERT). The electrodes were placed within the central part of the muscles bellies, with inter-electrode distance of 3 cm. A reference electrode was attached to the lateral aspect of the fibula on its distal portion. We recorded EMG signals from only one side of the body because our pilot studies had shown symmetrical muscle activation patterns in the right and left parts of the body with a 180° phase shift. Hence, recording homologous muscles from the two sides of the body seemed redundant. Given the limitation of the data acquisition system, we preferred to record more muscles from one side of the body rather than fewer muscles from both sides.
The signals from the electrodes were amplified (×3000) and band pass filtered (60–500 Hz). All the signals were sampled at 1000 Hz with a 12-bit resolution. A desktop computer (Gateway 450Mhz) was used to control the experiment and to collect the data using the customized LabView-based software (LabView-5 – National Instruments, Austin TX, USA).
Procedures
The experiment started with one control trial that was later used for normalization of the EMG signals (next section). In this trial, subjects were instructed to stand on the force plate quietly for ten seconds keeping the body vertical, with the arms crossed on the chest and looking at a stationary target placed 1.8 m in front of the subject at the eye level. Feet were kept parallel and apart 15 cm. This foot position was marked on the top of the force plate and reproduced across all the trials. Subjects were barefoot during the entire session.
Two main tasks were performed, namely (a) continuous whole body rotation around its longitudinal axis (Body rotation), and (b) alternating movements of the upper arms (Arm movement). Both tasks (body rotation and arm movement) were performed at frequencies of 0.7 Hz, 1 Hz, and 1.4 Hz. We selected these particular three frequencies because our previous work with anterior-posterior whole-body movements showed that the subjects were able to follow the pace set by the metronome within that range (Danna-Dos-Santos et al. 2007). Besides, 1 Hz is a frequency of comfortable locomotion and it is commonly used to study locomotor-like tasks such as stepping, walking, and cycling. Two other frequencies were chosen as visibly slower and faster than comfortable, but still achievable. An extra weight of 1 lb (mass of 0.45 kg) was added to both palms using fitness gloves (Cory Everson Fitness) to increase the mechanical effects of the arm movements. In order to perform the body rotation task subjects were asked to stand on the force platform keeping the same posture with arms crossed on the chest in such manner that the left hand hold the right upper arm and vice versa. Then, they were asked to start moving their body in a cyclic fashion about the vertical longitudinal axis under the pace of the metronome.
To prevent asymmetry and define the amplitude of body rotation a small laser pointer attached to the chest of the subjects was used. Two vertical lines marked on the wall, 1.8 m away in front of the subject, showed nominal targets for the body rotation. The targets were spaced to correspond to 120° of rotation of the laser pointer attached at the chest level. The subjects were instructed to perform a symmetrical, cyclic body rotation such that the pointer beam oscillated between the two targets. However, we did not insist that the subjects performed the task accurately and allowed them to use a comfortable movement amplitude (see the last section of Discussion). As a result, at the highest frequency (1.4 Hz) most subjects spontaneously decreased the amplitude of rotation to about 60–90 degrees to be able to follow the metronome. Subjects continuously rotated their body first moving the right shoulder forward and left shoulder backward such that the projected laser beam moved from the right vertical line to the left vertical line, then they rotate their body in opposite fashion moving their left shoulder forward and the right shoulder backward. We will refer to the first and last 50% of the cyclic movement as right shoulder forward and left shoulder forward phases, respectively.
During the second task (arm movement task) subjects stood on the force platform with the elbows flexed by about 100 degrees and performed alternating rhythmic arm movements. The subjects were instructed to imitate sprint running or sportive walking; the movements were performed primarily in the shoulder joints (60–100 degrees), some of the subjects also flexed and extended elbow joints (by about 10–20 degrees); there were no visible wrist or hand movements. The fingers were extended. The subjects were suggested a virtual target: Moving each hand between the face and hip levels.
Prior to data collection, during the familiarization period, subjects performed 1–2 trials under each movement frequency (0.7, 1.0 and 1.4 Hz) for each task; practice took about 5 min.
Each trial of the main series started with the subject standing upright quietly; then, the metronome was turned on, and the subject began performing the task paced by the metronome. Data collection started after 10 s of continuous movement and lasted for 30 s. One trial was performed for each of the six experimental conditions: two tasks (body rotation and arm movement) executed at three different frequencies (0.7, 1.0, and 1.4 Hz). Equal numbers of subjects started with the body rotation task and arm movement task; the order of movement frequencies within a task was selected at random. Rest periods of about 1 min were given between trials. The average duration of the experiment was thirty minutes; fatigue was not an issue.
Data processing
All signals were processed off-line using LabView-5 and MatLab 6.5 software packages. Signals from the force platform were filtered with a 20 Hz low-pass, second order, zero-lag Butterworth filter. For each experimental condition, twelve complete movement cycles were used for data analysis. The initiation (t0) and end of each cycle (t1) were defined by two consecutives peaks of Mz values. The duration of each cycle was time normalized such that the total duration of each cycle was always 100%. Mz values within each 1% window were averaged resulting in a sequence of 100 points representing the movement cycle.
EMG signals were first rectified and filtered with a 50 Hz low-pass, second-order, zero-lag Butterworth filter. Changes in muscle activation associated with Mz changes were quantified as follows. Rectified EMG signals were integrated over 1% time windows of the cycles (IEMG). In order to compare the IEMG indices across muscles and subjects, we corrected them by subtracting IEMG indices obtained during the quiet standing control trial and normalized them by the highest IEMG indices observed for each particular muscle and each particular subject across all the trials. Hence, the IEMG indices varied between 0 and 1.
Statistics
Methods used to: 1) define M-modes; 2) define the Jacobian (J matrix); and 3) perform the UCM analysis were similar to procedures described previously (Krishnamoorthy et al. 2003a,b; Wang et al. 2005; Danna-dos-Santos et al. 2007). Therefore, we only present here a brief overview of these methods.
Defining M-modes with principal component analysis (PCA)
For each subject and each experimental condition, the correlation matrix among the IEMG indices was subjected to PCA (using SPSS software) with Varimax rotation. The factor extraction was employed resulting in three factors for each subject. Factors number four and higher did not have significantly loaded muscle activation indices under any of the conditions.
We are going to address the first three factors as muscle modes (M-modes, M1, M2, M3,) and hypothesize that magnitudes of (gains at) the M-modes are manipulated by the controller to produce changes in Mz. In other words, M-modes represent unitary vectors in the muscle activation space that can be recruited by the controller with different magnitudes.
In order to investigate qualitatively the structure of each M-mode, we analyzed how the loadings of IEMG indices of activation of the recorded postural muscles were organized within each M-mode and how they were distributed among the M-modes. We considered a muscle as part of an M-mode when its loading had an absolute value equal or larger than ±0.50. We will refer to such cases as significant loadings.
In order to test the similarity of M-modes across the different frequencies of action (set by the metronome) and subjects, we used a method similar to the one introduced by Krishnamoorthy and colleagues (2003a). This method compares a group of vectors in the muscle activation space (for example, the M1 vectors for a given subject across all the action frequencies) to a central vector (similar to an average vector) representing another group of vectors (for example, the M2 vectors for another subject across the same action frequencies). The method tests an assumption that all vectors of the same number in all subjects and across all frequencies point in similar directions. In this case, cosine of the angle between a central vector and any vector of the same number is expected to be close to unity, while cosine of the angle between a central vector and any vector of a different number is expected to be close to zero. Absolute values of the cosines between the 13-dimensional M-mode vectors were used as a measure of closeness of their directions. These were further transformed into z-scores using Fisher’s z-transformation. Further, these values were averaged either across subjects or across frequencies.
Defining the Jacobian (J matrix) with multiple regression
Linear relations between changes in the magnitudes of M-modes ( M) and Mz shifts ( Mz ) were assumed to be linear and the corresponding multiple regression equations were computed over the 12 cycles performed by each subject and at each experimental condition. The coefficients in the regression equations were arranged in a Jacobian matrix (J):
The analysis was run over full cycles (100 intervals per experimental condition).
UCM analysis: Computing the synergy index
The uncontrolled manifold (UCM) hypothesis assumes that the controller manipulates a set of elemental variables to stabilize a value or a time profile of a performance variable (Scholz and Schöner 1999; reviewed in Latash et al. 2002, 2007). In our analysis, gains at M-modes play the role of elemental variables, while Mz shift represents the performance variable. Hence, we analyze the variance in the M-mode space at each phase of the movement cycle and compare its two components. One component of the M-mode variance (within the UCM, VUCM) is compatible with a stable, i.e. reproducible from cycle to cycle, value of the Mz (estimated as its average value at that phase of the cycle). The other variance component (orthogonal to the UCM, VORT) led to changes in the Mz values. VUCM and VORT were the main dependent variables used in this analysis. In lay terms, they correspond to “good variability” (VUCM that does not affect Mz computed for a certain time interval during the oscillation cycle) and “bad variability” (VORT that changes Mz).
To quantify the relative amount of the total variance that is compatible with stabilization of a particular Mz shift we used an index ( V) reflecting the difference between the variance within the UCM and orthogonal to the UCM. V was computed as:
where all variance indices are computed per degree of freedom; VTOT stands for total variance.
Results
Although we analyzed the data separately over the two half-cycles of the body movement corresponding to the Mz shifts (right shoulder forward and left shoulder forward), there were no significant effects of the Mz shift direction on any of the outcome measures. Therefore, for brevity, only results representing full Mz cycles will be reported; these results are representative for half-cycle analyses as well. This section is organized in the following way. First, the basic patterns of Mz changes and muscle activation are described. Further, the results of the PCA are presented, and M-modes are identified and analyzed. Finally, we describe the results of the UCM analysis applied to the data in the M-mode space.
Patterns of moment of force about the vertical axis (Mz) and muscle activity
Across all conditions, the subjects were able to execute the task under the pace of the metronome. The averages ± standard errors of the actual frequency of MZ changes for the body rotation task were 0.67 ± 0.01, 1.05 ± 0.01, and 1.30 ± 0.05 Hz, and for the arm movement task they were 0.70 ± 0.01, 1.07 ± 0.05, and 1.30 ± 0.02 Hz. A two-way mixed design ANOVA with factors Task (arm movement vs. body rotation) x Frequency (0.7, 1.0, and 1.4 Hz) showed significant effect for both factors Task (F[1,54]= 30.68, p<0.001) and Frequency (F[2,54]= 29.11, p<0.001). Tukey's pair-wise comparisons showed significant differences among the three nominal frequencies (p<0.05). There was no significant interaction (p>0.1).
Averaged across subjects peak-to-peak Mz values for both tasks and all three frequencies are shown in Figure 1. Note that subjects produced larger peak-to-peak changes in MZ during the body rotation task and at higher frequencies. For the body rotation task the average values of peak-to-peak Mz were 26.44 ± 2.65 Nm, 46.29 ± 6.07 Nm, and 61.74 ± 6.64 Nm (0.7, 1.0, and 1.4 Hz, respectively). For the arm movement task, they were 16.69 ± 1.62%, 29.33 ± 3.32%, and 34.41 ± 3.81% (for 0.7, 1.0, and 1.4 Hz, respectively). A two-way ANOVA showed significant effects of both Task (F[1,54= 25.16 p<0.001) and Frequency (F[2,54] = 18.47, p<0.01) without an interaction. The pair-wise comparisons showed significant differences across all three frequencies (p<0.05).
Figure 1.
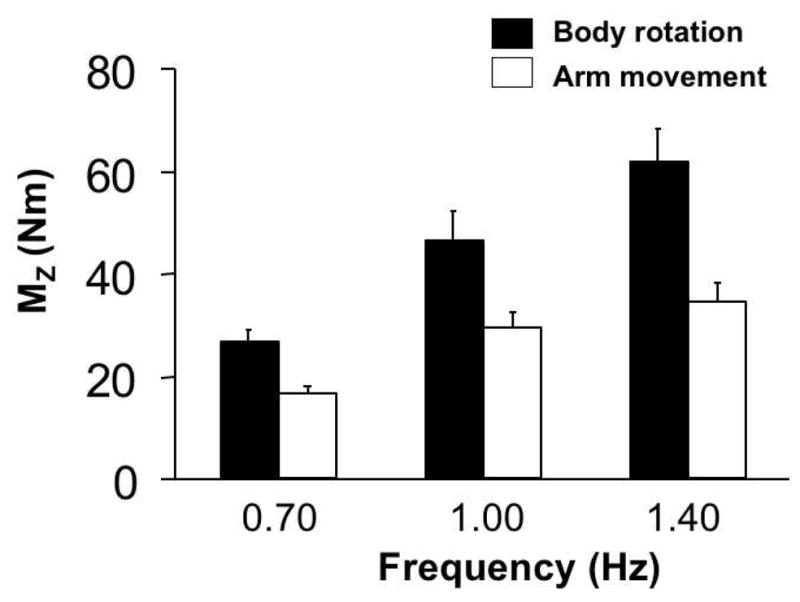
Peak-to-peak Mz values (means and standard errors across subjects) for the body rotation task (dark bars) and arm movement task (light bars) at different frequencies of body movement (0.7, 1.0, and 1.4 Hz).
During the execution of both tasks, all muscles showed larger levels of activation at higher movement frequencies. There were both significant variations and common features in the muscle patterns across the subjects. In particular, for the body rotation task, during the right shoulder forward part of the movement cycle (0 to 50%), there was a decrease in the level of activation of BF, ST, GT, OA, and SER and an increase in the activity of RF, VM, ESL, and ERT muscles. TA, and GL showed a decrease in activation level immediately followed by its increase during the first half of the movement cycle. Over the second half of the movement cycle (51 to 100%, left shoulder forward), the activation of RF, VM, ESL, and EST decreased while TA, GL, BF, ST, TFL GT, OA, and SER exhibited an increase in their activity. RA did not show reproducible across subjects changes in its activity over the movement cycle. This typical activation pattern for the body rotation task is illustrated in Figure 2. Figure 2 shows averaged EMG profiles across all the subjects for 8 postural muscles selected out of the set of 13 recorded during the execution of the body rotation task at 1.4 Hz.
Figure 2.

Integrated over each 1% of the cycle and normalized muscle activation indices (IEMG) averaged across subjects for the body rotation task performed at 1.4 Hz. Panels A-M show IEMG of all postural muscles recorded (TA – tibialis anterior, GL – gastrocnemius lateralis, RF – rectus femoris, VM – vastus medialis, BF – biceps femoris, ST - semitendinosus, TFL – tensor fascia latae, GT – gluteus maximus), RA – rectus abdominis, OA - obliques abdominis, SER - serratius, ERL - lumbar erector spinae, and ERT - thoracic erector spinae). Phases 0% and 100% indicate the ‘Right shoulder forward’ phase, and phase 50% indicates the ‘Left shoulder forward’ phase. The scales have been selected for optimal visualization.
The arm movement task also showed regularities in the patterns of activation of the leg and trunk muscles across the three frequencies. In particular, leg muscles commonly showed an increase in their activation over one of the two half-cycles followed by a period of very low activation. GL, RF, VM and TFL showed larger activation levels over the first half of the movement cycle (0 to 50%, right shoulder forward), while TA, BF, ST, and GT were more active over the second half (51 to 100%, left shoulder forward).The trunk muscles OA, SER and EST showed modulation of their level of activation within both halves of the movement cycle, while RA and SER did not show reproducible across subjects modulation patterns.
The muscle activation patterns during the arm movement task are illustrated in Figure 3 that shows averaged EMG profiles across subjects recorded during the execution of the movement at 1.4 Hz for the same 8 postural muscles as those illustrated in Figure 2. These Figures show a selection of activation profiles for muscles that showed deep within-the-cycle modulation, 1.4 Hz was selected to illustrate this modulation better. Because of the variability across the subjects and movement frequencies (see the next section), it was impossible to find a truly “representative” example.
Figure 3.

Integrated over each 1% of the cycle and normalized muscle activation indices (IEMG) averaged across subjects for the arm movement task performed at 1.4 Hz. Panels A-M shows IEMG of all postural muscles recorded. For the abbreviations and scales see the caption to Figure 3.
Principal component analysis (PCA)
To identify groups of muscles whose activity was modulated in parallel during the cyclic MZ changes, we used PCA (as described in the Methods). PCA was run on indices of integrated muscle activity combined over movement cycle duration and over 12 cycles, i.e. on the 1200 x13 IEMG matrix. Based on the criteria described in the Methods, the first three M-modes (M1, M2, and M3) were chosen for each data set. For the body rotation task the first three M-modes accounted, on average, for 67.94± 1.66, 68.71± 2.01, and 71.04± 1.71% of the total EMG variance for movements performed at 0.7, 1.0, and 1.4 Hz, respectively. For the arm movement task, the first three M-modes accounted, on average, for 66.17± 2.76, 68.45± 2.34 and 70.97 ± 2.19% of the total variance for movements performed at 0.7, 1.0, and 1.4 Hz, respectively.
The amount of variance accounted for by each M-mode varied across the experimental conditions. Specifically, for the body rotation task the first M-mode (M1) showed an increase in the amount of variance from the lowest (0.7 Hz) to the highest (1.4 Hz) frequency, while the variance accounted for by the third M-mode (M3) showed an opposite trend. This finding is illustrated in Figure 4 where the average amount of variance explained by each M-mode across the ten subjects is shown. Note that the black bars (M1) show an increase from 0.7 Hz to 1.4 Hz. while the striped bars (M3) show a drop in their values. This trend was confirmed by a two-way mixed-design ANOVA with factors M-mode (M1, M2, and M3), and Frequency which showed a significant M-mode × Frequency interaction (F[4, 81] = 7.79, p<0.001). In addition, a significant main effect of M-mode (F[2, 81] = 114.54, p<0.001) was also found. Tukey's pairwise comparisons showed significant differences in the amount of variance explained by all three M-modes (p<0.05 all comparisons). No significant effect of Frequency was found (F[2, 81] = 0.52, p>0.5).
Figure 4.
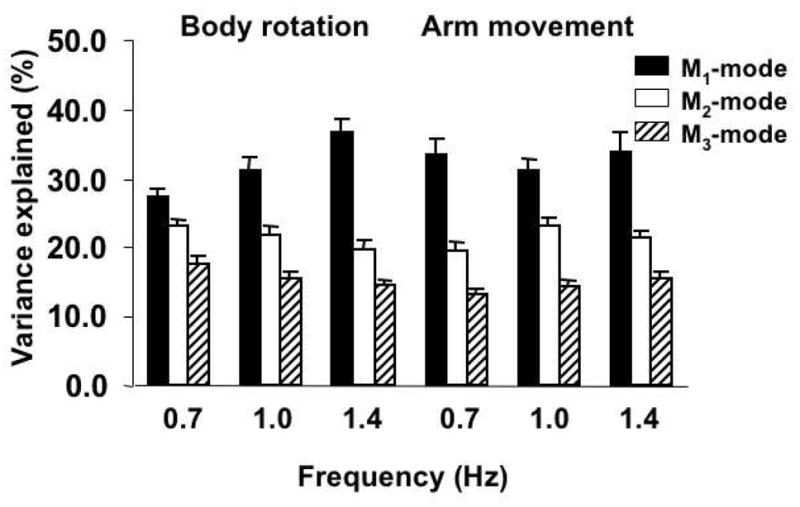
Amounts of variance explained by the three first principal components (M-Modes) for the body rotation task (first three set of bars) and for the arm movement task (last three set of bars). Averaged across subjects data are shown with standard errors. Different bars represent the amount of variance explained by the M1-mode (dark bars), M2-mode (white bars), and M3-mode (stripped bars). Note the increase in the variance explained by the M1-mode and a decrease in the variance explained by the M2- and M3- modes for the body rotation task (but not for the arm movement task) from the lower to the higher frequencies of movement.
For the arm movement task, the two-way mixed-design ANOVA with factors M-mode (M1,M2,and M3), and Frequency (0.7Hz, 1Hz, and 1.4 Hz) run on the amount of variance explained by each of the first three M-modes showed a significant effect only for the M-mode factor (F[2, 81] = 79.01, p<0.001). Tukey's pair-wise comparisons showed significant differences in the amount of variance explained by all three M-modes (p<0.05 all comparisons). No effect of Frequency (F[2, 81] = 1.36, p>0.1) nor M-mode × Frequency interaction (F[4, 81] = 0.69, p>0.5) were found.
The composition of individual M-modes varied substantially among the subjects. Table 1 exemplifies qualitative changes in the composition of M-Modes. This table shows a set of loadings obtained for a typical subject under the execution of both tasks at the three frequencies. Significant loadings are shown in bold. No reproducible pattern of distribution of the significant loadings could be found.
Table 1.
Typical PCA results
| BODY ROTATION TASK | |||||||||
|---|---|---|---|---|---|---|---|---|---|
| 0.7 Hz | 1.0 Hz | 1.4 Hz | |||||||
| M1 | M2 | M3 | M1 | M2 | M3 | M1 | M2 | M3 | |
| TA | 0.82 | −0.11 | −0.02 | 0.47 | −0.72 | 0.22 | −0.01 | −0.10 | 0.76 |
| GL | 0.73 | −0.11 | 0.18 | 0.84 | 0.12 | 0.03 | 0.26 | 0.24 | 0.70 |
| RF | −0.25 | 0.89 | 0.03 | −0.24 | −0.89 | −0.23 | −0.79 | 0.41 | −0.18 |
| VM | 0.01 | 0.88 | −0.08 | −0.17 | −0.83 | 0.10 | −0.50 | 0.60 | −0.19 |
| BF | 0.82 | −0.01 | −0.14 | 0.79 | 0.30 | 0.11 | 0.77 | −0.10 | 0.28 |
| ST | 0.76 | −0.57 | −0.04 | 0.71 | 0.43 | 0.48 | 0.87 | −0.08 | 0.35 |
| TFL | 0.66 | −0.53 | 0.04 | 0.73 | 0.11 | 0.39 | −0.02 | 0.77 | 0.02 |
| GT | 0.28 | −0.77 | −0.23 | 0.14 | −0.05 | 0.75 | 0.60 | 0.13 | 0.02 |
| RA | 0.15 | 0.27 | 0.77 | −0.44 | −0.17 | 0.60 | 0.01 | 0.12 | −0.69 |
| OA | 0.53 | −0.27 | 0.27 | 0.40 | 0.17 | 0.66 | 0.79 | 0.18 | −0.02 |
| SER | 0.61 | −0.65 | −0.07 | 0.58 | 0.39 | 0.64 | 0.92 | 0.11 | −0.13 |
| ESL | 0.09 | −0.32 | 0.65 | 0.59 | −0.17 | 0.03 | 0.15 | 0.69 | −0.02 |
| EST | −0.39 | 0.48 | 0.65 | −0.15 | −0.63 | −0.51 | −0.74 | 0.41 | 0.11 |
|
| |||||||||
| ARM MOVEMENT TASK | |||||||||
| 0.7 Hz | 1.0 Hz | 1.4 Hz | |||||||
| M1 | M2 | M3 | M1 | M2 | M3 | M1 | M2 | M3 | |
| TA | −0.81 | −0.13 | 0.17 | −0.83 | −0.34 | −0.13 | 0.60 | 0.63 | −0.37 |
| GL | 0.13 | 0.29 | −0.51 | 0.18 | 0.25 | −0.72 | −0.20 | 0.00 | 0.79 |
| RF | −0.07 | −0.05 | −0.72 | 0.42 | 0.27 | 0.81 | −0.69 | −0.52 | −0.31 |
| VM | −0.71 | 0.01 | −0.48 | 0.23 | 0.15 | 0.89 | −0.56 | −0.36 | −0.51 |
| BF | −0.91 | −0.20 | 0.17 | −0.82 | −0.48 | 0.07 | 0.60 | 0.69 | −0.29 |
| ST | −0.86 | −0.26 | 0.18 | −0.79 | −0.45 | −0.01 | 0.65 | 0.59 | −0.28 |
| TFL | −0.25 | −0.03 | 0.64 | −0.59 | 0.06 | −0.11 | −0.12 | 0.14 | −0.72 |
| GT | −0.69 | 0.01 | 0.05 | −0.81 | −0.11 | −0.10 | 0.36 | 0.66 | −0.23 |
| RA | 0.31 | 0.86 | −0.19 | 0.12 | 0.93 | 0.08 | −0.92 | −0.04 | −0.02 |
| OA | −0.28 | 0.73 | −0.18 | −0.62 | 0.46 | 0.05 | −0.15 | 0.86 | −0.01 |
| SER | −0.74 | 0.28 | 0.03 | −0.67 | −0.17 | −0.17 | 0.31 | 0.80 | 0.26 |
| ESL | −0.09 | 0.91 | 0.06 | 0.09 | 0.89 | 0.00 | −0.87 | −0.03 | 0.11 |
| EST | 0.35 | 0.89 | 0.03 | 0.42 | 0.81 | 0.04 | −0.79 | −0.37 | −0.10 |
Data for a typical subject for the body rotation and arm movement tasks at 0.7, 1.0 and 1.4 Hz. Loadings over 0.5 are shown in bold (significant loadings). TA-tibialis anterior, GL-lateral gastrocnemius, RF-rectus femoris, VM-vastus medialis, BF-biceps femoris, ST-semitendinosus, TFL- tensor fascia lata, GT-gluteus maximus, RA- rectus abdominis, OA-obliquos abdominis, SER-serratius, ESL- erectus spinae lumbar, ESL- erectus spinae thorax.
The data summarizing the total number of significant loadings observed in each M-mode for all ten subjects are shown in Figure 5. Note that for the body rotation task the first M-mode (M1) showed an increase in the total number of significant loadings from the lowest (0.7 Hz) to the highest (1.4 Hz) frequency, while the third M-mode (M3) showed an opposite trend. For the arm movement task this trend was not observed. Non-parametric tests run for each of the tasks showed similar results across the two tasks. Friedman’s test performed with factors M-mode and Frequency showed overall significance for both tasks (χ2[2]= 6.00, p<0.05). Kruskal-Wallis tests run as post-hocs confirmed a significant effect of M-mode but not of Frequency for both tasks. Mann-Whitney tests showed significant differences across the three M-modes.
Figure 5.
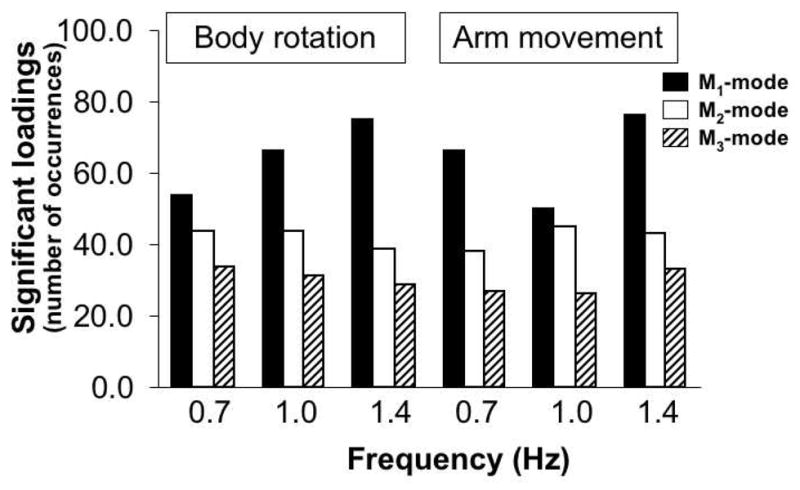
The total number of significant loadings of the indices of muscle activation for each M-mode for all ten subjects under the execution of the body rotation task, and arm movement task at different frequencies of body movement (0.7, 1.0, and 1.4 Hz). Note an increase in the number of significant loadings for the M1-mode and a decrease for the M2- and M3- modes for the body rotation task from the lower to the higher movement frequency. Note that this trend is not present at the execution of the arm movement task.
As described in Methods, we used absolute values of the cosines between M-modes in the muscle activation space as a measure of similarity. Computations were performed separately for the body rotation and arm movement tasks. For each task, cosines between central vectors, pi, and each individual M-mode vector were computed and compared across the three frequencies and across subjects. For this purpose, the absolute cosine values were transformed into z-scores. Figure 6 shows the mean z-scores of cosines for analysis across the action frequencies for the body movement task (Figure 6A) and arm movement task (Figure 6B). For both tasks, z-scores computed for cosines of the angles between a central vector and individual vectors representing the same M-mode were similar to those computed for cosines of the angles between the central vector and individual vectors representing other M-modes. In other words, vectors representing individual M-modes were not clustered close to each other.
Figure 6.
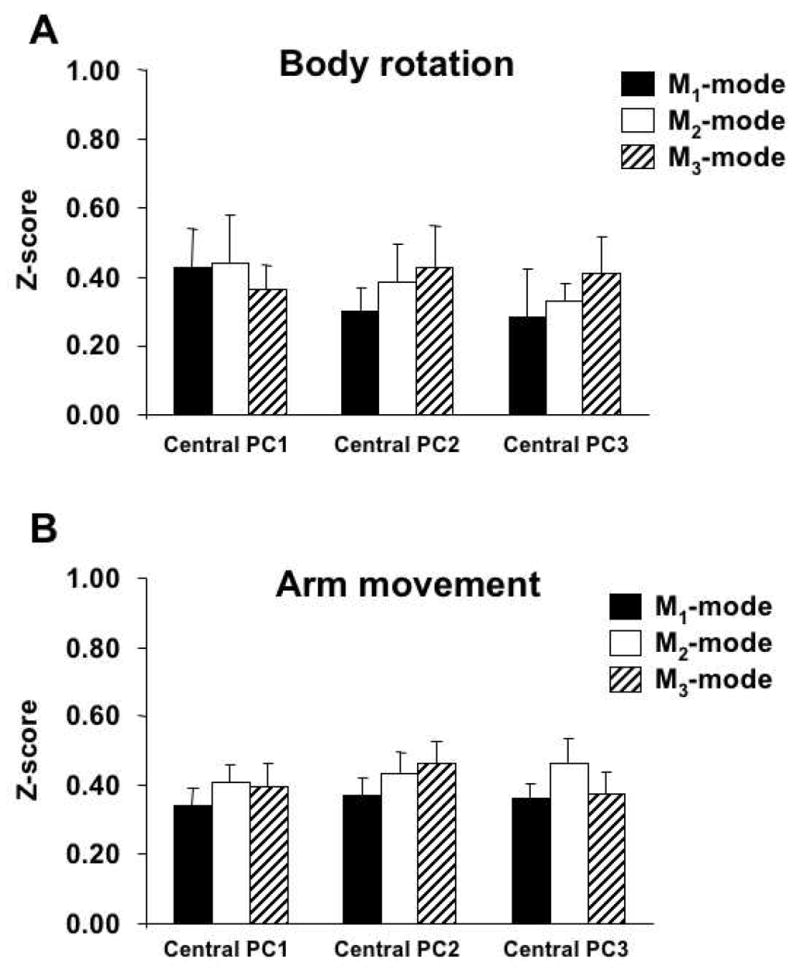
Averages and standard errors of z-scores of the absolute values of cosines between a central vector, pi, and each mode vector for the body rotation (A) and arm movement tasks (B); the data were averaged across movement frequencies.
Two-way mixed-design ANOVA with factors M-mode (M1, M2, and M3) and Central Vector (p1, p2 and p3) was used separately on the z-scores for the body rotation and arm movement tasks. The ANOVA revealed no significant effects of M-mode (p>0.1 for both tasks) and of Central Vector (p>0.1), and no significant interaction (p>0.1).
A similar pattern was found for analysis across subjects. Figure 7 is organized similarly to Figure 6 but it presents data for the three frequencies separately. Results for the body rotation task are presented in panels A, C and E, while results for the arm movement task are presented in panels B, D and F. Note similar z-scores for cosines of the angles between a central vector and individual vectors of all three M-modes. Hence, the individual M-mode vectors did not cluster around their central vectors. Three-way ANOVAs with factors Frequency (0.7, 1.0, and 1.4 Hz), M-mode (M1, M2, and M3) and Central Vector (p1, p2 and p3) showed no significant effects.
Figure 7.

Averages and standard errors of z-scores of the absolute values of cosines between a central vector, pi, and each mode vector for the body rotation (panels A, C, and E) and arm movement tasks (panels B, D, and F) under different frequencies.
Taken together, these findings show the lack of similarity of M-mode composition in the muscle space across both subjects and frequencies for both tasks.
UCM analysis
Data from twelve consecutive cycles for each of the five experimental conditions were used to perform analysis of the structure of variability in the space of M-modes. The method partitions the total variance in the M-mode space across cycles into two components. The first component (VUCM) is within an uncontrolled manifold (UCM) approximated as the null-space of the corresponding J matrix describing the linear relations between changes in the magnitude of M-modes ( M) and Mz shifts ( Mz) (see Krishnamoorthy et al. 2003a,b; Wang et al. 2005; Danna-dos-Santos et al. 2007). The other component (VORT) is within a sub-space orthogonal to the UCM. Further, we computed an index ( V) reflecting the normalized difference between VUCM and VORT. We interpret positive values of V as reflecting a multi-M-mode synergy stabilizing the average Mz shift.
The J matrix was computed using multiple linear regression of changes in the magnitudes of M-modes ( M) against Mz shifts ( Mz) over the 12 cycles performed by each subject, for each experimental condition separately. The coefficients in the regression equations were arranged into a 3x1 vector-column (J matrix) and it null-space was used to approximate the uncontrolled manifold.
For the body rotation task the average amount of variance explained was 69.49 ± 6.30%, 87.61 ± 3.92%, and 81.60 ± 5.69% (for 0.7, 1.0, and 1.4 Hz, respectively). For the arm movement task, these values were 59.89 ± 8.04%, 70.86 ± 5.29%, and 62.00 ± 5.00%. Note that the amount of variance is higher for the body rotation task under all three frequencies when compared to the averages for the arm movement task. A two-way repeated measures ANOVA with factors Task and Frequency run on the amount of variance explained by the linear model confirmed a significant effect of Task (F[1, 54] = 16.60, p<0.001) but not of Frequency (F[2, 54] = 1.69, p>0.1). No significant interaction was found (F[2, 54] = 1.23, p>0.1).
On average, VUCM values were similar for the two tasks. These results are displayed in Figure 8A, which shows the VUCM and VORT indices per degree-of-freedom averaged across all ten subjects. Note that the VUCM values for the body rotation task (black bars) are close to those for the arm movement task (white bars). VORT values were also similar for the two tasks (Figure 8B). For both tasks, on average, VUCM was consistently larger than VORT for all three frequencies studied. These findings were confirmed by a three-way mixed-design ANOVA with factors Task, Frequency, and Variance-Component (VUCM and VORT) run on the values of variance. This ANOVA confirmed a significant effect of Variance-Component (F[1, 108] = 21.41, p<0.001) without any other effects (p > 0.1).
Figure 8.

Panels A and B: Averaged across subjects components of variance, VUCM (dark bars) and VORT (light bars), for each condition (with standard error bars). Panel C: Means and standard errors for the V index across subjects. Note that all the ΔV values are positive.
To test whether the two variance components changed similarly across the conditions, an index (ΔV) reflecting their normalized difference was used (Figures 8C). On average, V was larger than zero for both tasks and all three frequencies studied. We also found that V was smaller for both tasks for the frequency of 1 Hz. Note that in Figure 8C, both black and white bars show lower V values when both tasks were performed at 1 Hz. These findings were confirmed by a two-way repeated-measures ANOVA with factors Task and Frequency on V values. There was a significant effect of Frequency (F[2, 54] = 3.43, p<0.5), but not of Task (F[1, 54] = 0.00, p>0.5) without an interaction.
Time changes of ΔV for both tasks and all three frequencies are shown in Figure 9. In general, no clear pattern of ΔV modulation within the movement cycle was found for both tasks at the lowest and highest movement frequencies (0.7 and 1.4 Hz). This finding is illustrated in Figure 9A and 9B where averages across subjects of ΔV index time profiles are presented. Note that in both panels the dark and gray thick lines representing ΔV time profiles for body movements executed at 0.7 and 1.4 Hz do not show visible modulation. In contrast, ΔV was mdoulated over the cycle when both tasks were performed at 1 Hz (the thin line). For the body rotation task (Figure 9A) this drop occurred during the second half of the movement cycle while for the arm rotation task (Figure 9B) this drop was during the first 50% of the movement cycle.
Figure 9.
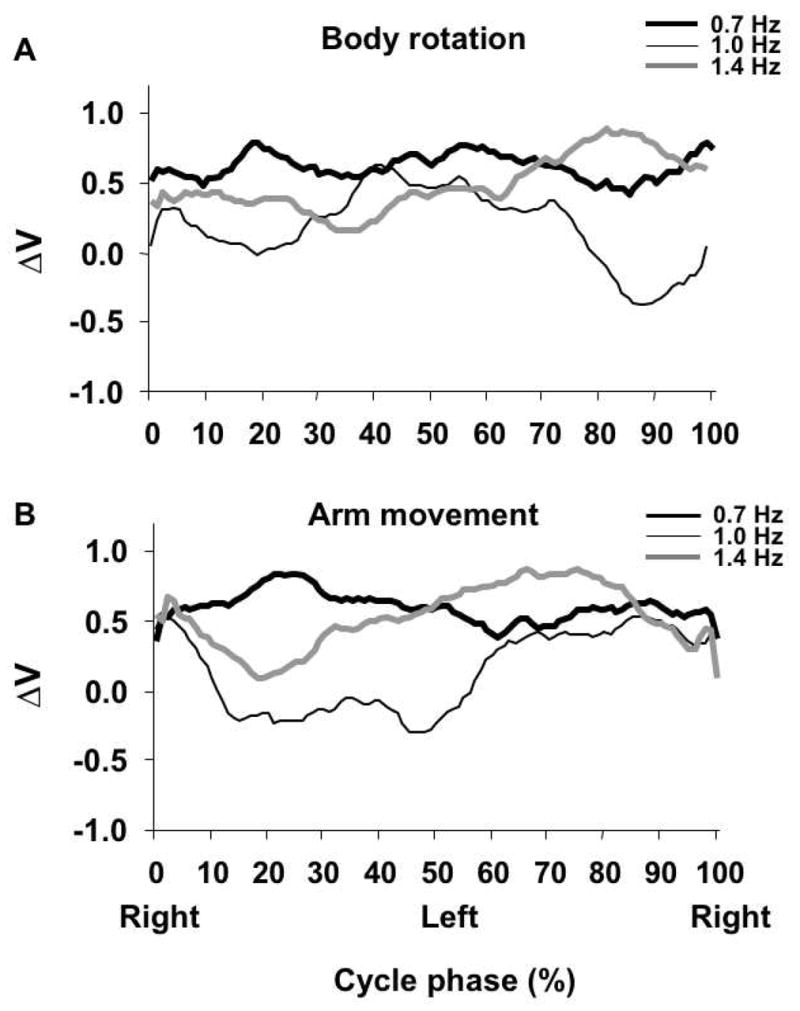
Time profiles of V averaged across subjects over the cycle of body rotation task (A) and arm movement task (B). Thick dark, thin dark, and thick gray lines represent the three movement frequencies. Note that at 1 Hz there is a consistent modulation of V over the cycle. Phases 0% and 100% indicate the ‘Right shoulder forward’ phase, and phase 50% indicates the ‘Left shoulder forward’ phase.
Discussion
The results of this study have provided an unexpected set of answers to the hypotheses formulated in the Introduction. With respect to the first hypothesis, muscle activation patterns during both tasks could indeed be described with a set of three M-modes; however, these sets were not consistent across the participants. Moreover, they were not consistent within each participant across the different frequencies of movement. This finding contrasts results of several earlier studies that explored M-modes across a broad variety of tasks associated with shifts of the center of pressure. Those tasks involved load release from extended arms, quick arm extension, voluntary body sway, making a step, and performing rather unusual whole-body movements (Krishnamoorthy et al. 2003; Wang et al. 2005; Danna-Dos-Santos et al. 2007; Robert et al. 2008); typical magnitudes of the center of pressure shifts varied within a very broad range, from 1 mm to 10 cm. Despite all these differences, the composition of the M-modes was similar across all the cited studies and across the subjects. As compared to the variety of all the cited studies, the tasks in the current study looked very similar and the range of MZ shift was much more modest. Therefore, we view the lack of consistent sets of M-modes as very unexpected.
The second hypothesis has been confirmed: The sets of three M-modes formed the basis for synergies stabilizing MZ time patterns across both tasks and all three frequencies. We found no evidence to support the third hypothesis: Both the organization of M-modes and the M-mode co-variation indices did not differ significantly between the two tasks. In the rest of this section, we discuss the findings and their implications for the two-level hierarchical control of whole-body actions.
Different Sets of M-modes as the Basis for M-mode Synergies
Recently, studies of whole-body actions have been dominated by an idea that the central nervous system (CNS) manipulates a handful of variables that correspond to very stable and reproducible patterns of recruitment of individual muscles both across subjects and tasks (d’Avella et al. 2003; Krishnamoorthy et al. 2003a; Ivanenko et al. 2004; Danna-Dos-Santos et al. 2007; Torres-Oviedo and Ting 2007). In particular, these studies have reported similar directions of the eigenvectors in the muscle activation space across subjects and tasks (Krishnamoorthy et al. 2003a; Danna-Dos-Santos et al. 2007). Recent studies of locomotion and responses to postural perturbations have also resulted in a handful (five to six) of “muscle synergies” that were similar across the participants and conditions (Ivanenko et al. 2004; Torres-Oviedo et al. 2006; Torres-Oviedo and Ting 2007).
The results of this study illustrate limitations of such a simplified approach to the control of large muscle groups. We used a method of analysis of similarity of the directions within the groups of eigenvectors (M-modes) in the muscle activation space identical to the one used earlier (Krishnamoorthy et al. 2003a). However, the results were opposite: We did not find clustering of the eigenvectors corresponding to the same M-modes in different subjects or across different tasks within a subject. In fact, the composition of the M-modes was vastly different across both subjects, tasks, and movement frequencies such that no common features of the M-modes could be identified that would be comparable to the “push-back”, “push-forward”, and “co-contraction” M-modes reported in earlier studies (Krishnamoorthy et al. 2003b, 2004; Danna-Dos-Santos et al. 2007).
Despite the different composition of the M-modes, all the subjects showed co-variation of the gains at which the M-modes were recruited across movement cycles that helped stabilize the average MZ trajectory. These results exemplify an important feature of motor synergies, namely their flexibilty (Latash et al. 2007), that is, an ability to organize co-variation of elemental variables at a higher hierarchical level of control in a task-specific way while possibly manipulating sets of different elemental variables (M-modes).
We can only speculate why the M-mode composition results of this study are qualitatively different from results of earlier studies that used similar data processing techniques for different tasks performed by standing persons. It may well be that the M-mode composition was significantly affected by the exact orientation of the vertical axis of the body. To make the tasks natural, we did not insist that the subjects stood in a very rigid manner. This might lead to deviations of the vertical body axis from the gravity line both across subjects and across trials resulting in different patterns of muscle recruitment. Most muscles analyzed in our study generated joint torques in a sagittal plane such that a disbalance between the action of the muscles on the left and right sides of the body was the likely cause of MZ changes. The unavoidable migration of the center of pressure (postural sway) about different locations (cf. Zatsiorsky and Duarte 1999; Duarte and Zatsirosky 1999) might also contribute to changes in muscle activation patterns across subjects and conditions.
Synergies as Reflection of Neural Control
Motor patterns during cyclic tasks reflect an interaction between neural control signals and mechanical properties of the moving effector, in particular its natural frequency (reviewed in Kugler and Turvey 1987). In particular, experiments with the reconstruction of hypothetical control signals within the equilibrium-point hypothesis (EP-hypothesis, Feldman 1986) framework during elbow cyclic movements have shown that the peak-to-peak excursions of the equilibrium trajectory were minimal at an intermediate frequency corresponding to the estimated natural frequency of the lower arm (Latash 1992). In other words, the CNS has to interfere minimally with an ongiong motion if its frequency fits the natural frequency of the moving effector. One of the results of our current study fits this general idea: During both tasks, the index of M-mode co-variation was the smallest at the intermediate frequency (1 Hz) as compared to both the lower (0.7 Hz) and the higher (1.4 Hz) frequencies.
Synergies have been defined as neural organizations of elemental variables with the purpose to stabilize a value or a time profile of a performance variable (reviewed in Latash et al. 2002, 2007). This definition implies, in particular, that the index of synergy (ΔV) is not expected to be highly positive if motion is to a large degree defined by the mechanical properties of the effector, without much intervention from the controller. This may be expected if the motion happens at the effector’s natural frequency. As a pilot post-hoc, we asked three subjects of this study to perform both tasks (arm movement and body rotation) at a comfortable self-selected frequency. They all performed these movements at frequencies within the 1–1.2 Hz range. Note that several studies have shown that self-selected frequencies are typically close to the natural frequencies for the effectors (Hatsopoulos and Warren 1996; Goodman et al. 2000; Yu et al. 2003). Hence, we offer the following interpretation for the significantly lower ΔV indices for the two tasks.
When the movement is performed at its natural frequency, changes in muscle activations, both within the explicitly involved effectors and in the apparently postural muscles, reflect movement mechanics and the action of reflex loops. Neural commands to the muscles and joints (for example, λ(t) functions within the EP-hypothesis) start affecting muscle activation patterns when the required movement has to deviate substantially from its natural (preferred) frequency. Only in the latter case, strong co-variation in the space of elemental variables is expected stabilizing salient mechanical variables. In other words, synergies, as quantified with the introduced index ΔV, reflect both quality and quantity of control. The latter reflects to what extent external mechanical patterns are defined by control signals as compared to peripheral factors such as mechanics and reflex loops, while the former reflects how well appropriate control variables co-vary.
Relations of the Results to Locomotion
In one aspect, the study has failed to provide a definitive answer to one of the main questions that motivated the design of the study. The two tasks were selected to reveal possible differences in the organization of muscle activation patterns in the lower body during locomotor-like alternating arm movements and during another type of movement (body rotation) that produced a similar pattern of MZ changes. The expectations of differences in the organization of muscle modes and/or multi-M-mode synergies were based on clinical observations in patients with spinal cord injury who showed entrainment of leg movements by alternating arm movements, but not by upper body rotation at a similar frequency, unless given several weeks of practice (Shapkova 1997, 2003).
We have failed to detect significant differences between the two tasks. This might be partly due to the broadly varying M-mode composition both across the subjects and across the movement frequencies. It is possible that the observed EMG patterns in the leg and trunk muscles during arm movements could result from entrainment of the lumbar central pattern generator through long propriospinal connections (Schomburg 1990). On the other hand, the high-amplitude upper body rotation could activate the same neural structures via short-axonal inter-segmental connections or through cyclically modulated reflexes from proprioceptors induced by the mechanical coupling of the body segments. Our method of EMG analysis may be too crude to detect differences in muscle activation patterns that are produced by a spinal central pattern generator and those produced by other pathways when the patterns of the lower-body mechanics are qualitatively similar.
Some methodological aspects of muscle synergy studies
Motor variability has attracted much attention recently. It is commonly viewed not as a reflection of noise within different structures involved in movement production but as an important window into the neural organization of motor control (reviewed in Davids et al. 2005; Latash 2008). In particular, the UCM hypothesis suggests that analysis of variance across repetitive trials may be used to identify and quantify motor synergies across a variety of tasks, effectors, and levels of analysis (reviewed in Latash et al. 2007). The same is true with respect to the first step involved in the analysis of multi-muscle synergies, namely identification of M-modes. In all previous studies, M-modes were identified using data pooled over different amplitudes and directions of change of a performance variable of choice, for example the center of pressure coordinate (Wang et al. 2005; Danna-Dos-Santos et al. 2007). Variance in the performance was beneficial because it allowed to analyze consistent patterns of covariation between indices of muscle activation over a large area in the muscle activation space.
In our current study, we only suggested the subjects specific magnitudes of action and allowed them to select their own, comfortable ways of performing the tasks. We were not concerned about the variability in the behavior because the variability is essential for the method to work. Besides, many earlier studies have shown that the composition of M-modes defined with such methods is very robust: It was common across very dissimilar tasks and very different magnitudes of shift of the mechanical variable of interest (Krishnamoorthy et al. 2003; Wang et al. 2005; Danna-Dos-Santos et al. 2007).
All the mentioned studies suggested to us that the M-mode composition would remain robust across tasks and task variations (such as moving at different frequencies and/or different amplitudes). Nevertheless, we expected consistent differences between the two tasks selected in this study. Our choice of using the arm movement task was based upon recent observations that fast rhythmic running-imitating arm movements evoked step-like leg activity in paraplegic patients (Shapkova 1997, 2003). The second task (body rotation) was chosen to provide a comparison to the arm movement task: The body rotation task produces a qualitatively similar MZ shift without an explicit involvement of the arms. We expected the first task to be associated with M-mode composition typical of locomotion (Ivanenko et al. 2004, 2005), while the second one was expected to show M-mode composition similar to those observed in our earlier studies of different actions performed by standing persons. The two tasks were associated with somewhat different ranges of MZ. However, we were not concerned about this issue because both M-mode composition and M-mode synergies have been shown across a much broaded range of other mechanical variables (Krishnamoorthy et al. 2003; Wang et al. 2005; Danna-Dos-Santos et al. 2007).
Acknowledgments
Supported in part by a NIH grant NS-035032. We are grateful to Miriam Klous and Alexander Terekhov for their help.
References
- Aruin AS, Ota T, Latash ML. Anticipatory postural adjustments associated with lateral and rotational perturbations during standing. J Electromyogr Kinesiol. 2001;11:39–51. doi: 10.1016/s1050-6411(00)00034-1. [DOI] [PubMed] [Google Scholar]
- Bernstein NA. The Co-ordination and Regulation of Movements. Pergamon Press; Oxford: 1967. [Google Scholar]
- Danna-dos-Santos Slomka K, Latash ML, Zatsiorky VM. Muscle modes and synergies during voluntary body sway. Exp Brain Res. 2007;179:533–550. doi: 10.1007/s00221-006-0812-0. [DOI] [PubMed] [Google Scholar]
- d'Avella A, Saltiel P, Bizzi E. Combinations of muscle synergies in the construction of a natural motor behavior. Nat Neurosci. 2003;6:300–308. doi: 10.1038/nn1010. [DOI] [PubMed] [Google Scholar]
- Davids K, Bennett S, Newell KM, editors. Movement System Variability. Human Kinetics; Urbana, IL: 2005. [Google Scholar]
- Duarte M, Zatsiorsky VM. Patterns of center of pressure migration during prolonged unconstrained standing. Motor Control. 1999;3:12–27. doi: 10.1123/mcj.3.1.12. [DOI] [PubMed] [Google Scholar]
- Feldman AG. Once more on the equilibrium-point hypothesis (λ-model) for motor control. J Mot Behav. 1986;18:17–54. doi: 10.1080/00222895.1986.10735369. [DOI] [PubMed] [Google Scholar]
- Goodman L, Riley MA, Mitra S, Turvey MT. Advantages of rhythmic movements at resonance: minimal active degrees of freedom, minimal noise, and maximal predictability. J Mot Behav. 2000;32:3–8. doi: 10.1080/00222890009601354. [DOI] [PubMed] [Google Scholar]
- Hatsopoulos NG, Warren WH., Jr Resonance tuning in rhythmic arm movements. J Mot Behav. 1996;28:3–14. doi: 10.1080/00222895.1996.9941728. [DOI] [PubMed] [Google Scholar]
- Ivanenko YP, Poppele RE, Lacquaniti F. Five basic muscle activation patterns account for muscle activity during human locomotion. J Physiol. 2004;556:267–282. doi: 10.1113/jphysiol.2003.057174. [DOI] [PMC free article] [PubMed] [Google Scholar]
- Ivanenko YP, Cappellini G, Dominici N, Poppele RE, Lacquaniti F. Coordination of locomotion with voluntary movements in humans. J Neurosci. 2005;25:7238–7253. doi: 10.1523/JNEUROSCI.1327-05.2005. [DOI] [PMC free article] [PubMed] [Google Scholar]
- Krishnamoorthy V, Goodman SR, Latash ML, Zatsiorsky VM. Muscle synergies during shifts of the center of pressure by standing persons: Identification of muscle modes. Biol Cybern. 2003a;89:152–161. doi: 10.1007/s00422-003-0419-5. [DOI] [PubMed] [Google Scholar]
- Krishnamoorthy V, Latash ML, Scholz JP, Zatsiorsky VM. Muscle synergies during shifts of the center of pressure by standing persons. Exp Brain Res. 2003b;152:281–292. doi: 10.1007/s00221-003-1574-6. [DOI] [PubMed] [Google Scholar]
- Krishnamoorthy V, Latash ML, Scholz JP, Zatsiorsky VM. Muscle modes during shifts of the center of pressure by standing persons: Effects of instability and additional support. Exp Brain Res. 2004;157:18–31. doi: 10.1007/s00221-003-1812-y. [DOI] [PubMed] [Google Scholar]
- Kugler PN, Turvey MT. Information, natural law, and the self-assembly of rhythmic movement. Erlbaum; Hillsdale, NJ: 1987. [Google Scholar]
- Latash ML. Virtual trajectories, joint stiffness, and changes in natural frequency during single-joint oscillatory movements. Neurosci. 1992;49:209–220. doi: 10.1016/0306-4522(92)90089-k. [DOI] [PubMed] [Google Scholar]
- Latash ML. Synergy. Oxford University Press; New York, NY: 2008. [Google Scholar]
- Latash ML, Scholz JP, Schöner G. Motor control strategies revealed in the structure of motor variability. Exer Sport Sci Rev. 2002;30:26–31. doi: 10.1097/00003677-200201000-00006. [DOI] [PubMed] [Google Scholar]
- Latash ML, Scholz JP, Schöner G. Toward a new theory of motor synergies. Motor Control. 2007;11:275–307. doi: 10.1123/mcj.11.3.276. [DOI] [PubMed] [Google Scholar]
- Robert T, Zatsiorsky VM, Latash ML. Multi-muscle synergies in an unusual postural task: Quick shear force production. Exp Brain Res. 2008;187:237–253. doi: 10.1007/s00221-008-1299-7. [DOI] [PMC free article] [PubMed] [Google Scholar]
- Shapkova EYu. Propriospinal initiation of locomotor activity in paraplegic children. In: Gurfinkel VS, Levik Yu, editors. Brain and Movement. Institute for Information Transmission Problems, RAS; Moscow, Russia: 1997. pp. 172–173. [Google Scholar]
- Shapkova EYu. Progress in Motor Control IV, Abstracts. Vol. 150. Universite de Caen Basse-Normandie; Caen, France: 2003. Locomotor recovery in completely paralyzed patients: effect of spinal re-learning or reorganizing? [Google Scholar]
- Scholz JP, Schöner G. The uncontrolled manifold analysis concept identifying control variables for a functional task. Exp Brain Res. 1999;126:189–306. doi: 10.1007/s002210050738. [DOI] [PubMed] [Google Scholar]
- Schomburg ED. Spinal sensorimotor systems and their supraspinal control. Neurosci Res. 1990;7:265–340. doi: 10.1016/0168-0102(90)90008-3. [DOI] [PubMed] [Google Scholar]
- Ting LH, Macpherson JM. A limited set of muscle synergies for force control during a postural task. J Neurophysiol. 2005;93:609–613. doi: 10.1152/jn.00681.2004. [DOI] [PubMed] [Google Scholar]
- Torres-Oviedo G, Macpherson JM, Ting LH. Muscle synergy organization is robust across a variety of postural perturbations. J Neurophysiol. 2006;96:1530–1546. doi: 10.1152/jn.00810.2005. [DOI] [PubMed] [Google Scholar]
- Torres-Oviedo G, Ting LH. Muscle synergies characterizing human postural responses. J Neurophysiol. 2007;98:2144–2156. doi: 10.1152/jn.01360.2006. [DOI] [PubMed] [Google Scholar]
- Tresch MC, Cheung VC, d'Avella A. Matrix factorization algorithms for the identification of muscle synergies: evaluation on simulated and experimental data sets. J Neurophysiol. 2006;95:2199–212. doi: 10.1152/jn.00222.2005. [DOI] [PubMed] [Google Scholar]
- Wang Y, Asaka T, Zatsiorsky VM, Latash ML. Muscle synergies during voluntary body sway: Combining across-trials and within-a-trial analyses. Exp Brain Res. 2006;174:679–693. doi: 10.1007/s00221-006-0513-8. [DOI] [PubMed] [Google Scholar]
- Wang Y, Zatsiorsky VM, Latash ML. Muscle synergies involved in shifting center of pressure during making a first step. Exp Brain Res. 2005;167:196–210. doi: 10.1007/s00221-005-0012-3. [DOI] [PubMed] [Google Scholar]
- Yu H, Russell DM, Sternad D. Task-effector asymmetries in a rhythmic continuation task. J Exp Psychol: Hum Percept Perform. 2003;29:616–630. doi: 10.1037/0096-1523.29.3.616. [DOI] [PubMed] [Google Scholar]
- Zatsiorsky VM, Duarte M. Instant equilibrium point and its migration in standing tasks: rambling and trembling components of the stabilogram. Motor Control. 1999;3:28–38. doi: 10.1123/mcj.3.1.28. [DOI] [PubMed] [Google Scholar]