

Abstract
Decorin (DCN) is one of the major matrix proteoglycans in bone. To investigate the role of DCN in matrix mineralization, the expression of DCN in MC3T3-E1 (MC) cell cultures and the phenotypes of MC-derived clones expressing higher (sense; S-DCN) or lower (antisense; AS-DCN) levels of DCN were characterized. DCN expression was significantly decreased as the mineralized nodules were formed and expanded in vitro. In S-DCN clones, in vitro matrix mineralization was inhibited, whereas in AS-DCN clones, mineralization was accelerated. At the microscopic level, collagen fibers in S-DCN clones were thinner while those of AS-DCN clones were thicker and lacked directionality compared to the controls. At the ultrastructural level, the collagen fibrils in S-DCN clones were markedly thinner, whereas those of AS-DCN clones were larger and irregular in shape. The results from Fourier transform infrared spectroscopy analysis demonstrated that in AS-DCN cultures the mineral content was greater but the crystallinity of mineral was poorer than that of the controls at early stage of mineralization. The in vivo transplantation assay demonstrated that no mineralized matrices were formed in S-DCN transplants, whereas they were readily detected in AS-DCN transplants at 3 weeks of transplantation. The areas of bone-like matrices in AS-DCN transplants were significantly greater than the controls at 3 weeks but became comparable at 5 weeks. The bone-like matrices in AS-DCN transplants exhibited woven bone-like non-lamellar structure while the lamellar bone-like structure was evident in the control transplants. These results suggest that DCN regulates matrix mineralization by modulating collagen assembly.
Keywords: Decorin, Collagen fibrillogenesis, Collagen organization/maturation, Matrix mineralization, MC3T3-E1 cells
1. Introduction
Mineralized tissues of vertebrates, except for tooth enamel, are essentially composed of two phases, i.e. carbonate-rich hydroxyapatite (HA) minerals and fibrillar type I collagen matrix. The collagen molecules are packed in parallel and staggered with respect to one another by a certain distance (D-period, ∼67 nm), thereby creating alternate zones of high (overlap) and low (gap) packing density along the fibril axis (Hodge and Petruska, 1963). The molecules within collagen fibrils are then stabilized by the formation of covalent intra- and intermolecular cross-links, serving as a stable 3 dimensional template for mineralization (Yamauchi, 1995). The type and quantity of cross-linking are important for proper mineralization (Gerstenfeld et al., 1993; Pornprasertsuk et al., 2004; Pornprasertsuk et al., 2005; Yamauchi and Katz 1993; Yamauchi et al., 1988).
The structural relationship between collagen fibrils and mineral has been extensively investigated at the ultrastructural level (Burger et al., 2008; Siperko and Landis 2001; Traub et al., 1989), however, a number of important questions still remain like what initiates/inhibits mineralization, how collagen fibrils affect the growth of mineralization and how the structure of collagen fibrils affects mineralization. Recently, significant attention has been drawn to the functions of small leucine-rich proteoglycans (SLRPs) in collagen fibrillogenesis (Hedbom and Heinegard, 1989; Vogel and Trotter, 1987), matrix mineralization (Hoshi et al., 1999; Mochida et al., 2003) and osteoblast differentiation (Chen et al., 2004; Parisuthiman et al., 2005). Decorin (DCN), one of the major SLRPs in mineralized tissues, is a prototype member of the SLRP family molecules and modulates collagen fibrillogenesis (Vogel et al., 1984; Weber et al., 1996). Although DCN deficient mice exhibited only mild ultrastructural changes in bone, when both DCN and biglycan (BGN), a structurally related SLRP member, were disrupted, bone phenotypes were synergized exhibiting severe osteopenia (Corsi et al., 2002), indicating a redundant function between DCN and BGN in the matrix mineralization process in vivo. In addition, there was some evidence that chondroitin-sulfate (CS)-bone proteoglycans likely including CS-DCN act as inhibitor of mineralization (Boskey et al., 1997; Sugars et al., 2003).
In order to further define the role of DCN in matrix mineralization, the effects of DCN on collagen matrix organization, collagen assembly and mineralization in vitro and in vivo were investigated using osteoblast-derived clones expressing higher or lower levels of DCN than normal cultures.
2. Results
2.1. DCN mRNA and protein expression during matrix mineralization
The temporal expression pattern of DCN both at mRNA and protein levels in MC osteoblastic cells during matrix mineralization was examined. The results of quantitative real time PCR analysis demonstrated that DCN mRNA expression was decreased at day 14 (about 40% decrease compared to the level at day 7) and the lower level of expression was sustained throughout the culture periods (Fig. 1A, upper panel). In agreement with the mRNA expression pattern, Western blotting showed that DCN protein level was also decreased during the matrix mineralization, and significant decrease was observed between days 14 and 21 in culture (Fig. 1A, lower panel), at the time when initial mineralized nodule formation was detected (Fig. 1B, indicated by an arrow).
Fig. 1.
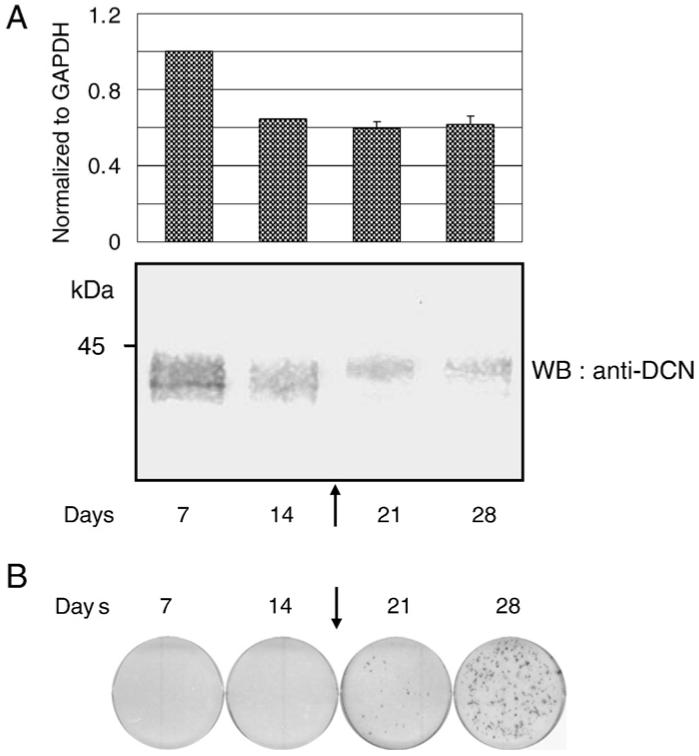
Expression of DCN during matrix mineralization in MC3T3-E1 osteoblastic cells. (A; upper panel) Quantitative real time PCR analysis of DCN mRNA expression. The mean fold change in the expression of DCN was calculated based on the normalization to that of GAPDH using the value of cDNA at day 7 as a calibrator. The values indicated represent normalized expression of DCN and are shown as mean+S.D. based on triplicate assays. (A; lower panel) Western blot analysis of DCN protein expression. Cell/matrices were extracted at the indicated time points, treated with chondroitinase ABC enzyme, and analyzed by Western blotting (WB) with anti-DCN antibody (LF-113). The onset of mineralized nodule formation was detected at the time point indicated by an arrow. Markers of molecular mass are shown on the left. (B) In vitro mineralization assay. MC3T3-E1 cells were plated, cultured and the mineralized nodules were analyzed by Alizarin Red S staining. The onset of mineralized nodule formation was detected at the time point indicated by an arrow, and the number and extent of mineralized nodules were increased thereafter.
2.2. Effect of DCN on matrix mineralization in vitro
Among the DCN clones generated, S2, S3, AS 1 and AS2 clones were selected for the following characterization since these clones exhibited significantly higher (S) or lower (AS) levels of DCN in comparison to the controls (Mochida et al., 2003). The results were compared to two types of controls, i.e. MC cells and MC transfected with an empty vector (EV).
2.2.1. Effect of DCN on mineralized nodule formation
To investigate the ability to form the mineralized nodules in vitro, MC cells, EV clone, S- and AS-DCN clones were cultured for up to 28 days and in vitro mineralization assay was performed. The results showed that the timing and extent of mineralized nodule formation were severely inhibited in both S-DCN clones, whereas those were accelerated in both AS-clones compared to those of the controls (i.e. MC and EV) (Fig. 2A).
Fig. 2.
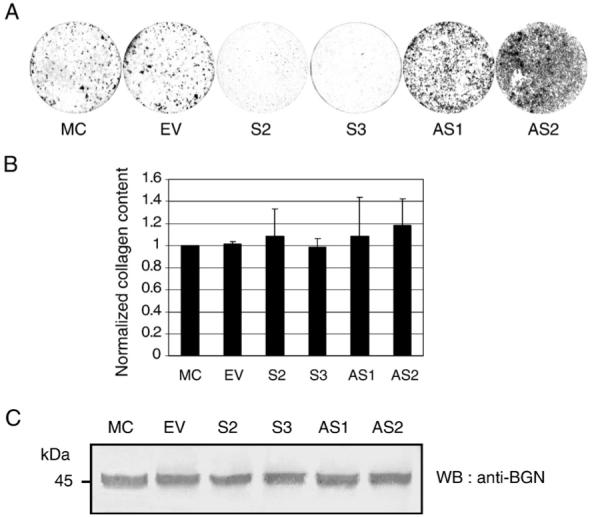
Characterization of MC3T3-E1 cell derived stable clones expressing higher (sense, S clones) or lower (antisense, AS clones) levels of DCN. (A) In vitro mineralization assay. MC3T3-E1 cells (MC), an empty vector transfected (EV) clone, S-DCN (S2, S3) and AS-DCN (AS1, AS2) clones were plated and cultured in the mineralization medium for 28 days. Cell/matrices were stained with Alizarin Red S and the mineralized nodules were visualized. (B) Contents of collagen deposited by the DCN clones and controls. Cell/matrix layer from each cell type at day 28 was collected, analyzed for hydroxyproline and the total collagen content/well was normalized to that of MC. (C) Effect of DCN on biglycan (BGN) expression. Cell/matrices extracted from MC cells, EV clone, S-DCN (S2, S3) and AS-DCN (AS1, AS2) clones were treated with chondroitinase ABC enzyme and analyzed by Western blotting (WB) with anti-BGN antibody (LF-156).
2.2.2. Effect of DCN on collagen deposition
Since type I collagen is the major matrix component in bone and plays a critical role in mineralization, we measured the quantity of collagen deposited by the clones and compared to that of MC cells. As shown in Fig. 2B, the quantity of collagen deposited in the extracellular matrix was not significantly different among the clones and controls. We also measured collagen mRNA expression by quantitative real time-PCR at 2 weeks of culture and it was essentially identical among the clones and controls (data not shown).
2.2.3. Effect of DCN on biglycan expression
The expression level of biglycan (BGN), a closely related SLRP member to DCN was analyzed by Western blotting (Fig. 2C). The results demonstrated that there is no difference among the controls, i.e. MC cells and EV clone, and DCN clones.
2.2.4. Analysis of collagen organization/maturation by picrosirius red staining
The effect of DCN level on collagen organization/maturation at the light microscopic level was examined by picrosirius red staining (Dayan et al., 1989; Junqueira et al., 1979). Cells were cultured in the mineralization medium for 1 week when initial mineralized nodules were not yet detected, collagen/matrices produced by these cells/clones were stained by 1% picrosirius red and observed under a polarized light microscope (Fig. 3). The organization of collagen matrix in the controls was uniform and colored in red/orange, while that of S-DCN clones was less organized with areas of green/yellow color. In AS-DCN clones, the collagen matrix was markedly thicker, stained in bright orange and lacked directionality when compared to those of the controls. These results demonstrated that DCN modulates the organization and maturation of collagen matrix in osteoblasts.
Fig. 3.
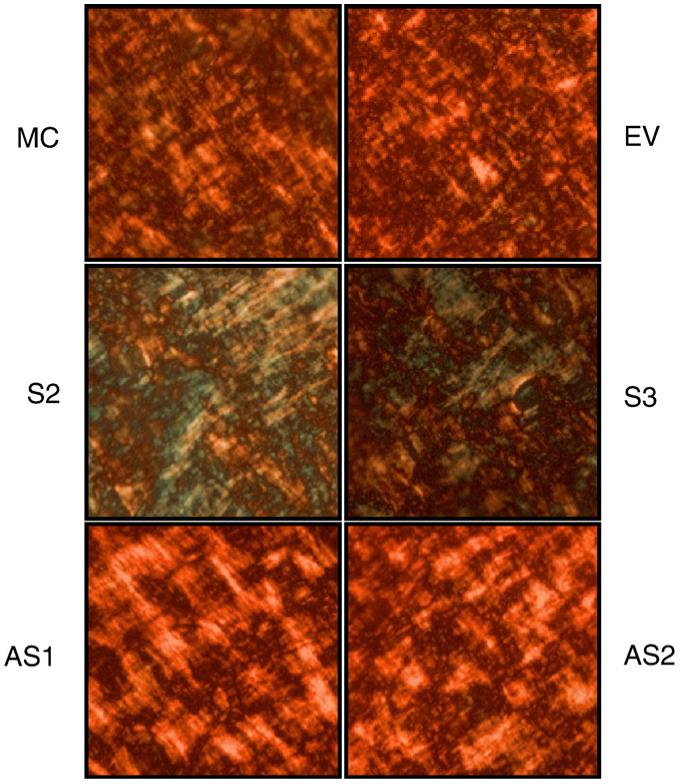
Picrosirius red staining. MC cells, EV clone, S- and AS-DCN clones were plated, cultured for 1 week and the matrices produced were stained with picrosirius red. Three independent experiments produced similar results, and one representative image of each cell type is shown under a polarized microscope.
2.2.5. Characterization of collagen fibrils by transmission electron microscopy
The morphology of collagen fibrils in DCN clones was analyzed by transmission electron microscopy (TEM) (Fig. 4). The mean diameter of collagen fibrils from cultures of MC cells was 33.03 nm with a range of 18.46-52.31 nm, which is similar to that of EV (a mean of 36.62 nm, with a range of 18.46-52.31 nm). The collagen fibrils in both MC cells and EV were circular and relatively uniform in shape. In S-DCN clones, the mean diameter was significantly smaller than that of the controls (S2: a mean of 26.87 nm, with a range of 12.31-46.15 nm; S3: a mean of 22.85 nm, with a range of 9.23-30.77 nm) and were inversely correlated with the level of DCN synthesis, i.e. S3 clone which exhibited the highest level of DCN expression (Mochida et al., 2003) yielded the smallest mean diameter. On the other hand, in AS-DCN clones, the collagen fibrils were irregular in shape and laterally fused, showing the mean diameter and these ranges were significantly larger and broader than those of the controls (AS1: a mean of 41.90 nm, with a range of 18.46-116.92 nm; AS2: a mean of 47.19 nm, with a range of 18.46-120 nm). The extent of altered collagen fibrillogenesis was also inversely correlated with the level of DCN synthesis, i.e. AS2, the clone synthesizing the lowest expression of DCN (Mochida et al., 2003) exhibited the largest diameter and broadest range.
Fig. 4.
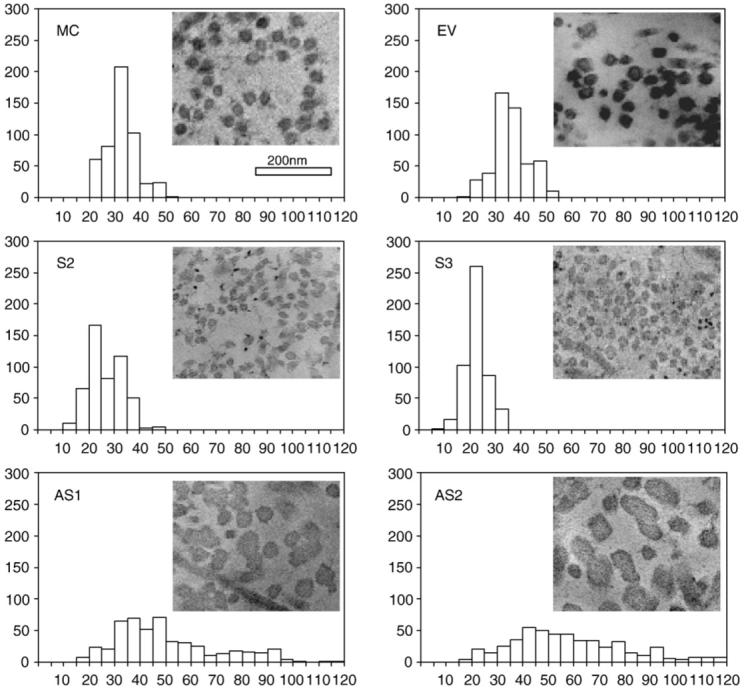
Measurement of collagen fibril diameter by TEM. MC cells, EV clone, S- and AS-DCN clones were plated, cultured for 1 week and the matrices produced were collected. The sections were observed under a transmission electron microscope and the digital images of cross sectional view were taken at a magnification of 11,000× using Gatan’s Digital Micrograph software; montage 3×3. Five hundred of collagen fibrils in each cell type were randomly chosen and diameters were measured using Scion Image Software. X-axis shows a distribution of thickness of fibrils (nm), and Y-axis shows numbers of fibrils.
2.2.6. Analysis of mineral by Fourier transform infrared spectroscopy (FTIR)
We investigated whether DCN affects mineral content and crystallinity in a cell culture system by FTIR analysis. Since S-DCN clones did not form any mineralized nodules in vitro even at the late mineralization stage (Fig. 2A) (Mochida et al., 2003), only the controls and AS-DCN clones (AS1 and AS2) were cultured, and mineral/matrix ratio and crystallinity were measured. At proliferation stage, only AS1 and AS2 showed the presence of mineral, while the controls did not (Fig. 5A). At mineralization stage, the mineral content of AS1 and AS2 tended to be greater than that of the controls (Fig. 5A), while the mineral crystals in the controls were larger/more perfect than those in both AS-DCN clones. The crystallinity ratio of the controls was equivalent at mineralization stage (Fig. 5B). At the late mineralization stage, the mineral is present in all the cultures, however the mineral in AS1 is significantly more abundant than the controls and AS2 (Fig. 5A). The crystallinity ratio of AS1 and AS2 tended to be poorer than that of the controls, although there was no statistically significant difference at this time point (Fig. 5B).
Fig. 5.
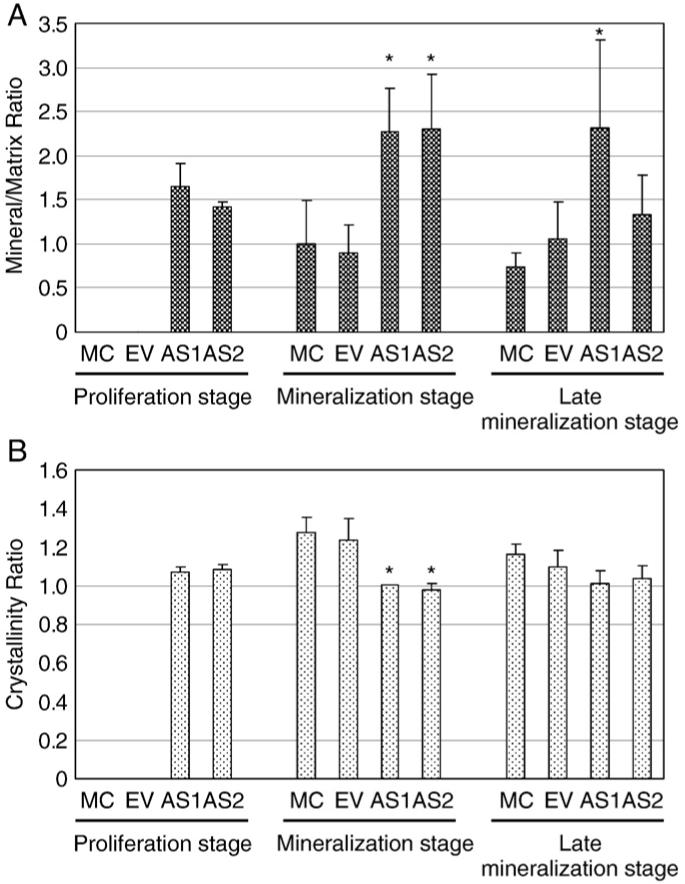
Fourier transform infrared spectroscopy (FTIR) analysis. MC cells, EV clone and AS-DCN clones were plated and cultured. Cells/matrices were collected and FTIR analysis performed. Mean+SD for mineral/matrix ratio (A) and crystallinity (B) were calculated from the spectra of cell cultures based on the three independent assays. Statistical analysis was performed by multiple comparison with Dunnett’s test and the significant differences are shown by asterisks (P<0.05) compared to the controls.
2.3. Effects of DCN on in vivo mineralization
In order to determine whether DCN affects matrix mineralization in vivo, MC cells, EV, S-, or AS-DCN clones were transplanted into the immunodeficient mice, harvested at 3 and 5 weeks post-transplantation, and the sections stained with hematoxylin and eosin (H&E) are shown in Fig. 6A and B, respectively. At 3 weeks, only small amounts of bone-like matrices with embedded osteocyte-like cells were observed in the controls. In S-DCN clones, there was no bone-like matrix observed, and only fibrous tissues were detected in and around hydroxyapatite/tricalcium phosphate (HA/TCP) carriers. In AS-DCN clones, on the other hand, the areas occupied by bone-like matrices were greater compared to those of the controls, suggesting that the onset of matrix mineralization was accelerated in vivo in these clones. However, the difference of collagen organization/maturation observed under a polarized light microscope was not yet evident between controls and DCN clones at this point (Fig. 6A). At 5 weeks of transplantation, bone-like matrices where osteocyte-like cells have embedded were clearly observed in the controls, and lamellar structures typically detected in bone were also seen under a polarized light microscope, demonstrating that bone-like matrices formed by controls were well organized and compact. On the other hand, the transplants of all S-DCN clones formed no bone-like matrices but only fibrous tissues in and around HA/TCP carriers. Although almost similar amounts of bone-like matrices were formed in both AS-DCN clones compared to controls at this point, typical lamellar-like structures were not developed but rather disorganized, woven bone-like structure was observed in these clones (Fig. 6B). Then, the areas of bone-like matrices at both time points were calculated (Fig. 6C). At week 3 of post-transplantation, the extent of bone-like mineralized matrices in MC cells was similar to that of EV. At this point, the bone-like mineralized area/total area (B/T) calculated in both AS-DCN clones were statistically greater than those of the controls (P<0.05). At week 5 of post-transplantation, the areas of mineralized matrices produced by the controls were greater than those at 3 weeks, and those in MC cells were almost identical to in EV. In the transplants of AS-DCN clones, the extent of mineralized matrices was comparable to that of the controls at 5 weeks of post-transplantation.
Fig. 6.
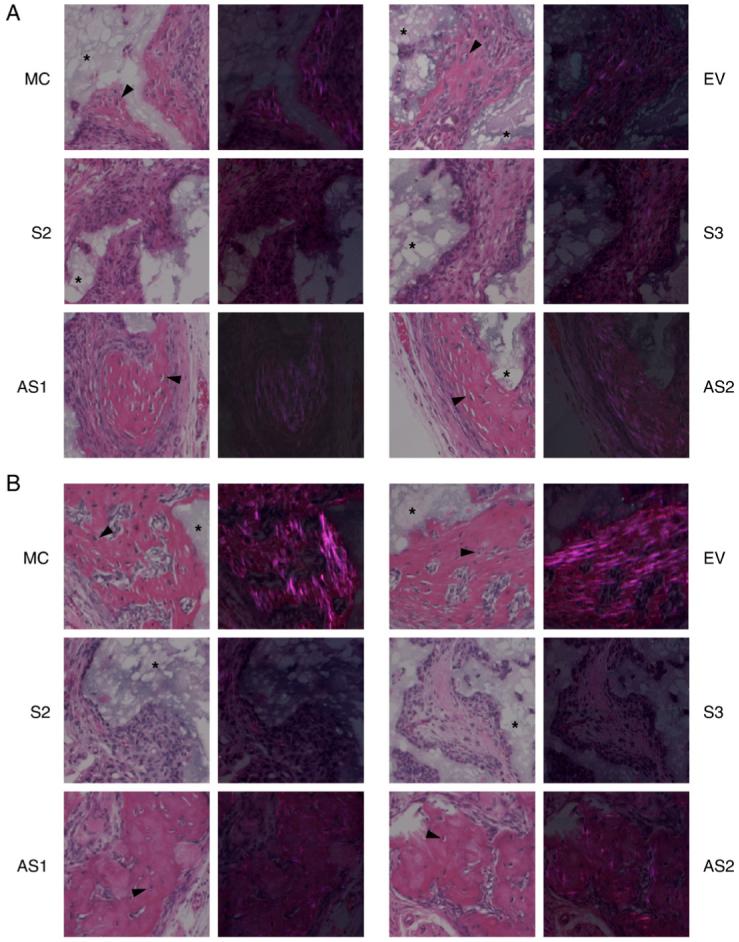
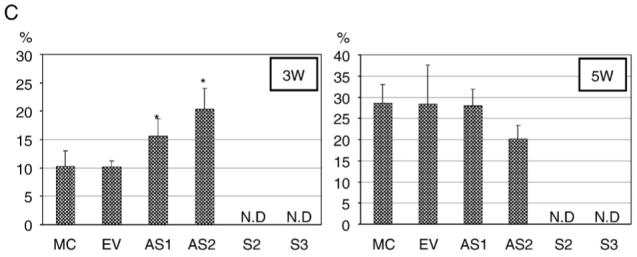
In vivo transplantation assay and histomorphometry analysis. MC cells, EV clone, S- and AS-DCN clones were subcutaneously transplanted into immunodeficient mice, harvested for 3 (A) and 5 weeks (B) and transplants were collected. The sections stained with H&E were observed and photographed under a light microscope (left panels of each cell type) and a polarized light microscope (right panels of each cell type). MC, EV, and AS-DCN clones formed bone-like matrices with osteocyte-like cells embedded (arrow heads). All S-DCN clones formed no bone-like matrices observed, but fibrous tissues at any time points. An asterisk indicates the HA/TCP carrier. (C) At least five representative images were acquired at a magnification of 10× under a light microscope, measured the total area (T) and bone tissue-like area (B) by Scion Image Software, and calculated the percentage (%) of B/T in each cell type. The data are shown as mean+S.D. Since no bone-like matrices were observed in any S-DCN clones at any time points tested, the data was not determined in S-DCN clones (shown as N.D). The calculated area in each cell type was statistically evaluated by multiple comparison with Dunnett’s test, and the significant differences are shown by asterisks (P<0.05) compared to the controls.
3. Discussion
The process of biomineralization is tightly regulated by cells, growth/differentiation factors and several key matrix proteins. Type I collagen is the predominant organic matrix component in bone and regulates the spatial aspect of mineralization by defining the space in and around the fibrils (Landis et al., 1993). The initiation and inhibition of mineralization, however, is likely regulated by a number of noncollagenous matrix molecules. We have previously shown that the levels of DCN influence the timing and extent of matrix mineralization in a cell culture system (Mochida et al., 2003) possibly through its interaction with collagen. The present study was performed to further elaborate our previous results.
A recent study on the DCN/BGN-double deficient mice suggested that there was a compensation of DCN by BGN in mouse bone development. Thus, in order to define the role of DCN in mineralization, a system in which the level of DCN can be manipulated without altering BGN level would be desirable. In this present study, the expression level of BGN protein was unchanged among the clones and controls (Fig. 2C). In our previous study on BGN using the similar system, the DCN levels were not significantly affected by overexpressing or underexpressing BGN (Parisuthiman et al., 2005). A similar result has been demonstrated when DCN was overexpressed with adenoviral infection (Ruhland et al., 2007), indicating that a compensatory function of BGN for DCN is not significant in both experimental systems. Thus, these systems could be more suitable to define the function of DCN in biomineralization.
Our data showed that both DCN mRNA and protein expression levels were significantly decreased prior to/at the onset of matrix mineralization (Fig. 1A). Another study by Beck et al. also demonstrated that Dcn gene was downregulated by an increased phosphate concentration in MC3T3-E1 cells (Beck et al., 2003). Thus, DCN expression appears to be inversely correlated to matrix mineralization in vitro.
It has been proposed that DCN plays a key role in collagen fibrillogenesis in various types of tissues (Iozzo, 1997; Iozzo, 1999; Reed and Iozzo, 2002). In the present study, the collagen produced by S-DCN clones was thinner and morphologically immature evaluated by picrosirius red staining (Fig. 3) and the diameter of collagen fibrils was smaller than that of the controls (Fig. 4). In the case of AS-DCN clones, collagen produced was thick exhibiting a patchy structure (Fig. 3). The most prominent feature in AS-DCN clones was the morphology of collagen fibrils by TEM analysis showing irregular and bulging structures due to the lateral fusion of several fibrils, resulting in the wider distribution of their diameters (Fig. 4). These alterations in collagen fibrils show a striking similarity to those reported in skin collagen fibrils in DCN-deficient mice (Danielson et al., 1997). Since the binding ability of DCN to type I collagen has been well documented (Hedbom and Heinegard,1989; Vogel and Trotter,1987), it is likely that, through this ability, higher levels of DCN may restrict the lateral growth of collagen fibrils resulting in small fibrils. On the contrary, the decreased level of DCN along the collagen fibrils could result in the uncontrolled, abnormal fibril fusion. Thus, the present results suggest that collagen fibrillogenesis and organization/maturation, not the total amounts of collagen (Fig. 2B), in the MC cell culture system could be in part controlled by DCN. Since collagen is the structural template for mineralization, the changes in collagen are likely a cause of abnormal mineralization seen in S- and AS-DCN clones.
The mineralization assay using an in vivo transplantation system, S-DCN clones did not produce bone-like mineralized matrices (Fig. 5). This is consistent with the results of an in vitro mineralization assay (Fig. 2A) and our previous study (Mochida et al., 2003). The lack of mineralization is likely due to the thin and improperly organized collagen template in the presence of higher levels of DCN that cannot properly accommodate the mineral crystals. It is also possible that the abundance of DCN may cover the “gap” zones of the collagen fibrils, the putative nucleation sites (Tong et al., 2003), thus inhibiting mineralization. Moreover, the highly negative charged property of DCN derived from its glycosaminoglycan chain may compete with in the nucleation process (Rees et al., 2002), thus the abundance of DCN may lead to the impaired mineralization. In support of this, Hoshi and coworkers proposed that removal of DCN and collagen fibril fusion might promote calcification (Hoshi et al., 1999). Therefore, the lack of DCN as in the case of AS-DCN clones might contribute to the preferable microenvironment for nucleation, thus, accelerates the formation of bone-like matrices in vivo (Fig. 6A) as well as in vitro (Fig. 2A) (Mochida et al., 2003). However, it is noteworthy that though the mineralized matrix is formed faster in AS-DCN clones, they revealed a non-lamellar, disorganized woven bone-like structure as opposed to that formed by both controls (Fig. 6A and B). The lack of DCN likely accelerated mineralization but the abnormal structure of collagen (Fig. 4) formed by AS-DCN clones resulted in poorly organized and a defective mineralized matrix. FTIR analysis (Fig. 5) supported this notion. In AS-DCN clones, the bone-like mineral was detected by spectra (data not shown) and the mineral was detected even at the proliferation stage. The mineral content increased with time in AS-DCN clones except at the late mineralization stage for AS2. In controls, mineral was not detected until the cell cultures reached mineralization stage (Fig. 5A). However, the crystal size and perfection were not significantly different between controls and AS-DCN clones although the shape of the phosphate region of the spectra in AS-DCN clones seemed to be slightly sharper with time (data not shown), suggesting that crystal size was increasing. In AS-DCN clones at mineralization stage, the significant decrease in crystallinity implies the formation of new (hence smaller) crystals. There are visibly fewer crystals in the controls, but these appear larger (Fig. 5B). In the presence of the same CaxP product and few crystal nuclei, the crystals would grow larger than would be the case with many crystal nuclei.
It is of interest to note that an alteration of BGN level in the same culture system resulted in the opposite phenotypes. Higher level of BGN led to acceleration of osteoblast differentiation and matrix mineralization likely due to its ability to enhance the activity of certain members of growth factors (Mochida et al., 2006b; Parisuthiman et al., 2005). It has been reported that in vitro, addition of BGN increased apatite formation, suggesting the potential role of BGN as a HA nucleator (Boskey et al., 1997), while addition of DCN inhibited HA-induced crystal growth (Sugars et al., 2003), thus the physicochemical phenomenon is also consistent with the observed phenotype. Thus, despite the high sequence identity and closely related structures of these two SLRPs members, their functions are likely not interchangeable.
It is not clear at this point that in AS2 clone synthesizing the lowest level of DCN, B/T ratio at 5 weeks remained the same level as at 3 weeks, whereas that of AS1 clone exhibited slight increase compared to 3 weeks (Fig. 5C). Although further studies are clearly warranted to elucidate the potential mechanism, collagen with lesser abundance of DCN could be less stable in vivo, possibly due to altered extracellular post-translational modifications such as cross-linking (Keene et al., 2000) or susceptibility to collagen degradation (Geng et al., 2006).
In summary, we have demonstrated that DCN modulates the collagen fibrillogenesis and organization/maturation, leading to the regulation of matrix mineralization in vitro and in vivo.
4. Experimental procedures
4.1. Cell culture, generation and characterization of MC3T3-E1 cell derived stable clones expressing higher (sense, S clones) or lower (antisense, AS clones) levels of DCN
MC3T3-E1 (MC) cells (Subclone 26) were maintained in α-minimum essential medium (α-MEM) supplemented with 10% fetal bovine serum (FBS, Sigma-Aldrich), 100 units/ml penicillin and 100 μg/ml streptomycin. MC cells stably transfected clones expressing higher levels (S-DCN) and lower levels (AS-DCN) of DCN, and an empty vector transfected (EV) clone were established previously (Mochida et al., 2003). Briefly, the coding sequence of DCN was amplified by RT-PCR and subcloned into pcDNA3.1-V5/His-TOPO mammalian expression vector (Invitrogen). Since this vector system allows the insert DNA to ligate bidirectionally, sense-orientated or anti-sense-orientated DCN containing plasmid (pcDNA3.1-DCN-V5/His-S or -AS construct) was generated. MC cells were transfected with the pcDNA3.1-DCN-V5/His-S or -AS construct and maintained in α-MEM containing 10% FBS and 400 μg/ml of G418 for up to 3-4 weeks. Stable cell clones were isolated by cloning rings and further cultured under the same conditions. MC cells were also transfected with an empty pcDNA3.1-V5/His A vector (Invitrogen) and the EV clone was generated in the same manner. In order to determine DCN protein levels, cell/matrix extracted from the controls (MC cells and EV clone), three S clones (S1, S2 and S3), and three AS clones (AS1, AS2 and AS3) were collected, dialyzed and lyophilized. Equal amounts of proteins were subjected to Western blot analysis using anti-DCN antibody (LF-113) and the intensity of the immunoreactivity was quantified by Scion Image Software (Scion Corporation). The results demonstrated that, compared to the controls, S1, S2 and S3 clones exhibited 150, 250 and 270% increases of DCN expression, whereas AS1, AS2 and AS3, 50, 80 and 20% decreases, respectively. In this study, two clones that expressed higher or lower levels of DCN were selected within the respective groups (i.e. S2 and S3 from sense clones, and AS1 and AS2 from antisense clones) and further characterized. The numbering of the clones in this study refers to the same clones partially characterized previously (Mochida et al., 2003).
4.2. Quantitative real time PCR analysis
MC cells were plated onto 35 mm culture dishes at a density of 2×10⁵ cells/dish. When cells reached confluence, the growth medium was replaced with the one supplemented with 50 μg/ml of ascorbic acid and 1 mM of ß-glycerophosphate (mineralization medium), and maintained for up to 28 days. Total RNA was extracted using TRIzol reagent (Invitrogen) at the end of each week. Two μg of total RNA extract was used for reverse transcription using the Omniscript RT Kit (Qiagen) according to the manufacturer’s protocol. Aliquots of cDNA were used as templates for real time PCR reactions in triplicate assays containing primers-probe for DCN (ABI assay number: Mm00514535_m1) or primers and probe for glyceraldehyde-3-phosphate dehydrogenase (GAPDH, ABI assay number: 4308313). Real time PCR was performed using ABI Prism 7000 Sequence detection system (Applied Biosystems). The mean fold change in the expression of DCN was calculated based on the normalization to that of GAPDH using the value of cDNA at day 7 as a calibrator by means of 2-ΔΔ CT method as described previously (Mochida et al., 2006a). The values indicated represent normalized expression of DCN and are shown as mean+S.D. based on triplicate assays. Three independent experiments produced similar results.
4.3. Western blot analysis
MC cells were plated onto 10 cm culture dishes at a density of 4×10⁵ cells/dish and maintained. When cells reached confluence, the medium was replaced with the mineralization medium, and maintained for up to 28 days. MC cells, EV clone, S-, and AS-DCN clones were plated onto 10 cm culture dishes at a density of 4×10⁵ cells/dish, maintained and cultured for 1 week. Cells were washed with phosphate buffered saline (PBS) twice. Cell/matrices were extracted with 6 M guanidine-HCl pH7.4, dialyzed and lyophilized. Equal amounts of dried samples were solubilized and protein concentration at each time point was measured by a DC protein assay kit (Bio-Rad) according to the manufacturer’s protocol. Equal amount of protein from each sample was treated with chondroitinase ABC enzyme (Seikagaku Corporation) for 12 h at 37 °C, dissolved in sodium dodecyl sulfate (SDS) sample buffer in the presence of 10 mM dithiothreitol (DTT) and separated by 4-12% SDS-PAGE. The proteins were transferred to a polyvinylidene fluoride (PVDF) membrane and subjected to Western blot analysis using the polyclonal antibody against mouse DCN core protein, LF-113 or mouse BGN core protein, LF-156 (Fisher et al., 1995) (generous gifts from Dr. Fisher L.W., NIDCR, MD). The immunoreactivity was detected by Alkaline Phosphatase Conjugate Substrate Kit (Bio-rad) as previously described (Mochida et al., 2003; Parisuthiman et al., 2005). Three independent sets of cell cultures were analyzed for this experiment and one of the representative results is shown.
4.4. In vitro mineralization assay
MC cells, EV clone, S- and AS-DCN clones were maintained and plated onto 35 mm culture dishes at a density of 2×10⁵ cells/dish. When cells reached confluence, the growth medium was replaced with the mineralization medium, and maintained for up to 28 days. The concentration of ß-glycerophosphate was slightly increased from 1 mM to 2 mM in the mineralization medium in order to accelerate the mineralization process (Fig. 2A). The cell/matrix layers were washed with PBS, fixed with 100% methanol and stained with 1% Alizarin Red S (Sigma) to visualize the mineralized nodule formation as reported previously (Mochida et al., 2003).
4.5. Collagen content in the extracellular matrix
MC cells, EV clone, S- and AS-DCN clones were maintained and plated onto 35 mm culture dishes at a density of 2×10⁵ cells/dish. When the cells reached confluence, 50 μg/ml of ascorbic acid was added and cultured for 28 days. Cell/matrix layers were then scraped, thoroughly washed with cold PBS and distilled water, lyophilized, and total weight of dried samples was measured. An aliquot of each sample was hydrolyzed with 6 N HCl, and the hydrolysate was subjected to amino acid analysis on a Varian high-performance liquid chromatography (HPLC) system (9050/9012; Varian Associates Inc.) (Yamauchi and Shiiba, 2008). Based on the value of hydroxyproline (Hyp), the total collagen content/well was calculated and normalized to that of MC cells. Three independent experiments were performed and the values are shown as mean+ S.D. based on triplicate assays. The values were not different among the clones and controls with the statistical analysis (ANOVA and multiple comparison with Dunnett’s test).
4.6. Picrosirius red staining
To investigate the organization and maturation of collagen produced by the controls and clones, MC cells, EV clone, S-, and AS-DCN clones were cultured in the mineralization medium for 1 week after the confluence, washed with PBS, and fixed with 0.1 M cacodylic buffer pH 7.4 containing 2% formaldehyde and 2.5% glutaraldehyde for 2 h. Cells/matrices were then cut in 1 cm×1 cm pieces, detached from the culture plates, transferred into glass vials and washed with 0.1 M cacodylate buffer. Samples were stained with 0.1% solution of Sirius Red F3BA in saturated aqueous picric acid for 30 min, washed with 0.01 N HCl, dehydrated and mounted. Samples were observed under a polarized light microscope (NIKON-FXA microscope) and photographed.
4.7. Measurement of collagen fibril diameter by transmission electron microscopy (TEM)
To further investigate the patterns and thickness of collagen fibrils produced by the controls and clones, same fixed samples as studied in picrosirius red staining were stained with 1% osmium tetraoxide in 0.1 M cacodylate buffer for 1 h at room temperature. After rinsing with distilled water, samples were dehydrated, embedded with resin, sectioned at 70 nm thickness and stained with uranyl acetate and lead citrate. The sections were observed under transmission electron microscope (Tecnai 12, Philips) and digital images were taken at a magnification of 11,000 using Gatan’s Digital Micrograph software; montage 3×3 (Gatan Inc.). Five hundred of collagen fibrils in each cell type were randomly chosen and diameters were measured using Scion Image Software (Scion Corporation).
4.8. Fourier transform infrared spectroscopy (FTIR) analysis
MC cells, EV clone and AS-DCN clones were plated onto 10 cm culture dishes at a density of 4×10⁵ cells/dish in duplicate and cultured in the mineralization medium as described above. Cells/matrices were collected based on the timing of mineralization stages in the control cell cultures (proliferation stage; cultured for up to 11 days when prior to the mineralization, mineralization stage; cultured for up to 21 days when the controls produced the mineralized nodules, late mineralization stage; the extent of mineralized nodules produced by the controls was almost as same as that of AS-DCN clones) washed three times with 0.2 M NH4HCO3 pH8.0 and lyophilized. Cultures were ground to a fine powder by mixing with KBr in a mortar and pestle, and were then prepared as KBr pellets (∼1 mg sample/100 mg KBr). IR spectra were collected under nitrogen purge on a Mattson Sirius spectrometer with a MCT (mercury cadmium telluride) detector. Routinely, 256 interferograms were collected at 4 cm-1 resolution. They were co-added and the resultant interferogram Fourier transformed using Bio-Rad Win-IR-Pro software (Bio-rad). The resultant spectra were base-lined, and the areas under the phosphate v1, v3 and amide I peaks (mineral/matrix ratio) were calculated (Pienkowski et al., 1997). For presentation purposes, the amide I area was normalized to 1.0 so that spectra could be overlaid using GRAMS 32 software (Galactic Software Inc.). For spectra in which mineral was detectable (mineral/matrix ratio exceeded values in non-mineralized cultures the intensity ratios of the 1030/1020 cm-1 subbands were calculated as an index of crystal size and perfection (Boskey et al., 2003; Gadaleta et al., 1996). The values from three independent cell cultures were calculated as those of proliferation, mineralization, or late mineralization stage, respectively. The data are shown as mean + S.D. with statistical analysis (ANOVA and multiple comparison with Dunnett’s test).
4.9. In vivo transplantation assay and histomorphometry analysis
The protocol of animal experiments has been approved by the Institutional Animal Care and Use Committee at the University of North Carolina at Chapel Hill. All procedures were followed by Mankani et al. (2001) with some modifications. In brief, MC cells, EV clone, S-, and AS-DCN clones were plated, maintained in α-MEM, trypsinized (3×10⁶ cells/a single transplant), and incubated with 40 mg of hydroxyapatite/tricalcium phosphate (HA/TCP) ceramic carrier (Zimmer) for 90 min at 37 °C with slow rotation (25 rpm). Cells/carriers were then centrifuged and the supernatants were discarded. After mouse fibrinogen and mouse thrombin (both from Sigma-Aldrich) were added to cells/carriers, they were subcutaneously transplanted into immunodeficient 8-12 week-old female beige mice (NIH-bg-nu-xidBR, Charles River Laboratories) as described previously (Parisuthiman et al., 2005; Pornprasertsuk et al., 2004). Mice were anesthesized by intraperitoneal injection with a combination of ketamine (Fort Dodge Animal Health) at 140 mg/kg body weight and xylazine (The Butler Company) at 7 mg/kg body weight. Mid-longitudinal skin incisions (about 1 cm in length) were made on the dorsal surface of each mouse, and four subcutaneous pockets per animal were created by blunt dissection. A single transplant was placed into each pocket and incisions were closed with surgical staples. The transplants were recovered at 3 and 5 weeks of post-transplantation, fixed in 10% buffered formalin (Sigma), demineralized in 10% ethylenediamine-tetraacetic acid pH7.4 (EDTA, Fisher), cut into two pieces so that largest surface areas were sectioned, and transferred to 70% ethanol. Samples were then processed for hematoxylin and eosin (H&E) staining. At least 6 representative sections from each transplant were evaluated and photographed at a magnification of 10× under a light microscope and polarized light microscope (NIKON-FXA microscope). Three independent experiments were performed and similar results were obtained.
In order to quantify the areas of matrices produced by the controls and clones in in vivo transplantation assay, at least 5 images were acquired at a magnification of 10× under a light microscope, measured the total area (T), and bone tissue-like area (B) by Scion Image Software, and calculated the percentage of B / T. The data are shown as mean+S.D. with statistical analysis (ANOVA and multiple comparison with Dunnett’s test).
Acknowledgments
We would like to dedicate this work to the memory of our beloved friend and colleague, “Art” (Dr. Duenpim Parisuthiman, DDS, Ph.D.), remembering her cheerful and ever-thankful spirit. The authors thank Mr. Halrold E Mekeel (UNC-CH) for his assistance in transmission electron microscopic study and Dr. Robert Bagnell Jr and Ms. Victoria J Madden (UNC-CH) for their valuable assistance in microscopic analyses. We also thank Drs. Pamela Gehron Robey and Arabella Leet (NIDCR) for providing HA/TCP for cell transplantation. This study was supported by NIH grants DE10489, AR052824 (MY) and DE04141 (ALB).
References
- Beck GR, Jr., Moran E, Knecht N. Inorganic phosphate regulates multiple genes during osteoblast differentiation, including Nrf2. Exp. Cell Res. 2003;288:288–300. doi: 10.1016/s0014-4827(03)00213-1. [DOI] [PubMed] [Google Scholar]
- Boskey AL, Moore DJ, Amling M, Canalis E, Delany AM. Infrared analysis of the mineral and matrix in bones of osteonectin-null mice and their wildtype controls. J. Bone Miner. Res. 2003;18:1005–1011. doi: 10.1359/jbmr.2003.18.6.1005. [DOI] [PubMed] [Google Scholar]
- Boskey AL, Spevak L, Doty SB, Rosenberg L. Effects of bone CS-proteoglycans, DS-decorin, and DS-biglycan on hydroxyapatite formation in a gelatin gel. Calcif. Tissue Int. 1997;61:298–305. doi: 10.1007/s002239900339. [DOI] [PubMed] [Google Scholar]
- Burger C, Zhou H, Wang H, Sics I, Hsiao BS, Chu B, Graham L, Glimcher M. Lateral packing of mineral crystals in bone collagen fibrils. Biophys. J. 2008 doi: 10.1529/biophysj.107.128355. [DOI] [PMC free article] [PubMed] [Google Scholar]
- Chen XD, Fisher LW, Robey PG, Young MF. The small leucine-rich proteoglycan biglycan modulates BMP-4-induced osteoblast differentiation. Faseb J. 2004;18:948–958. doi: 10.1096/fj.03-0899com. [DOI] [PubMed] [Google Scholar]
- Corsi A, Xu T, Chen XD, Boyde A, Liang J, Mankani M, Sommer B, Iozzo RV, Eichstetter I, Robey PG, Bianco P, Young MF. Phenotypic effects of biglycan deficiency are linked to collagen fibril abnormalities, are synergized by decorin deficiency, and mimic Ehlers-Danlos-like changes in bone and other connective tissues. J. Bone Miner. Res. 2002;17:1180–1189. doi: 10.1359/jbmr.2002.17.7.1180. [DOI] [PubMed] [Google Scholar]
- Danielson KG, Baribault H, Holmes DF, Graham H, Kadler KE, Iozzo RV. Targeted disruption of decorin leads to abnormal collagen fibril morphology and skin fragility. J. Cell Biol. 1997;136:729–743. doi: 10.1083/jcb.136.3.729. [DOI] [PMC free article] [PubMed] [Google Scholar]
- Dayan D, Hiss Y, Hirshberg A, Bubis JJ, Wolman M. Are the polarization colors of picrosirius red-stained collagen determined only by the diameter of the fibers? Histochemistry. 1989;93:27–29. doi: 10.1007/BF00266843. [DOI] [PubMed] [Google Scholar]
- Fisher LW, Stubbs JT, Young MF. Antisera and cDNA probes to human and certain animal model bone matrix noncollagenous proteins. Acta Orthop. Scand. Suppl. 1995;266:61–65. [PubMed] [Google Scholar]
- Gadaleta SJ, Paschalis EP, Betts F, Mendelsohn R, Boskey AL. Fourier transform infrared spectroscopy of the solution-mediated conversion of amorphous calcium phosphate to hydroxyapatite: new correlations between X-ray diffraction and infrared data. Calcif. Tissue Int. 1996;58:9–16. doi: 10.1007/BF02509540. [DOI] [PubMed] [Google Scholar]
- Geng Y, McQuillan D, Roughley PJ. SLRP interaction can protect collagen fibrils from cleavage by collagenases. Matrix Biol. 2006;25:484–491. doi: 10.1016/j.matbio.2006.08.259. [DOI] [PubMed] [Google Scholar]
- Gerstenfeld LC, Riva A, Hodgens K, Eyre DR, Landis WJ. Post-translational control of collagen fibrillogenesis in mineralizing cultures of chick osteoblasts. J. Bone Miner. Res. 1993;8:1031–1043. doi: 10.1002/jbmr.5650080903. [DOI] [PubMed] [Google Scholar]
- Hedbom E, Heinegard D. Interaction of a 59-kDa connective tissue matrix protein with collagen I and collagen II. J. Biol. Chem. 1989;264:6898–6905. [PubMed] [Google Scholar]
- Hodge AJ, Petruska JA. Recent studies with the electron microscope on ordered aggregates of the tropocollagen molecule. In: Ramachandran GN, editor. Aspects of Protein Structure. Academic Press; New York: 1963. pp. 289–300. [Google Scholar]
- Hoshi K, Kemmotsu S, Takeuchi Y, Amizuka N, Ozawa H. The primary calcification in bones follows removal of decorin and fusion of collagen fibrils. J. Bone Miner. Res. 1999;14:273–280. doi: 10.1359/jbmr.1999.14.2.273. [DOI] [PubMed] [Google Scholar]
- Iozzo RV. The family of the small leucine-rich proteoglycans: key regulators of matrix assembly and cellular growth. Crit. Rev. Biochem. Mol. Biol. 1997;32:141–174. doi: 10.3109/10409239709108551. [DOI] [PubMed] [Google Scholar]
- Iozzo RV. The biology of the small leucine-rich proteoglycans. Functional network of interactive proteins. J. Biol. Chem. 1999;274:18843–18846. doi: 10.1074/jbc.274.27.18843. [DOI] [PubMed] [Google Scholar]
- Junqueira LC, Bignolas G, Brentani RR. Picrosirius staining plus polarization microscopy, a specific method for collagen detection in tissue sections. Histochem. J. 1979;11:447–455. doi: 10.1007/BF01002772. [DOI] [PubMed] [Google Scholar]
- Keene DR, San Antonio JD, Mayne R, McQuillan DJ, Sarris G, Santoro SA, Iozzo RV. Decorin binds near the C terminus of type I collagen. J. Biol. Chem. 2000;275(29):21801–21804. doi: 10.1074/jbc.C000278200. PMID: 10823816. [DOI] [PubMed] [Google Scholar]
- Landis WJ, Song MJ, Leith A, McEwen L, McEwen BF. Mineral and organic matrix interaction in normally calcifying tendon visualized in three dimensions by high-voltage electron microscopic tomography and graphic image reconstruction. J. Struct. Biol. 1993;110:39–54. doi: 10.1006/jsbi.1993.1003. [DOI] [PubMed] [Google Scholar]
- Mankani MH, Kuznetsov SA, Fowler B, Kingman A, Robey PG. In vivo bone formation by human bone marrow stromal cells: effect of carrier particle size and shape. Biotechnol. Bioeng. 2001;72:96–107. doi: 10.1002/1097-0290(20010105)72:1<96::aid-bit13>3.0.co;2-a. [DOI] [PubMed] [Google Scholar]
- Mochida Y, Duarte WR, Tanzawa H, Paschalis EP, Yamauchi M. Decorin modulates matrix mineralization in vitro. Biochem. Biophys. Res. Commun. 2003;305:6–9. doi: 10.1016/s0006-291x(03)00693-4. [DOI] [PubMed] [Google Scholar]
- Mochida Y, Parisuthiman D, Kaku M, Hanai J, Sukhatme VP, Yamauchi M. Nephrocan, a novel member of the small leucine-rich repeat protein family, is an inhibitor of transforming growth factor-beta signaling. J. Biol. Chem. 2006a;281:36044–36051. doi: 10.1074/jbc.M604787200. [DOI] [PubMed] [Google Scholar]
- Mochida Y, Parisuthiman D, Yamauchi M. Biglycan is a positive modulator of BMP-2 induced osteoblast differentiation. Adv. Exp. Med. Biol. 2006b;585:101–113. doi: 10.1007/978-0-387-34133-0_7. [DOI] [PubMed] [Google Scholar]
- Parisuthiman D, Mochida Y, Duarte WR, Yamauchi M. Biglycan modulates osteoblast differentiation and matrix mineralization. J. Bone Miner. Res. 2005;20:1878–1886. doi: 10.1359/JBMR.050612. [DOI] [PubMed] [Google Scholar]
- Pienkowski D, Doers TM, Monier-Faugere MC, Geng Z, Camacho NP, Boskey AL, Malluche HH. Calcitonin alters bone quality in beagle dogs. J. Bone Miner. Res. 1997;12:1936–1943. doi: 10.1359/jbmr.1997.12.11.1936. [DOI] [PubMed] [Google Scholar]
- Pornprasertsuk S, Duarte WR, Mochida Y, Yamauchi M. Lysyl hydroxylase-2b directs collagen cross-linking pathways in MC3T3-E1 cells. J. Bone Miner. Res. 2004;19:1349–1355. doi: 10.1359/JBMR.040323. [DOI] [PubMed] [Google Scholar]
- Pornprasertsuk S, Duarte WR, Mochida Y, Yamauchi M. Overexpression of lysyl hydroxylase-2b leads to defective collagen fibrillogenesis and matrix mineralization. J. Bone Miner. Res. 2005;20:81–87. doi: 10.1359/JBMR.041026. [DOI] [PubMed] [Google Scholar]
- Reed CC, Iozzo RV. The role of decorin in collagen fibrillogenesis and skin homeostasis. Glycoconj. J. 2002;19:249–255. doi: 10.1023/A:1025383913444. [DOI] [PubMed] [Google Scholar]
- Rees SG, Shellis RP, Embery G. Inhibition of hydroxyapatite crystal growth by bone proteoglycans and proteoglycan components. Biochem. Biophys. Res. Commun. 2002;292:727–733. doi: 10.1006/bbrc.2002.6699. [DOI] [PubMed] [Google Scholar]
- Ruhland C, Schonherr E, Robenek H, Hansen U, Iozzo RV, Bruckner P, Seidler DG. The glycosaminoglycan chain of decorin plays an important role in collagen fibril formation at the early stages of fibrillogenesis. Febs. J. 2007;274:4246–4255. doi: 10.1111/j.1742-4658.2007.05951.x. [DOI] [PubMed] [Google Scholar]
- Siperko LM, Landis WJ. Aspects of mineral structure in normally calcifying avian tendon. J. Struct. Biol. 2001;135:313–320. doi: 10.1006/jsbi.2001.4414. [DOI] [PubMed] [Google Scholar]
- Sugars RV, Milan AM, Brown JO, Waddington RJ, Hall RC, Embery G. Molecular interaction of recombinant decorin and biglycan with type I collagen influences crystal growth. Connect. Tissue Res. 2003;44(Suppl 1):189–195. doi: 10.1080/713713596. [DOI] [PubMed] [Google Scholar]
- Tong W, Glimcher MJ, Katz JL, Kuhn L, Eppell SJ. Size and shape of mineralites in young bovine bone measured by atomic force microscopy. Calcif. Tissue Int. 2003;72:592–598. doi: 10.1007/s00223-002-1077-7. [DOI] [PubMed] [Google Scholar]
- Traub W, Arad T, Weiner S. Three-dimensional ordered distribution of crystals in turkey tendon collagen fibers. Proc. Natl. Acad. Sci. U S A. 1989;86:9822–9826. doi: 10.1073/pnas.86.24.9822. [DOI] [PMC free article] [PubMed] [Google Scholar]
- Vogel KG, Paulsson M, Heinegard D. Specific inhibition of type I and type II collagen fibrillogenesis by the small proteoglycan of tendon. Biochem. J. 1984;223:587–597. doi: 10.1042/bj2230587. [DOI] [PMC free article] [PubMed] [Google Scholar]
- Vogel KG, Trotter JA. The effect of proteoglycans on the morphology of collagen fibrils formed in vitro. Coll. Relat. Res. 1987;7:105–114. doi: 10.1016/s0174-173x(87)80002-x. [DOI] [PubMed] [Google Scholar]
- Weber IT, Harrison RW, Iozzo RV. Model structure of decorin and implications for collagen fibrillogenesis. J. Biol. Chem. 1996;271:31767–31770. doi: 10.1074/jbc.271.50.31767. [DOI] [PubMed] [Google Scholar]
- Yamauchi M. Collagen: the major matrix molecule in mineralized tissues. In: Anderson JJB, Garner SC, editors. Calcium and Phosphorus in Health and Disease. CRC Press, Inc.; Boca Raton: 1995. pp. 127–145. [Google Scholar]
- Yamauchi M, Katz EP. The post-translational chemistry and molecular packing of mineralizing tendon collagens. Connect. Tissue Res. 1993;29:81–98. doi: 10.3109/03008209309014236. [DOI] [PubMed] [Google Scholar]
- Yamauchi M, Shiiba M. Lysine hydroxylation and cross-linking of collagen. Methods Mol. Biol. 2008;446:95–108. doi: 10.1007/978-1-60327-084-7_7. [DOI] [PubMed] [Google Scholar]
- Yamauchi M, Young DR, Chandler GS, Mechanic GL. Cross-linking and new bone collagen synthesis in immobilized and recovering primate osteoporosis. Bone. 1988;9:415–418. doi: 10.1016/8756-3282(88)90124-x. [DOI] [PubMed] [Google Scholar]