

Abstract
Background
Sudden cardiac death due to arrhythmia in the settings of chronic myocardial infarction (MI) is an important clinical problem. Arrhythmic risk post-MI continues indefinitely even if heart failure and acute ischemia are not present due to the anatomic substrate of the scar and border zone (BZ) tissue.
Objective
We sought to determine mechanisms of arrhythmia initiation and termination in a rabbit model of chronic MI.
Methods and Results
Ligation of the lateral division of the left circumflex artery was performed 72 ± 29 days before acute experiments (n=11). Flecainide (2.13 ± 0.64 μM) was administered to promote sustained arrhythmias, which were induced with burst pacing or a multiple shock protocol (4 pulses, 140 – 200 ms coupling interval). Panoramic optical mapping with Blebbistatin (5 μM) revealed monomorphic ventricular tachycardia (VT) maintained by a single mother rotor (cycle length (CL) = 174.7 ± 38.4 ms) as the primary mechanism of arrhythmia. Mother rotors were anchored to the scar or BZ for 16 of 19 rotor locations recorded. Cardioversion thresholds (CVTs) were determined at various phases throughout the VT CL from external shock electrodes. CVTs were found to be phase-dependent and the max vs. min CVT was 7.8 ± 1.9 vs. 4.1 ± 1.6 V/cm, respectively (p = 0.005). Antitachycardia pacing was found effective in only 2.7% of cases in this model.
Conclusions
These results indicate that scar and BZ tissue heterogeneity provide the substrate for VT by attracting and stabilizing rotors. Additionally, a significant reduction in CVT may be achieved by appropriately-timed shocks in which the shock-induced virtual electrode polarization interacts with the rotor to destabilize VT.
Introduction
Sudden cardiac death (SCD) occurring in the chronic phase (months to years) of myocardial infarction (MI) is an important clinical problem.1 Modern medical therapy has led to smaller infarcts and less incidence of post-MI arrhythmias; however the overall population risk remains stable due to an aging population and greater post-MI survival.2 Ventricular arrhythmias in chronic MI are often due to sustained ventricular tachycardia (VT) that is thought to be reentrant in nature. The substrate for sustained VT develops in the first two weeks after MI and appears to remain indefinitely. The risk for arrhythmia remains even if acute ischemia and heart failure are not present.1
Clinical trials have demonstrated the efficacy of defibrillation therapy and the superiority of implantable cardioverter defibrillator (ICD) therapy over pharmacologic therapy for those at risk for ventricular arrhythmias, among whom post-MI patients are a majority.3, 4 However, most basic studies of the mechanisms of cardioversion and defibrillation are carried out on healthy animal hearts. To optimize and improve ICD therapy for post-MI patients, the mechanisms of arrhythmia maintenance and termination in the settings of chronic MI must be further explored.
The mechanisms of reentrant VT in the settings of chronic MI have been extensively studied in the canine model of late (∼5-day) infarction.5-9 The canine model is known to have an epicardial border zone (BZ: surviving tissue neighboring the infarct), which is characterized by slower, more anisotropic propagation and gap junction and ion channel remodeling that provide the substrate for reentrant VT.5, 9 However, few studies explored this model beyond approximately 5 days post-MI. Thus, data on arrhythmia mechanisms and cardioversion in chronic infarction (weeks to months post-MI) are limited. The rabbit model of chronic MI has been explored to a lesser extent,10-12 but may also be a valuable model of infarction. The rabbit heart has been found to be most similar to the human heart with respect to both the effective size and wave patterns during arrhythmia, both of which are principal parameters for the investigation of arrhythmia mechanisms.13 Additionally, the rabbit heart allows for optical mapping of electrical activation on the entire epicardial surface through the use of panoramic optical imaging techniques.14 Although this technology has been implemented in at least one system capable of imaging larger hearts,15 larger animal models are more typically studied with epicardial electrodes or endocardial mapping catheters. Both of these techniques are susceptible to electrical artifacts during defibrillation shocks and thus, are not ideal for studying the mechanisms of cardioversion and defibrillation.
We have previously explored the mechanisms of arrhythmia in the rabbit model of chronic MI.10 We reported a significant increase in both vulnerability to shock-induced arrhythmias and an increased incidence of sustained arrhythmias in the chronic MI model compared to control. We also discovered that arrhythmia wavefronts were often associated with the BZ. However, only a single, limited, anterior field of view was used. Therefore, complete information about wavefront propagation and reentrant morphologies could not be determined.
Our group and collaborators have explored the idea that defibrillation energy may be significantly reduced by appropriately timed shocks, which interact with the core of reentry and can destabilize and possibly terminate reentrant VT. This idea was first formulated in theory using a simple Fitz-Hugh Nagumo model16 and later tested in a more realistic bidomain model with Luo-Rudy ion channel kinetics.17 We then began validating this idea experimentally. However, both experimental models have been somewhat limited. In a rabbit model of acute MI,18 secondary sources of excitation near the core of reentry were found to destabilize spiral waves in a phase-dependant manner. However, a rather simple isolated right ventricular free wall was used as the experimental model. Thus, the clinical relevance of this model is limited and it was unclear if the low-voltage cardioversion concept would remain relevant in an intact heart. Additionally, our group has shown phase-dependant defibrillation thresholds in a canine model of late MI19 with the use of epicardial mapping electrodes. However, in this study, post-shock wavefronts could not be recorded due to shock-induced electrical artifacts. Therefore, the mechanisms of termination remained unknown.
The present study represents the culmination of our idea from theory to a simplified animal model to a clinically relevant animal model in which the mechanisms of arrhythmia and low-voltage cardioversion are fully visualized by panoramically imaging the entire epicardial surface. To test our hypothesis that appropriately-timed shocks may significantly reduce the cardioversion threshold (CVT), we measured the CVT at different coupling intervals throughout the VT cycle length. As in previous studies of post-infarction arrhythmia,20 flecainide was used in this study to promote sustained VT.
Materials and Methods
Survival Surgery
The experimental protocol was approved by the Institutional Animal Care and Use Committee of Washington University. Sixteen New Zealand white rabbits of either sex were used in this study. Three rabbits were not subjected to survival surgery and were used as control and thirteen rabbits underwent in vivo survival surgery to induce chronic MI via coronary ligation. The average age of the animals prior to surgery was 136 ± 23 days. In vivo survival surgery was performed as previously described.10 One rabbit died immediately after coronary ligation due to sustained ventricular fibrillation (VF) despite administration of lidocaine and attempts to defibrillate. An additional rabbit was found dead 10 days post-surgery with signs of congestive heart failure upon necropsy.
Optical Mapping Experiments
Rabbits were allowed to heal for an average of 72 ± 29 days before acute optical mapping experiments. Rabbits were injected intravenously with sodium pentobarbital (50 mg/kg) and 1000-2000 U heparin. Hearts were quickly excised, placed on a Langendorff apparatus, and perfused with oxygenated modified Tyrode's solution as previously described.21 Hearts were stained by a gradual injection of 50 μL of stock solution (1.25 mg/ml) of the voltage-sensitive dye di-4-ANEPPS (Molecular Probes, Eugene, OR) diluted in dimethylsulfoxide (DMSO; Sigma Aldrich, Inc., St. Louis, MO), delivered by a micro-pump over 5 min. The excitation-contraction uncoupler Blebbistatin (BB, 5 μM; Fisher Scientific, Fair Lawn, NJ) was added to the perfusate to suppress motion artifacts in the optical recordings.22 Hearts were panoramically imaged with three photodiode arrays (PDAs: Model C4675-103, Hamamatsu, Bridgewater, NJ) as previously described.14 To mimic the electrode configuration of external defibrillation, two stainless steal mesh electrodes were placed vertically into the solution chamber with one mesh facing the lateral RV wall and the other mesh facing the lateral LV wall with 10 cm spacing between the meshes. Shocks were delivered from two computer-controlled regulated power supplies (BOP 100-4M; Kepco, Inc., Flushing, NY) connected in parallel to provide a maximum voltage of ±100 V and a maximum current of 8 A.
Experimental Protocol
After staining with di-4-ANEPPS, recordings of sinus rhythm and RV enodocardial pacing at a basic cycle length of 300 ms were collected. The pacing current was adjusted to 2 times the pacing threshold. The effective refractory period (ERP) was measured by an S1-S2 protocol.
Ventricular arrhythmias were then initiated with T-wave shocks, burst pacing, or via the entrainment mechanism with a multiple shock protocol. The multiple shock protocol consisted of four 5 V/cm shocks with the first shock applied during the T-wave and subsequent shocks delivered at coupling intervals of 140-200 ms. To promote sustained arrhythmias lasting more than several seconds, 1 μM flecainide was added to the perfusate.20 After 30 minutes, the pacing threshold and ERP were again measured and arrhythmias were initiated. If sustained arrhythmias (lasting several minutes or more) were not initiated, the dose of flecainide was increased in 0.5 μM increments and the procedure was repeated.
Once sustained ventricular arrhythmias were induced, 1-10 V/cm 10 ms monophasic square wave shocks were delivered at approximately 20, 40, 60, 80, or 100% of the VT cycle length (CL) triggered and determined from a Lead I ECG signal. For each coupling interval, shocks were delivered starting at 1 V/cm with increasing field strengths until termination was achieved. Then, the arrhythmia was re-initiated and the next coupling interval was tested. Arrhythmias were terminated and re-initiated for the remainder of the experiment, with an average of 69.1 ± 40.9 shock attempts per heart. Efficacy of antitachycardia pacing (ATP) was also tested by application of 8 pulses at 88% VT CL from the RV endocardial pacing electrode.
Data Analysis
Reconstruction of the 3D geometry of the heart and texture-mapping of optical signals onto the heart surface were performed as previously described.14 Typical electrophysiologic data analyses were then performed including calculation of isochronal maps, phase plane analysis,23 and calculation of apparent conduction velocity (CV) vector fields.24
Heart Surface Visualization
Because the 3D mesh representing the heart surface is represented by an equally spaced grid of (θi, ϕi) where θ ranges from 0° to 360° and ϕ ranges from -90° to +90°, it is easily translated into a projected 2D surface (x, y). However, just as distances on a Mercator world map are distorted at the north and south poles, this method also distorts the apex of the heart. Considering this limitation, the Mercator projection is still useful for some calculations that do not require knowledge of absolute distance between data points and for visualizing the entire activation sequence on the surface of the heart without needing multiple views. Both the heart surface and 2D Mercator projections are used throughout this paper. For all projections, the heart surface was cut and unwrapped at the center of the posterior surface of the heart. Therefore, the anterior septum is located on the center of all projection maps (see solid white line in Figure 1B and 1D).
Figure 1.

Characteristics of a typical chronic MI rabbit heart. A-B. Heart surface and corresponding 2D projection activation maps during RV pacing. Solid white line indicates the septum. Dashed white line indicates the infarct region. Asterisks indicate infarct region from which signals in panel H correspond. C-D. Heart surface and corresponding 2D projection activation maps during sinus rhythm. E. Masson trichrome histology of short axis slices from apex to base. Scar tissue in infarct region is blue. F. Photograph of anterior view of heart. Infarct region is white tissue near apex. G. High resolution histology image corresponding to red box in E. Red arrows indicate thin layer of surviving endocardial BZ. G. Optical action potentials (Vm) and dVm/dt from locations indicated with asterisks in panels A and B during RV endocardial pacing. dVm/dtmax is indicated with a black dot on each signal.
Histology
Histology and 3D reconstruction of tissue sections was performed as previously described.25
Results
Rabbit model of Chronic MI
A typical heart with chronic MI is shown in Figure 1. Activation maps corresponding to RV endocardial pacing and sinus rhythm are shown in Figures 1A-1B and Figures 1C-1D, respectively. In both cases, crowding of isochrones and conduction slowing is observed at the infarct region (see asterisks in Figures 1A-1B). Figure 1H shows raw optical traces (Vm) from the locations indicated with asterisks in Figures 1A-1B. The upstrokes of these action potentials have two distinct components as can be observed by the corresponding dVm/dt signals. This may be due to light scattering in the optical signals as activation spreads around the infarct or alternatively, the slow activation in this region may occur via the endocardial BZ. Figure 1G (red arrows) shows the thin layer of surviving endocardial BZ typical in the rabbit model of chronic MI.
Virtual Electrode Polarization
Maps of virtual electrode polarization (VEP) were created for each heart from ±5 V/cm T-wave shocks applied at coupling intervals of 150 – 160 ms (Figure 2). The magnitude of VEP was calculated as the difference between Vm at shock-end and Vm of the previous control beat (Figure 2C). VEP maps for both shock polarities are shown in Figures 2B and 2D. A very heterogeneous pattern of VEP is observed on the epicardial surface as several factors contribute to the VEP including electrode configuration, heart geometry, and macro- and microscopic tissue heterogeneities.26, 27 In this example, the RV- shock produced one extra-beat. The post-shock activation sequence is shown in Figure 2F. The first epicardial activation is not observed until 30 ms after the shock, indicating that activation may have spread transmurally from the depolarized region on the RV to the hyperpolarized region just above the infarct on the LV. This experimental finding agrees with previous simulations suggesting transmural propagation of post-shock wavefronts.28, 29
Figure 2.

Shock-induced virtual electrode polarization (VEP). A. Photograph of anterior view of heart. Infarct region is indicated with a dashed white line. B. Heart surface and corresponding 2D projection of shock-induced VEP for a 5 V/cm LV- shock. White solid and dashed lines indicate septum and infarct region, respectively. C. Optical action potentials showing positive and negative shock-induced polarization overlaid onto control action potentials. Time of shock is indicated with dashed lines. Locations of optical action potentials are indicated with asterisks on 2D projections in panels B and D. D. Heart surface and corresponding 2D projection of shock-induced VEP for a 5 V/cm RV- shock. E. Optical action potential from location indicated with a white ‘x’ in 2D map of panel F showing time of earliest post-shock activation which resulted in one shock-induced extra-beat. Time of shock is indicated with dashed lines. F. Heart surface and corresponding 2D projection activation maps of post-shock activation sequence.
Initiation of sustained ventricular arrhythmias
In all 11 chronic MI hearts studied, all induced ventricular arrhythmias self-terminated within 10 seconds due to meandering of reentry followed by self-termination. In order to study the mechanisms of sustained arrhythmias as well as low-voltage cardioversion, flecainide was added to the perfusate of 8 hearts to promote sustained ventricular arrhythmias. The minimum dose necessary for sustained VT was found to be 2.13 ± 0.64 μM. Measurements of apparent CV, ERP, and wavelength were compared before administration of flecainide and after administration of the final dose of flecainide required for sustained VT. These results are shown in Table 1 along with the p-value resulting from a paired t-test comparing the data before and after flecainide.
Table 1.
Electrophysiologic parameters before and after administration of flecainide. p-value is a result of a paired t-test for each parameter before and after flecainide. ERP: effective refractory period, CV: conduction velocity, WL: wavelength, Flec: flecainide.
| Before Flec | After Flec | p-value | |
|---|---|---|---|
| ERP (ms) | 172.1 ± 3.9 | 212.5 ± 8.9 | 4.80E-05 |
| CV (cm/s) | 49.0 ± 7.2 | 36.1 ± 10.3 | 0.002 |
| WL (cm) | 8.45 ± 1.31 | 7.66 ± 2.19 | 0.089 |
Entrainment via the multiple shock protocol was found to be the most reliable method of arrhythmia induction in this model. A typical example is shown in Figure 3. The first shock was applied during the T-wave or repolarization phase of the action potential (see top panel). Subsequent shocks occurred later and later in the repolarization phase due to progressive shortening of the action potential duration via the entrainment mechanism. Upon initiation, meandering of the reentrant wavefront was always observed (see activation maps in Figure 3). Meandering would last from several beats up to several seconds at which time the VT would either stabilize into monomorphic VT or self-terminate.
Figure 3.

Initiation of stable VT by multiple shock protocol. Heart and VT morphology correspond to Figure 4, panels B and C. Top: Optical trace (blue) showing application of four successive T-wave shocks (red, 5 V/cm, 168 ms between shocks) which induced sustained VT. Numbers 1 – 6 in top trace correspond to activation maps 1 – 6 in the lower panels. Maps 1 – 4 show constant meandering of the reentrant wavefronts. However, at map 5, activation stabilizes into one spiral wave anchored in the infarct region. An additional rotation of VT is shown in map 6.
Mechanisms of sustained VT in chronic MI
Once initiated and stabilized, sustained monomorphic VT was observed with an average cycle length of 174.7 ± 38.4 ms. A total of 26 different VT morphologies were observed in 8 hearts with sustained VT (3.25 ± 1.16 morphologies/heart). All VTs were reentrant in nature with 23 of the 26 morphologies (88.5%) corresponding to a single rotor or spiral wave with a constant point of phase singularity (PS) observed on the epicardial surface. The remaining 3 morphologies appeared reentrant, but without a visible PS on the epicardium. In 4 hearts, spiral waves were found to propagate in both the clockwise and counterclockwise direction around essentially the same location (Figure 4), resulting in a total of 19 different areas of stable PS. Sixteen of the 19 areas of stable PS (84.2%) coincided with the infarct region or the edge of the infarct where healthy myocardium and scar tissue merge. This was determined by overlaying the heart surface map of PS onto the 3D anatomic map or from 3D histology reconstructions.
Figure 4.

Sustained stable VT anchored to infarct region. A. Photograph of anterior view of heart. Red arrow indicates location of suture used to ligate a branch of the left coronary artery. B. Masson trichrome histology of short axis slices from apex to base. Scar tissue in infarct region is blue. Red arrow indicates suture location. C. 3D histology reconstruction showing infarct region in blue as determined from Masson trichrome staining. The location of the suture is indicated with the red arrow. D. Heart surface phase map of stable reentrant VT rotating clockwise near the region of the suture. E. Heart surface map of locations of phase singularity (PS) over several rotations of VT. F. Lead I ECG signal during clockwise VT. This was the predominant VT morphology with 69% of inductions resulting in clockwise rotation. G-I. Similar panels as D, E, and F only for counterclockwise VT. This morphology was less common with only 11% of inductions resulting in counterclockwise rotation.
Efficacy of antitachycardia pacing
The efficacy of ATP was tested in 6 hearts with a minimum of 3 trials per heart. ATP terminated VT in only 1 of 34 trials (2.9%).
Mechanisms of termination by appropriately-timed lower-energy shocks
We explored the hypothesis that different coupling intervals would require different cardioversion shock strengths. Therefore, the CVT was measured for coupling intervals of approximately 20, 40, 60, 80, and 100% of the VT CL as determined and triggered from a Lead I ECG. This method relies on virtual electrode polarization or secondary sources of excitation interacting with the reentry core to either destabilize or terminate VT. Thus, all propagating waves may not be immediately terminated with this method. Figure 5 shows an example of shock-induced destabilization, which led to termination within 5 post-shock beats. In this example, reentry first detached from the infarct region and meandered for several rotations before termination when the point of PS collided with the atrio-ventricular groove. These data show that the infarct and BZ may play an important role in stabilizing and sustaining VT in chronic MI. Additionally, it shows that detaching reentry from the scar may lead to VT termination. Similar phase-dependent mechanisms of termination of sustained VT were observed in all hearts studied.
Figure 5.

Destabilization and termination of stable VT. Heart and VT morphology correspond to Figures 3 and 4. Top: Optical trace (blue) showing 5 rotations of stable VT before shock application (red trace, 9 V/cm). Numbers 1 – 5 in top trace correspond to activation maps 1 – 5 in lower panels. The first post-shock activation appears approximately 50 ms after the shock from the posterior septal region (activation map 2, left and right edges of map). Unstable VT continues for 3 additional beats and appears to use the septum in the reentrant pathway. Map 5 shows the last activation at approximately 575 ms. At this time, the point of PS collides with the atrio-ventricular groove and VT is terminated.
To further explore the mechanisms of phase-dependence of shock application, two detailed examples are presented in Figures 6 and 7. Figure 6A shows anterior and posterior photographs of the heart along with heart surface phase maps of stable VT anchored to the infarct region at time t = 0 ms. Projected surface phase maps from time t = 0 ms to t = 440 ms are shown in Figure 6B. The septum and infarct region are shown with solid and dashed white lines, respectively on all maps. One complete rotation of reentry can be observed from 0 ms to 236 ms. At t = 238 ms, a 3 V/cm shock is applied. At the time of shock, the wavefront is nearly vertical and is slowly propagating through the infarct region. Secondary sources of excitation are created at areas marked with asterisks in panel t = 252 ms. Because of the slow wavefront propagation during this time, the secondary sources excite the excitable gap from the opposite direction. The reentrant wavefront collides with this depolarized region (t = 280 ms) and immediately terminates VT. Frames that follow show gradual repolarization.
Figure 6.

Termination of VT by a shock applied at the correct phase. A. Photographs and heart surface phase maps of anterior and posterior views of heart. Dashed white lines correspond to infarct region. Solid white line corresponds to septum. Dashed green line in posterior view corresponds to where the heart surface map was cut and unwrapped to produce the 2D projection maps. Heart surface phase maps correspond to t = 0 ms. B. 2D projection phase maps from time t = 0 to t = 440 ms. One complete rotation of VT can be observed from t = 0 to t = 236 ms. At t = 238 ms, a 3 V/cm shock is applied which terminates VT (see text for details). Asterisks and arrows indicate shock-induced secondary sources of excitation. C. Optical action potential (black) showing time of shock application (red).
Figure 7.
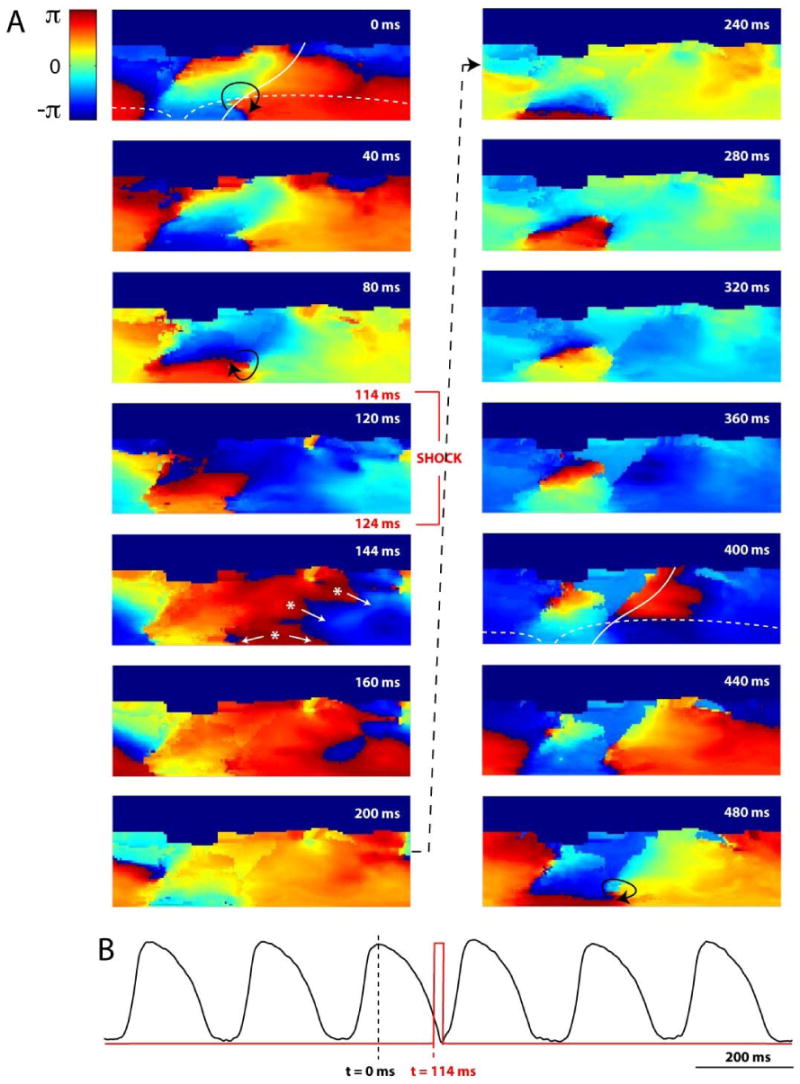
Shock applied at incorrect phase resulting in resetting of VT. Heart and VT morphology are the same as Figure 6, only phase of shock application is different. t = 0 ms corresponds to same phase of VT as Figure 6. A. 2D projection phase maps of sustained VT. At t = 114 ms, a 3 V/cm shock is applied which results in resetting of VT (see text for details). Asterisks and arrows indicate shock-induced secondary sources of excitation. B. Same optical action potential (black) as in Figure 6 showing time of shock application (red) and slight resetting of VT.
In Figure 7, nearly the same reentrant VT is shown with t = 0 ms corresponding to the same phase of reentry as in Figure 6. A 3 V/cm shock is applied at t = 114 ms and the reentrant wavefront is approximately π rad (or 50%) out of phase from Figure 6. In this case, the shock accelerates the reentrant wavefront (t = 144, 160 ms) and at t = 200 ms, it appears as if termination may be achieved. However, at t = 240 ms, the wavefront reemerges. It seems as if the wavefront may hit a refractory region, but at t = 400 ms excitation appears from the septal region and continues to propagate. The reentrant VT resumes an almost identical pattern of excitation, still anchored to the infarct. The shock acted to reset the reentry slightly due to initial acceleration of the wavefront, but termination was not achieved.
Figure 8 shows an example plot of coupling interval versus CVT for one VT morphology after adjusting for the exact VT CL with the coupling interval now represented in terms of phase (0 - 2π rad). As can be observed in the plot, dramatically different CVTs were determined for shocks applied at 0.6 rad (threshold = 8 V/cm) versus 2.4 rad (threshold = 2 V/cm). The CVTs at the favorable versus unfavorable phase for each animal were determined and were found to be: 7.75 ± 1.89 V/cm versus 4.13 ± 1.55 V/cm, p = 0.005. Figure 8 also indicates one instance in which the shock caused reentry to detach from the infarct region and meander across the heart for several rotations before re-attaching to the same location (5.6 rad, 5 V/cm).
Figure 8.
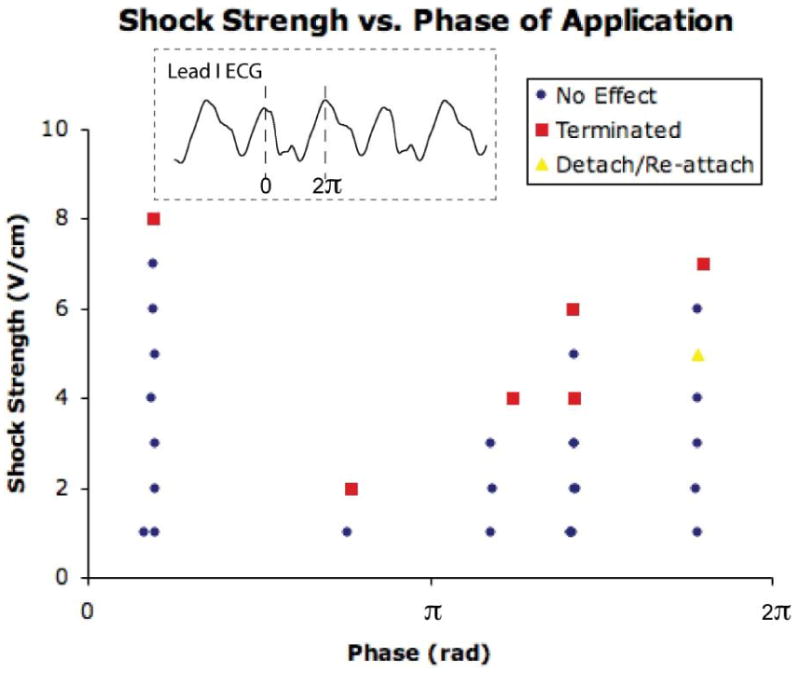
Plot of phase versus CVT for a single VT morphology. Phase (x-axis, rad) was determined from a Lead I ECG. Peak amplitude in Lead I corresponds to phase = 0 rad (see inset). The first shock delivered at each phase was 1 V/cm. Shock strength was increased until termination of VT was observed. The CVT varied greatly as a function of phase. In this example, the maximum CVT was 8 V/cm at a phase of 0.6 rad and the minimum was 2 V/cm at a phase of 2.4 rad.
A total of 553 shocks were applied to 8 hearts (69.1 ± 40.9 shocks/heart). Overall, shocks resulted in termination of VT 62 times (11.2%). Instances of detaching/re-attaching were observed in 4 of 8 hearts for a total of 20 times (3.6%).
Discussion
In this study, we investigated the mechanisms of arrhythmia maintenance and termination in a rabbit whole heart model of chronic MI. In contrast to previous studies of chronic MI in the rabbit heart,10 we found that all ventricular arrhythmias self-terminated within approximately 10 seconds of initiation. Administration of 1 – 2.5 μM flecainide resulted in sustained VT, which was often maintained by a single spiral wave or rotor. The scar tissue in the infarct region as well as the slow conduction of the BZ acted to attract and stabilize the rotor with 84.2% of locations of PS corresponding to the infarct region or the border of the infarct and healthy tissue. We found that monophasic far-field cardioversion shocks destabilized and/or terminated sustained VT in a phase-dependent manner. The shock strength at the unfavorable versus favorable phase was found to be 7.75 ± 1.89 V/cm versus 4.13 ± 1.55 V/cm, p = 0.005, respectively.
Previously, our group reported an increase in vulnerability to shock-induced arrhythmias as well as an increase in the number of long-lasting arrhythmias (> 30 sec) in the rabbit model of chronic MI compared to control hearts.10 This prior study revealed that a single, cathodal shock produced long-lasting arrhythmias 59% of the time in the infarct hearts. However, in the present study, we found that all arrhythmias self-terminated within approximately 10 seconds of initiation. The major reason for this discrepancy is likely the different excitation-contraction (EC) uncouplers used. In our previous study, 2,3-butanedione monoxime (BDM) was used, whereas in this study, we used the new EC uncoupler, BB.22 BDM is known to shorten action potential duration and wavelength and its use results in a greater incidence of sustained arrhythmias.30 BB, on the other hand, does not significantly alter ECG or action potential morphology, refractory periods, or calcium transients.22 Thus, we conclude that application of BB more closely reproduces the in vivo rabbit heart model compared to other EC uncouplers. A recent in vivo study on the post-infarction rabbit heart revealed that only 23% of hearts supported sustained VT lasting more than 10 seconds.11
The goal of the present study was to investigate the mechanisms of sustained VT as well as cardioversion in the rabbit whole heart model of chronic MI. Thus, 1 – 2.5 μM flecainide was administered to promote sustained VT (lasting several minutes or more). Flecainide, a class IC anti-arrhythmic drug is known to be pro-arrhythmic,31 especially in the settings of prior MI.20, 32 In the present study, administration of 2.13 ± 0.64 μM flecainide produced sustained VT in all 8 hearts in which it was administered. These findings are consistent with previous reports on flecainide administration in the canine model of MI. Coromilas et al. also found that flecainide was required to produce sustained VT (> 30 sec) in a canine model of 4-day MI.20 Our observations in the chronic rabbit infarction model as well as earlier observations from the canine infarction model suggest that infarction itself is not sufficient requirement for sustained VT/VF. Low excitability is likely to be an additional requirement for shortening the wavelength needed to maintain the reentry circuit around an anatomical obstacle. In this experiment we used flecainide to reduce excitability. Ischemia is another factor that would promote sustained VT/VF.
Upon initiation, the reentrant wavefronts first meandered across the heart before stabilizing into monomorphic VT (Figure 3), which was often maintained by a single spiral wave (mother rotor) in the infarct region (Figure 4). If the VT self-terminated, it was during the meandering phase. Once stabilized, VT lasted until a defibrillation shock was applied or, in once instance, it was pace-terminated with ATP. If no therapy was applied, the stable VT could last for 30 minutes or more (this was the longest time allowed). In some instances, shock application immediately terminated VT (Figure 6). However, if immediate termination was not achieved, similar meandering behavior was also observed upon termination after VT was destabilized from the infarct region (Figure 5). In a small number of cases (3.6% of shock applications), VT would meander for several rotations after the shock before re-attaching to the infarct region and the same VT morphology would resume.
In the present study, we found that VT was maintained by the mother rotor mechanism:33 a single rotor with a stable point of PS visible on the epicardial surface in 88.5% of observed VT morphologies. The remaining 3 VT morphologies also appeared reentrant but a point of PS was not visible on the epicardium. A single rotor as the mechanism of sustained VT in the chronic MI rabbit heart is a new finding, as previous studies had a limited field of view in which the presence of a spiral wave and reentrant activation patterns could not always be confirmed. Panoramic imaging techniques afford the opportunity to investigate activation on the entire epicardial surface. Thus, what appears as break-through activation from one field of view may actually be a result of a spiral wave anchored to the opposite side of the heart. In this study, the presence of a spiral wave was confirmed in nearly every case. Additionally, we discovered that the spiral wave was anchored to the infarct region in 84.2% of spiral waves recorded. This indicates that the heterogeneous tissue of the infarct and BZ provide the substrate for VT and perhaps act to stabilize meandering wavefronts and convert them to stable VT.
Based on our previous findings 18, 19 we tested the hypothesis that CVTs may vary as a function of the phase within the VT CL at which the shock is applied. A summary of shocks applied to one VT morphology is shown in Figure 8 in which dramatically different CVTs are observed at different phases of shock application. Similar grids were constructed for each VT morphology in which the grid was completed and the CVTs at the favorable versus unfavorable phases were compared and found to be 7.75 ± 1.89 V/cm versus 4.13 ± 1.55 V/cm (p = 0.005), respectively. This indicates that the shock strength may be reduced nearly 2-fold (or a 4-fold reduction in energy) with appropriately timed shocks. Detailed examples are presented in Figures 6 and 7 showing immediate termination of VT by a 3 V/cm shock applied at t = 238 ms (VT CL = 236 ms) and resetting of VT by a 3 V/cm shock applied at t = 114 ms. In most cases, the successful shock was applied when the reentrant wavefront was slowly propagating through the infarct BZ and the shock was able to excite the excitable gap leading to immediate termination of VT. The time in which reentrant wavefronts are propagating slowly through the infarct BZ may be a vulnerable time in the VT CL in which termination can be achieved with lower shock strengths.
Additionally, we tested the efficacy of ATP in terminating stable VT in this model and found that ATP terminated VT in only 1 of 34 trials (2.9%). This result is at first surprising as relatively high success rates for ATP have been reported in clinical studies.34, 35 However, when administered to a patient with an ICD, ATP is applied almost immediately upon sensing an arrhythmia. In our study, immediately after initiation, VT was in a meandering phase before stabilization and we only applied ATP after stabilization. Thus, VT may be more vulnerable to termination by ATP before it is stabilized. Additionally, only one electrode configuration (endocardial) was tested. Exploring additional electrode placements relative to the infarct location may increase ATP efficacy. This may be explored in future studies in which the efficacy of low-voltage cardioversion is directly compared to ATP.
In summary, we found that long lasting VT could not be induced in the rabbit model of chronic MI without flecainide administration. However, with flecainide, sustained stable VT was induced in every heart and was often maintained by a single spiral wave anchored to the infarct region. These findings are consistent with previous studies in the canine model of late infarction in which sustained VT also could not be induced without flecainide, but when induced, reentrant wavefronts were associated with the scar and BZ.20 However, the present study also explored mechanisms of termination of stable VT by direct excitation of the excitable gap or detachment of the rotor from the scar by appropriately-time shocks. Our results indicate that cardioversion shock strength may be significantly reduced with this method and that the time in which reentrant wavefronts are propagating through the infarct region may represent a vulnerable time in which low-voltage termination may be achieved. Further investigation of defibrillation in the rabbit model of chronic MI may lead to significant improvements for electrotherapy of VT in the post-infarction patient.
Study Limitations
Although the optical mapping set-up used in this study allowed for panoramic imaging of the entire epicardium, this technique cannot penetrate beyond sub-epicardial layers. Thus, activation from deeper tissue as well as septal activation which is important for clinically relevant induction of arrhythmia cannot be mapped with this system. In order to optically map as much of the ventricular epicardium as possible, a trade-off was made with regard to spatial resolution. Therefore, the fluorescent optical signals at each PDA location are a summary of approximately 1.7 × 1.7 mm2 of cardiac tissue and may also include scattered optical signals from adjacent tissue.
Issues of light scattering and depth of penetration of the optical mapping technique are especially important when considering signals from the infarct region. In this study, optical action potentials (although of smaller amplitude) were always recorded from the infarct region, regardless of the size and severity of the scar. It is impossible to determine the exact origin of these signals. They may represent activation through the surviving endocardial BZ in which the optical signals may pass through the thin, translucent scar tissue to the PDA, or they may be due to light scattering of surrounding viable tissue.
Finally, because of the 3D nature of the heart and the fact that a spiral wave may anchor at any place on the surface, the plane of the spiral wave relative to the applied electric field could not be controlled. Therefore, the exact phase within the VT CL at which shocks were applied is somewhat arbitrary and varies with spiral wave location and chirality. However, our objective in this study was to show a phase-dependence and not necessarily to predict or quantify the best phase for shock application.
Acknowledgments
Sources of Funding: This work was supported by NIH grant R01HL-067322.
Footnotes
Publisher's Disclaimer: This is a PDF file of an unedited manuscript that has been accepted for publication. As a service to our customers we are providing this early version of the manuscript. The manuscript will undergo copyediting, typesetting, and review of the resulting proof before it is published in its final citable form. Please note that during the production process errors may be discovered which could affect the content, and all legal disclaimers that apply to the journal pertain.
References
- 1.Callans DJ, Josephson ME, Zipes DP, et al. Cardiac Electrophysiology: from Cell to Bedside. Philadelphia, PA: Saunders; 2004. Ventricular tachycardia in patients with coronary artery disease; pp. 569–574. [Google Scholar]
- 2.Zheng ZJ, Croft JB, Giles WH, et al. Sudden cardiac death in the United States, 1989 to 1998. Circulation. 2001;104(18):2158–2163. doi: 10.1161/hc4301.098254. [DOI] [PubMed] [Google Scholar]
- 3.A comparison of antiarrhythmic-drug therapy with implantable defibrillators in patients resuscitated from near-fatal ventricular arrhythmias. The Antiarrhythmics versus Implantable Defibrillators (AVID) Investigators. N Engl J Med. 1997;337(22):1576–1583. doi: 10.1056/NEJM199711273372202. [DOI] [PubMed] [Google Scholar]
- 4.Buxton AE, Lee KL, Fisher JD, et al. A randomized study of the prevention of sudden death in patients with coronary artery disease. Multicenter Unsustained Tachycardia Trial Investigators. N Engl J Med. 1999;341(25):1882–1890. doi: 10.1056/NEJM199912163412503. [DOI] [PubMed] [Google Scholar]
- 5.Cabo C, Yao J, Boyden PA, et al. Heterogeneous gap junction remodeling in reentrant circuits in the epicardial border zone of the healing canine infarct. Cardiovasc Res. 2006;72(2):241–249. doi: 10.1016/j.cardiores.2006.07.005. [DOI] [PubMed] [Google Scholar]
- 6.Ciaccio EJ, Costeas C, Coromilas J, et al. Static relationship of cycle length to reentrant circuit geometry. Circulation. 2001;104(16):1946–1951. doi: 10.1161/hc4101.097117. [DOI] [PubMed] [Google Scholar]
- 7.Ohara T, Ohara K, Cao JM, et al. Increased wave break during ventricular fibrillation in the epicardial border zone of hearts with healed myocardial infarction. Circulation. 2001;103(10):1465–1472. doi: 10.1161/01.cir.103.10.1465. [DOI] [PubMed] [Google Scholar]
- 8.Janse MJ, Wit AL. Electrophysiological mechanisms of ventricular arrhythmias resulting from myocardial ischemia and infarction. Physiol Rev. 1989;69(4):1049–1169. doi: 10.1152/physrev.1989.69.4.1049. [DOI] [PubMed] [Google Scholar]
- 9.Peters NS, Coromilas J, Severs NJ, et al. Disturbed connexin43 gap junction distribution correlates with the location of reentrant circuits in the epicardial border zone of healing canine infarcts that cause ventricular tachycardia. Circulation. 1997;95(4):988–996. doi: 10.1161/01.cir.95.4.988. [DOI] [PubMed] [Google Scholar]
- 10.Li L, Nikolski V, Wallick DW, et al. Mechanisms of enhanced shock-induced arrhythmogenesis in the rabbit heart with healed myocardial infarction. Am J Physiol Heart Circ Physiol. 2005;289(3):H1054–H1068. doi: 10.1152/ajpheart.01253.2004. [DOI] [PubMed] [Google Scholar]
- 11.McLachlan CS, McGuire MA. Characterization and incidence of inducible monomorphic ventricular tachycardia in a postinfarction rabbit model. J Electrocardiol. 2007;40(1):89–93. doi: 10.1016/j.jelectrocard.2006.02.001. [DOI] [PubMed] [Google Scholar]
- 12.Jiang H, Lu Z, Yu Y, et al. Effects of metoprolol on sympathetic remodeling and electrical remodeling at infarcted border zone after myocardial infarction in rabbits. Cardiology. 2007;108(3):176–182. doi: 10.1159/000096647. [DOI] [PubMed] [Google Scholar]
- 13.Panfilov AV. Is heart size a factor in ventricular fibrillation? Or how close are rabbit and human hearts? Heart Rhythm. 2006;3(7):862–864. doi: 10.1016/j.hrthm.2005.12.022. [DOI] [PubMed] [Google Scholar]
- 14.Qu F, Ripplinger CM, Nikolski VP, et al. Three-dimensional panoramic imaging of cardiac arrhythmias in rabbit heart. J Biomed Opt. 2007;12(4):044019. doi: 10.1117/1.2753748. [DOI] [PubMed] [Google Scholar]
- 15.Kay MW, Amison PM, Rogers JM. Three-dimensional surface reconstruction and panoramic optical mapping of large hearts. IEEE Trans Biomed Eng. 2004;51(7):1219–1229. doi: 10.1109/TBME.2004.827261. [DOI] [PubMed] [Google Scholar]
- 16.Pumir A, Krinsky V. Unpinning of a rotating wave in cardiac muscle by an electric field. Journal of theoretical biology. 1999;199(3):311–319. doi: 10.1006/jtbi.1999.0957. [DOI] [PubMed] [Google Scholar]
- 17.Takagi S, Pumir A, Pazó D, et al. Unpinning and Removal of a Rotating Wave in Cardiac Muscle. Physical Review Letters. 2004 doi: 10.1103/PhysRevLett.93.058101. [DOI] [PubMed] [Google Scholar]
- 18.Ripplinger CM, Krinsky VI, Nikolski VP, et al. Mechanisms of unpinning and termination of ventricular tachycardia. Am J Physiol Heart Circ Physiol. 2006;291(1):H184–H192. doi: 10.1152/ajpheart.01300.2005. [DOI] [PubMed] [Google Scholar]
- 19.Fedorov VV, Schuessler RB, Lall S, et al. Low voltage defibrillation of sustained ventricular tachycardia in infarcted canine hearts. Heart Rhythm. 2007;4(5S):S171. [Google Scholar]
- 20.Coromilas J, Saltman AE, Waldecker B, et al. Electrophysiological effects of flecainide on anisotropic conduction and reentry in infarcted canine hearts. Circulation. 1995;91(8):2245–2263. doi: 10.1161/01.cir.91.8.2245. [DOI] [PubMed] [Google Scholar]
- 21.Efimov IR, Cheng YN, Biermann M, et al. Transmembrane voltage changes produced by real and virtual electrodes during monophasic defibrillation shock delivered by an implantable electrode. Journal of Cardiovascular Electrophysiology. 1997;8:1031–1045. doi: 10.1111/j.1540-8167.1997.tb00627.x. [DOI] [PubMed] [Google Scholar]
- 22.Fedorov VV, Lozinsky IT, Sosunov EA, et al. Application of blebbistatin as an excitation-contraction uncoupler for electrophysiologic study of rat and rabbit hearts. Heart Rhythm. 2007;4(5):619–626. doi: 10.1016/j.hrthm.2006.12.047. [DOI] [PubMed] [Google Scholar]
- 23.Bray MA, Lin SF, Wikswo J. Three-dimensional visualization of phase singularities on the isolated rabbit heart. J Cardiovasc Electrophysiol. 2002;13(12):1311. doi: 10.1046/j.1540-8167.2002.01311.x. [DOI] [PubMed] [Google Scholar]
- 24.Bayly PV, KenKnight BH, Rogers JM, et al. Estimation of conduction velocity vector fields from epicardial mapping data. IEEE Trans Biomed Eng. 1998;45(5):563–571. doi: 10.1109/10.668746. [DOI] [PubMed] [Google Scholar]
- 25.Hucker WJ, McCain ML, Laughner JI, et al. Connexin 43 Expression Delineates Two Discrete Pathways in the Human Atrioventricular Junction. Anat Rec (Hoboken) 2007;291(2):204–215. doi: 10.1002/ar.20631. [DOI] [PMC free article] [PubMed] [Google Scholar]
- 26.Fast VG, Rohr S, Gillis AM, et al. Activation of cardiac tissue by extracellular electrical shocks: formation of ‘secondary sources’ at intercellular clefts in monolayers of cultured myocytes. Circulation Research. 1998;82(3):375–385. doi: 10.1161/01.res.82.3.375. [DOI] [PubMed] [Google Scholar]
- 27.Trayanova N, Skouibine K, Aguel F. The role of cardiac tissue structure in defibrillation. Chaos. 1998;8(1):221–233. doi: 10.1063/1.166299. [DOI] [PubMed] [Google Scholar]
- 28.Cheng Y, Nikolski V, Efimov IR. Virtual electrode induced transmural and midmyocardial scroll-waves during internal defibrillation shocks. Circulation. 2000;102(18):340–341. [Google Scholar]
- 29.Ashihara T, Constantino J, Trayanova NA. Tunnel Propagation of Postshock Activations as a Hypothesis for Fibrillation Induction and Isoelectric Window. Circ Res. 2008 doi: 10.1161/CIRCRESAHA.107.168112. [DOI] [PMC free article] [PubMed] [Google Scholar]
- 30.Cheng Y, Li L, Nikolski V, et al. Shock-induced arrhythmogenesis is enhanced by 2,3-butanedione monoxime compared with cytochalasin D. American journal of physiology. 2004;286(1):H310–318. doi: 10.1152/ajpheart.00092.2003. [DOI] [PubMed] [Google Scholar]
- 31.Dhein S, Muller A, Gerwin R, et al. Comparative study on the proarrhythmic effects of some antiarrhythmic agents. Circulation. 1993;87(2):617–630. doi: 10.1161/01.cir.87.2.617. [DOI] [PubMed] [Google Scholar]
- 32.Ranger S, Nattel S. Determinants and mechanisms of flecainide-induced promotion of ventricular tachycardia in anesthetized dogs. Circulation. 1995;92(5):1300–1311. doi: 10.1161/01.cir.92.5.1300. [DOI] [PubMed] [Google Scholar]
- 33.Jalife J, Berenfeld O, Mansour M. Mother rotors and fibrillatory conduction: a mechanism of atrial fibrillation. Cardiovascular research. 2002;54(2):204–216. doi: 10.1016/s0008-6363(02)00223-7. [DOI] [PubMed] [Google Scholar]
- 34.Wathen MS, DeGroot PJ, Sweeney MO, et al. Prospective randomized multicenter trial of empirical antitachycardia pacing versus shocks for spontaneous rapid ventricular tachycardia in patients with implantable cardioverter-defibrillators: Pacing Fast Ventricular Tachycardia Reduces Shock Therapies (PainFREE Rx II) trial results. Circulation. 2004;110(17):2591–2596. doi: 10.1161/01.CIR.0000145610.64014.E4. [DOI] [PubMed] [Google Scholar]
- 35.Kouakam C, Lauwerier B, Klug D, et al. Effect of elevated heart rate preceding the onset of ventricular tachycardia on antitachycardia pacing effectiveness in patients with implantable cardioverter defibrillators. The American journal of cardiology. 2003;92(1):26–32. doi: 10.1016/s0002-9149(03)00459-4. [DOI] [PubMed] [Google Scholar]