Abstract
Because of its complexity, the atrioventricular node (AVN), remains 1 of the least understood regions of the heart. The aim of the study was to construct a detailed anatomic model of the AVN and relate it to AVN function. The electric activity of a rabbit AVN preparation was imaged using voltage-dependent dye. The preparation was then fixed and sectioned. Sixty-five sections at 60- to 340-μm intervals were stained for histology and immunolabeled for neurofilament (marker of nodal tissue) and connexin43 (gap junction protein). This revealed multiple structures within and around the AVN, including transitional tissue, inferior nodal extension, penetrating bundle, His bundle, atrial and ventricular muscle, central fibrous body, tendon of Todaro, and valves. A 3D anatomically detailed mathematical model (≈13 million element array) of the AVN and surrounding atrium and ventricle, incorporating all cell types, was constructed. Comparison of the model with electric activity recorded in experiments suggests that the inferior nodal extension forms the slow pathway, whereas the transitional tissue forms the fast pathway into the AVN. In addition, it suggests the pacemaker activity of the atrioventricular junction originates in the inferior nodal extension. Computer simulation of the propagation of the action potential through the anatomic model shows how, because of the complex structure of the AVN, reentry (slow-fast and fast-slow) can occur. In summary, a mathematical model of the anatomy of the AVN has been generated that allows AVN conduction to be explored.
Keywords: atrioventricular node, slow pathway, fast pathway, reentry, modeling
The AVN lies within the triangle of Koch bounded by the coronary sinus, tendon of Todaro, and tricuspid valve (Figure 1A). The function of the AVN is to conduct action potentials at an appropriate conduction velocity from the atria to the ventricles. Functionally, the AVN is complex. For example, the AVN shows dual pathway conduction: the slow pathway into the AVN runs from the isthmus (between coronary sinus and tricuspid valve) to the apex of the triangle of Koch, whereas the fast pathway is more cranial (Figure 1B). The AVN is a subsidiary pacemaker, and the leading pacemaker site has been reported to be within the slow pathway.1 AVN reentrant tachycardia is the most common paroxysmal supraventricular tachycardia (except atrial fibrillation) in adults2; prevention involves ablation of the isthmus.2 The AVN, perhaps more than any other tissue in the heart, owes its complexity of function to its complexity of structure (ie, anatomy). To understand the structure-function relationships of the AVN, the aim of the present study was to generate an anatomic model of the AVN and relate it to function. For research and teaching, there is an effort to build a “virtual heart.”3 This requires anatomic models in the form of mathematical arrays or finite element models for each part of the heart. Such models exist for the atria, ventricles, and sinoatrial node (SAN).3,4 Here is the first such anatomic model (mathematical array) of the AVN. The study was carried out on the rabbit, because the rabbit AVN preparation is amenable to experimentation and is widely used, and anatomic models already exist for the SAN, atria, and ventricles of rabbit.3
Figure 1.
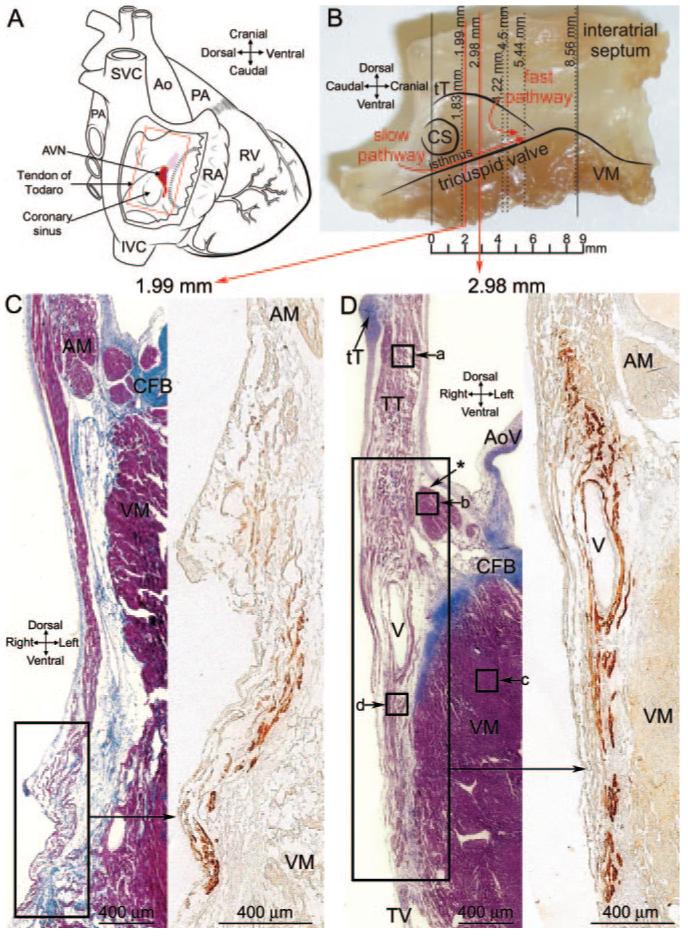
A, Diagram of a heart with a window cut into the right atrium to show location of AVN. B, Photograph of an AVN preparation used to construct the model and location of sections shown. C, Masson’s trichrome-stained section toward the start of INE (left) and the adjacent neurofilament-labeled section (right; corresponding to region shown). D, Masson’s trichrome-stained section near middle of INE (left) and the adjacent neurofilament-labeled section (right; corresponding to region shown). Boxes a through d show location of images in Figure 2A through 2D. AM indicates atrial muscle; Ao, aorta; AoV, aortic valve; CFB, central fibrous body; CS, coronary sinus; CT, crista terminalis; IVC, inferior vena cava; LA, left atrium; LV, left ventricle; MV, mitral valve; PA, pulmonary artery; PV, pulmonary vein; RA, right atrium; RV, right ventricle; SVC, superior vena cava; tT, tendon of Todaro; TT, transitional tissue; TV, tricuspid valve; VM, ventricular muscle.
Materials and Methods
The heart was removed from New Zealand White rabbits, and the region of the AVN (boxed region in Figure 1A) was dissected. All of the work described here was carried out on the AVN preparation shown in Figure 1B. The preparation was stained with the voltage-sensitive dye di-4-ANEPPS [3-(4-(2-(6-(dibutylamino)-2-naphthyl)-trans-ethenyl)pyridinium)propanesulfonate], and electric activity was recorded, as previously described,5 during AVN pacemaking and reentry. Following recording, the preparation was fixed, paraffin-embedded, and sectioned in the plane shown by the vertical lines in Figure 1B (ie, in dorsal-ventral plane, roughly perpendicular to septal leaflet of tricuspid valve). Sections at 65 levels at 60- to 340-μm intervals were stained with Masson’s trichrome to show histology. Sections adjacent to these were labeled using immunoenzyme for middle (160/165-kDa) neurofilament and connexin (Cx)43 to identify different cell groups. Neurofilament was used as a marker for conduction system tissue; neurofilament is a neuronal cytoskeletal protein that in the rabbit is exclusively expressed in the atrial and ventricular conduction system (it is not expressed in the working myocardium) and has previously been used as a marker of rabbit SAN and AVN myocytes, as well as ventricular conduction system.1,4 Connexins are responsible for electric coupling between heart cells, and Cx43 is the most abundantly expressed connexin isoform in the heart. Here, sections from just 5 levels (inferior nodal extension [INE] [start, middle, end]; penetrating bundle; and His bundle) are shown to illustrate the major features, but sections from all 65 levels were used to construct a 3D computer model (mathematical array) of the anatomy of the AVN. Firstly, the sections were outlined, divided into different cell types, and aligned based on the positions of the tract of nodal tissue and tendon of Todaro. Secondly, based on the interval between sections, a common coordinate system was used to define all sections. Thirdly, the vertical position of sections was adjusted so that the bottom edge of the model mapped onto the bottom edge of the original preparation. Finally, the voxel size of the array was adjusted to be 10×20×50 μm. Propagation of the action potential through the anatomic model was calculated using the cellular automaton or monodomain models. Although it was only feasible to generate an anatomic model for 1 preparation, we have confirmed the electrophysiological findings previously,1,5,6 and the anatomic findings were confirmed in more than 7 preparations. For further details of the methods used, see the online data supplement, available at http://circres.ahajournals.org.
Results
At the atrioventricular junction, the tract of neurofilament-expressing nodal tissue is divided into 2: the INE and the penetrating bundle. The INE is located in the right atrium and is continuous with the penetrating bundle. The penetrating bundle penetrates the fibrous tissue separating the atria and ventricles; it emerges in the ventricles as the bundle of His.
Inferior Nodal Extension
Figure 1C shows a Masson’s trichrome-stained section toward the start of the INE (close to coronary sinus and distal to penetrating bundle), and Figure 1D shows a section near the middle of the INE. The position of the sections is given in millimeters and is shown in Figure 1B. In Figure 1C and 1D, the myocytes are stained purple, and connective tissue is stained blue. The atrial and ventricular tissues are separated by fibrous tissue (stained blue; Figure 1C and 1D). Other landmarks such as the tendon of Todaro can be seen (Figure 1D). Neurofilament labeling of the boxed regions in Figure 1C and 1D is also shown. The nodal tissue of the INE can be recognized because it expresses neurofilament (brown label), whereas the surrounding tissue does not (Figure 1C and 1D, right images). At the middle of the INE (Figure 1D), there is a vein that divides the myocytes of the INE (confirmed in more than 7 hearts). The nodal tissue lying above the vein appears to be continuous with atrial tissue, but the nodal tissue lying below may be isolated by the vein. (Of course, it is also isolated from ventricular muscle by fibrous tissue.) In contrast, toward the start of the INE, the vein is not present and the nodal and atrial tissues appear to be in direct contact (Figure 1C).
Figure 2A through 2D shows high magnification images of the Masson’s trichrome-stained section (left) as well as Cx43 labeling (right) in the boxed regions (labeled a through d) in Figure 1D. The myocytes of the INE are small and dispersed among connective tissue and do not express Cx43 (Figure 2D). The ventricular myocytes lying below the INE are large and densely packed (separated by relatively little connective tissue) and do express Cx43 (Figure 2C). At the middle of the INE, on the side of the aorta, there is a bundle of densely packed atrial muscle (Figure 1D, asterisk); atrial myocytes, like ventricular myocytes, are large and densely packed (separated by relatively little connective tissue), and express Cx43 (Figure 2B). However, at the middle of the INE, the majority of the tissue lying above the INE is loosely packed (Figure 1D). Here, we refer to this as “transitional tissue” because, although it does not express neurofilament (Figure 1D) and it does express Cx43 (Figure 2A) like atrial muscle, the myocytes are small and dispersed among connective tissue like nodal myocytes. Interestingly, above the start of the INE, there is no transitional tissue, only atrial muscle (Figure 1C). Figure 2I shows the diameter of the different myocyte types: myocyte diameter is significantly greater for the atrial and ventricular muscle; myocyte diameter is not significantly different between the transitional tissue and INE.
Figure 2.
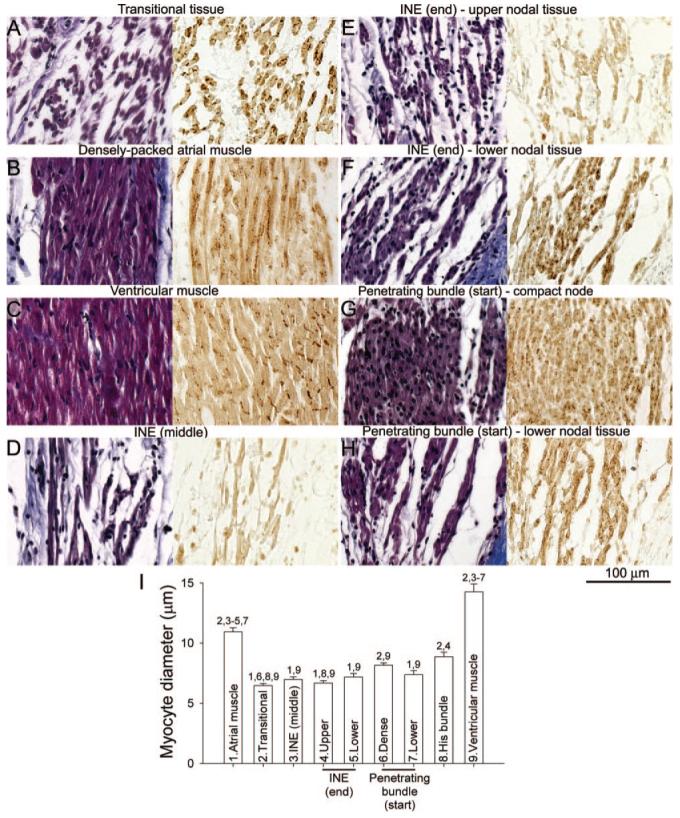
High-magnification images of different myocyte types at atrioventricular conduction axis. A through H, transitional tissue (A), atrial muscle (B), ventricular muscle (C), middle of INE (D), upper nodal tissue of end of INE (E), lower nodal tissue of end of the INE (F), compact node at the start of the penetrating bundle (G), and lower nodal tissue at the start of the penetrating bundle (H). Sections stained with Masson’s trichrome are shown on the left, and adjacent Cx43-labeled sections are shown on the right. A through D were taken from regions a through d in Figure 1D; E and F are from regions e and f in Figure 3A; and G and H are from regions g and h in Figure 3B. I, Mean(+SEM; n=15) diameter of different myocyte types. Numbers 1 to 9 are significantly different (P<0.05; 1-way ANOVA) from the appropriately numbered region.
Figure 3A shows a Masson’s trichrome-stained section at the end of the INE (next to penetrating bundle). The group of nodal myocytes can be identified by the neurofilament labeling (Figure 3A). There appears to be continuity between the nodal tissue and the transitional tissue abutting the INE at this level (Figure 3A). At this level, once again, there is an isolated bundle of densely packed atrial muscle on the side of the aorta (Figure 3A, asterisk). The myocytes at the end of the INE can be divided into 2: upper and lower groups. Highmagnification images of the Masson’s trichrome-stained section as well as Cx43 labeling in the boxed regions (corresponding to upper and lower nodal myocytes) in Figure 3A are shown in Figure 2E and 2F. The upper nodal myocytes are small, dispersed, and Cx43-negative (Figure 2E and 2I), whereas the lower nodal myocytes, although still small and dispersed, are Cx43-positive (Figure 2F and 2I).
Figure 3.
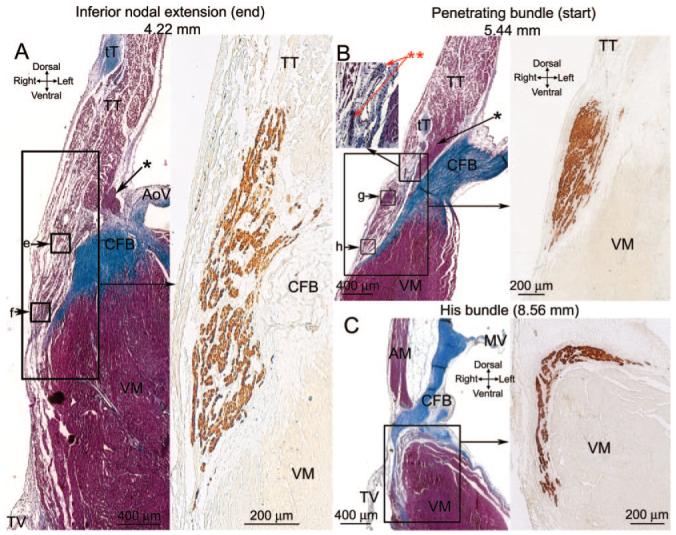
A through C, Sections at the end of the INE (A), start of the penetrating bundle (B), and start of the His bundle (C). Masson’s trichrome-stained sections are shown on the left, and an adjacent neurofilament-labeled section is shown on the right (corresponding to regions shown). Boxes e through h show the location of images in Figure 2E through 2H.
Penetrating Bundle
Figure 3B shows a Masson’s trichrome-stained section at the start of the penetrating bundle. The nodal tissue (identified by neurofilament labeling; Figure 3B) is separated from transitional tissue above (as well as ventricular muscle below) by connective tissue: the nodal tissue is, therefore, enclosed. At this level, once again, there is an isolated bundle of densely packed atrial muscle on the side of the aorta (Figure 3B, asterisk). High-magnification images of the Masson’s trichrome-stained section, as well as Cx43 labeling in the boxed regions in Figure 3B, are shown in Figure 2G and 2H. Figure 2G shows images of the upper part of the penetrating bundle: the nodal myocytes are small (Figure 2I) and densely packed and show weak and punctuate Cx43 labeling. We refer to this region as the “compact node.” Figure 2H shows images of the lower part of the penetrating bundle: the lower nodal myocytes are small (Figure 2I) and dispersed among connective tissue and show stronger Cx43 labeling; they are continuous, with the lower nodal myocytes at the end of the INE discussed above.
His Bundle
Figure 3C shows a Masson’s trichrome-stained section at the level of the His bundle at the point where it divides to form the left and right bundle branches. The nodal tissue (identified by neurofilament labeling) is separated from the atrial muscle above by the central fibrous body and from the ventricular muscle below by connective tissue (Figure 3C). Therefore, at this point, the tract of nodal tissue has emerged into the ventricles. The myocytes of the His bundle are small (Figure 2I), neurofilament-positive, and Cx43-positive (data not shown).
Nervous Innervation
Prominent nerve trunks were observed at the AVN. The inset in Figure 3B (**) shows 2 nerve trunks located next to a vein near the penetrating bundle. Within the nerve trunks, there is an abundance of nuclei (presumably belonging to supporting Schwann cells; Figure 3B). Another example is shown in the online data supplement.
Model of the AVN
In summary, at the atrioventricular junction, there is neurofilament-positive nodal tissue (loosely or densely packed and Cx43-negative or -positive), neurofilament-negative transitional tissue (loosely packed, Cx43-positive), and neurofilament-negative atrial and ventricular muscle (densely packed, Cx43-positive). Figure 4 summarizes the distribution of different cell types at all 65 levels studied: only the tract of nodal tissue and the nearby tissue is shown. Cx43-negative nodal tissue of the INE (red), compact node (bright yellow), Cx43-positive tissue of the penetrating bundle (purple), atrial muscle (peach), transitional tissue (green), ventricular muscle (pink), tendon of Todaro (dark blue), aortic valve (violet), connective tissue (light blue), and fatty tissue (light yellow) are shown in Figure 4. Additional views of the sections are shown in the online data supplement. The sections in Figure 4 were used to generate a 3D anatomic model of the AVN. The model is a mathematical array with ≈13 million elements and is available in the online data supplement (supplemental File 1). Various views of the isosurface model are shown in Figure 5 (the model as viewed from the right atrium/ventricle is shown at the top; and as viewed from the left atrium/ventricle/aorta, at the bottom). The model is either shown with all cell types (Figure 5A and 5B) or with some cell types removed (Figure 5C through 5F). Figure 5A shows that the INE is located between the coronary sinus and the tricuspid valve, the end of the INE is covered by transitional tissue, the penetrating bundle begins at the apex of the triangle of Koch (formed by coronary sinus, tendon of Todaro and tricuspid valve), and the penetrating bundle and His bundle are covered by connective tissue (“sheath” in Figure 5A). Figure 5C and 5D shows the model after removal of the transitional tissue and connective tissue. The boundary of the 3 types of nodal tissue (red, yellow, and purple) can be seen; note the tract of Cx43-positive lower nodal tissue (purple) projecting into the INE. The compact node (which weakly expresses Cx43; yellow) is located at the junction where the Cx43-negative nodal tissue (red) meets the Cx43-positive nodal tissue (purple). Figure 5D shows a prominent bundle of densely packed atrial muscle running along the nodal tissue (the bundle has been highlighted). This muscle bundle is the bundle discussed in Figures 1D and 3A and 3B (asterisk). Figure 5E and 5F shows the nerve trunks (in white). One nerve trunk runs from the His bundle, past the penetrating bundle (as shown in Figure 3B) and along the tendon of Todaro. Another nerve trunk is next to the INE. The course of the vein first highlighted in Figure 1D is shown in Figure 5E and 5F (green). Movie 1 in the online data supplement is an animation of the model.
Figure 4.
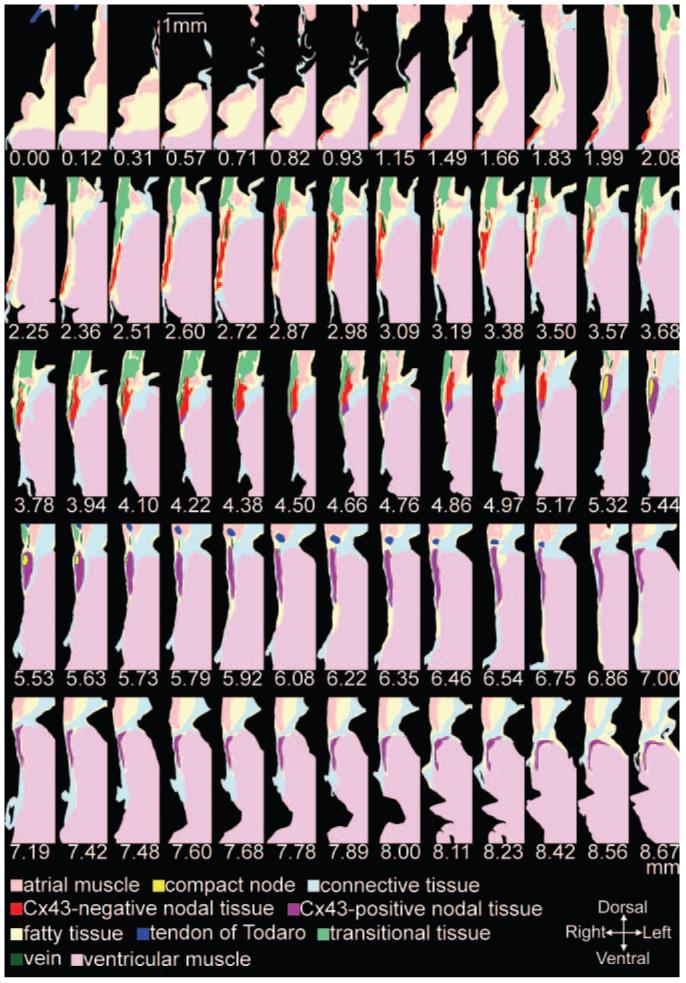
Sixty-five model sections. Distances in millimeters are shown (see Figure 1B).
Figure 5.
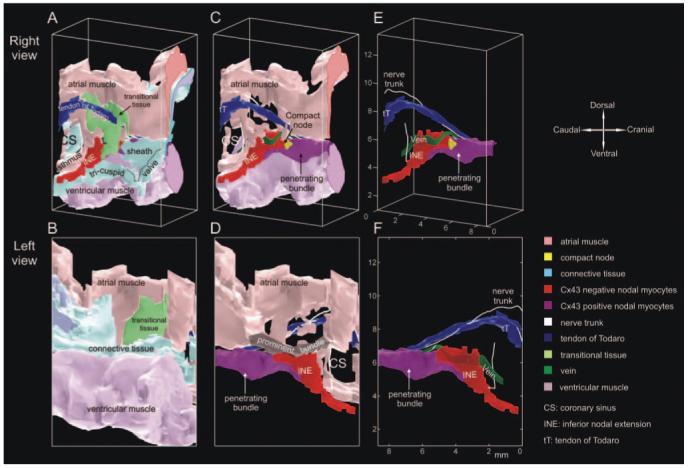
Views of an anatomic model of AVN. Top, Model viewed from right atrium/ventricle. Bottom, Model viewed from left atrium/ventricle/aorta. A and B, All cell types. C and D, Model after removal of transitional and connective tissues. E and F, Model after removal of all atrial and ventricular muscle and connective tissue.
Fiber Orientation
Myocyte orientation was identified from the cross-sectional view of myocytes in the Masson’s trichrome-stained sections. Figure 6 shows myocyte orientation throughout a section (at level of line in Figure 6B and 6C) and on the surfaces of the AVN preparation. Whereas myocytes generally run horizontally in the upper atrial muscle, in the lower atrial muscle, transitional tissue, and nodal tracts, they generally run vertically.
Figure 6.
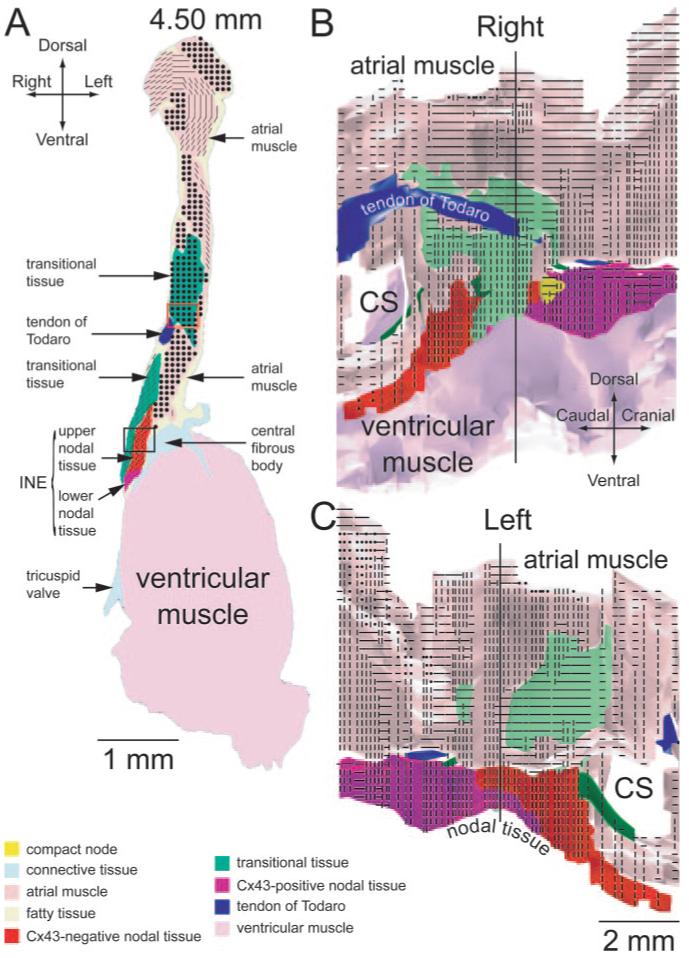
Myocyte orientation at atrioventricular junction axis. A, Myocyte orientation in single section (from level of the vertical line in B and C). B and C, Myocyte orientation on surfaces of AVN preparation viewed from the right (B) or left (C) side of heart. Black circles indicate transversely cut myocytes; lines, longitudinally cut myocytes.
Correlation of Structure and Function: Activation Sequence of AVN
In the absence of stimulation, the AVN shows pacemaking.1 In the same preparation as used to construct the model, di-4-ANEPPS was used to map the spread of the action potential during spontaneous activity; this is shown as a color contour map in Figure 7A. The map has been superimposed on the anatomic model. This shows that the action potential was first initiated at the end of the INE at the junction of the upper and lower nodal tissues. From here, the action potential spread in both directions along the tract of nodal tissue. Later, the action potential propagated into the atrial tissue, but this is not shown. This is the same behavior as we have reported previously.1
Figure 7.
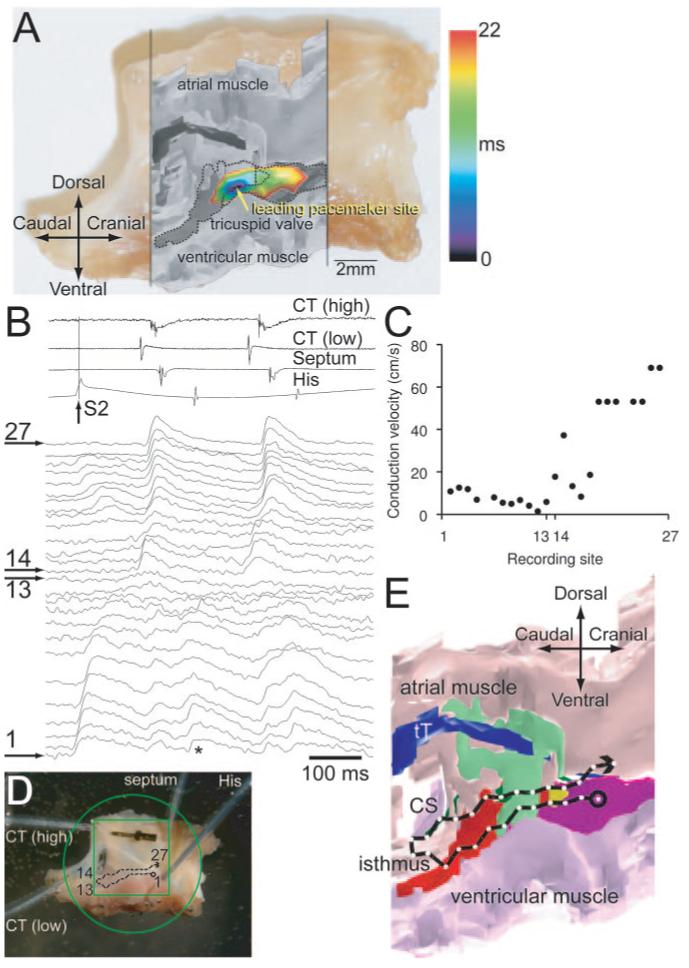
Structure-function relationships of AVN. A, Activation sequence of AVN during pacemaking. The activation map is shown as a color contour map and is superimposed on a grayscale image of model, which, in turn, is superimposed on a photograph of the preparation. B through E, Reentry. B, Extracellular potential recordings from high and low crista terminalis, interatrial septum and His bundle (top), and optical action potentials recorded from sites 1 to 27 shown in D (bottom). S1 and S2 stimuli were applied (S1-S2 interval, 160 ms); only the response to S2 stimulus is shown. C, Conduction velocity along conduction pathway 1 to 27 (calculated from recordings in response to S2 stimulus). D, Position of recording sites 1 to 27 superimposed on a photograph of the preparation. E, Conduction pathway 1 to 27 superimposed on an anatomic model.
Again, in the same preparation as used to construct the model, the spread of the action potential during reentry was mapped. The preparation was stimulated at the His bundle; 2 stimuli (S1 and S2) were delivered. The action potential in response to the S1 stimulus exited into the atrial muscle via the fast pathway (data not shown). Figure 7B shows the response to the S2 stimulus; resultant action potentials recorded at 27 sites are shown; the position of the recording sites is shown in Figure 7D. The action potential propagated from the apex of the triangle of Koch to the isthmus between the coronary sinus and the tricuspid valve (sites 1 to 13; Figure 7B and 7D). The conduction velocity from sites 1 to 13 was low (2 to 13 cm/sec; Figure 7C): conduction was occurring along the slow pathway (the fast pathway was refractory because the S1-S2 interval was shorter than the refractory period of the fast pathway). At site 13, the action potential broke out into the atrial muscle. For comparison, Figure 7B shows atrial action potentials on a path parallel to the slow pathway (sites 14 to 27). Figure 7C shows that action potential conduction through the atrial muscle was faster (up to 69 cm/sec). Following excitation of the atrial muscle, there must have been anterograde conduction along the fast pathway (which was no longer refractory), resulting in a reentry beat (Figure 7B, asterisk), which propagated along the slow pathway and out into the atrial muscle once more. Extracellular bipolar electrodes were used to record potentials from the high and low crista terminalis, interatrial septum, and His bundle, and the signals are shown at the top of Figure 7B (the recordings confirm that following the S2 stimulus, there were at least 2 action potentials: the action potential elicited by S2 stimulus and at least 1 reentry action potential). This is the same behavior as we have observed previously in 50% of preparations studied.6 The conduction pathway, followed by the action potential during reentry, is shown superimposed on the model of the AVN in Figure 7E; this suggests that the action potential first propagated along the INE (red) and then broke out into the atrial muscle at the isthmus. We know that there is possible contact between the atrial and nodal myocytes at this point (Figure 1C). Why did the action potential not break out earlier? As shown in Figures 1D and 5E, the prominent vein runs along this length of tissue and may electrically isolate the myocytes of the INE from transitional tissue/atrial muscle. The reentry shown in Figure 7B through 7E is known as fast-slow.
Correlation of Structure and Function: Simulation of Normal Conduction and Reentry
In the introduction of this report, we stated that the AVN owes its complexity of function to its complexity of structure. According to this hypothesis, it should be possible for the anatomic model to explain the complexity of function. To test this hypothesis, the anatomic model was used to calculate the activation sequence of the AVN. Action potential conduction was calculated using 2 different models. First, it was calculated using the simple cellular automaton model; although simple, the model is ideal for investigating the connectivity between the different tissues in the anatomic model. Secondly, results were confirmed using the monodomain model (including biophysically detailed models of the action potential). The anatomic model included a simplified version of myocyte orientation. Conduction was assumed to be faster parallel to the long axis of the myocyte than perpendicular to it: the anisotropic ratio was assumed to be 3:1. Conduction was also assumed to vary in the different tissues: for example, with the cellular automaton model, “coupling” in the atrial muscle/transitional tissue, INE, and penetrating bundle was assumed to be in the ratio 1:0.14:0.57. Further details of the simulations can be found in the online data supplement.
During spontaneous activity, the calculated activation sequence of the AVN (calculated using the cellular automaton or monodomain models) was similar to that seen in experiments (data not shown). The activation sequence of the AVN during normal anterograde conduction was similar regardless of whether it was calculated using the cellular automaton or monodomain models; Figure 8A shows the activation sequence as calculated using the monodomain model. The blue lines are isochrones at 5-ms intervals. The atrial muscle was stimulated at the crista terminalis (top left). The action potential propagated through the atrial tissue at ≈28 cm/sec (monodomain model) or ≈46 cm/sec (cellular automaton model) (see the online data supplement for details), similar to that demonstrated in experiments (35±17 cm/sec5). With both models, the action potential first entered the tract of nodal tissue at 2 points. The first point was at the end of the INE (next to the penetrating bundle) via the transitional tissue (green); we know that there is possible contact between the transitional and nodal tissues at this point (Figure 3A); this conduction pathway may correspond to the fast pathway route observed in experiments. Secondly, the action potential entered toward the start of the INE; this is the exit point identified during retrograde conduction (Figure 7E), and we know that there is possible contact between atrial muscle and nodal tissue at this point (Figure 1C); this conduction pathway may correspond to the slow pathway route observed in experiments. The action potential did not enter the tract of nodal tissue at other points because in the model, the nodal and atrial tissues are assumed to be isolated from each other by the prominent vein along this length of tissue (Figures 1D and 5E). The action potential propagated along the tract of nodal tissue at ≈7 cm/sec (monodomain model) or 3 cm/sec (cellular automaton model) (see the online data supplement for details), similar to in experiments (2 to 10 cm/sec7). From the 2 entry points, the action potential propagated both anterogradely and retrogradely along the INE; the action potentials met and annihilated each other (Figure 8A). The action potential reached the His bundle in ≈80 to 85 ms with both models, and this is comparable to the conduction time in experiments (≈96 ms8). The activation sequence is available as a movie (supplemental Movie 2). The right side of Figure 8A shows that, with the monodomain model, the calculated intracellular action potential waveforms 1 to 5 along the conduction pathway are similar to those recorded experimentally.8
Figure 8.
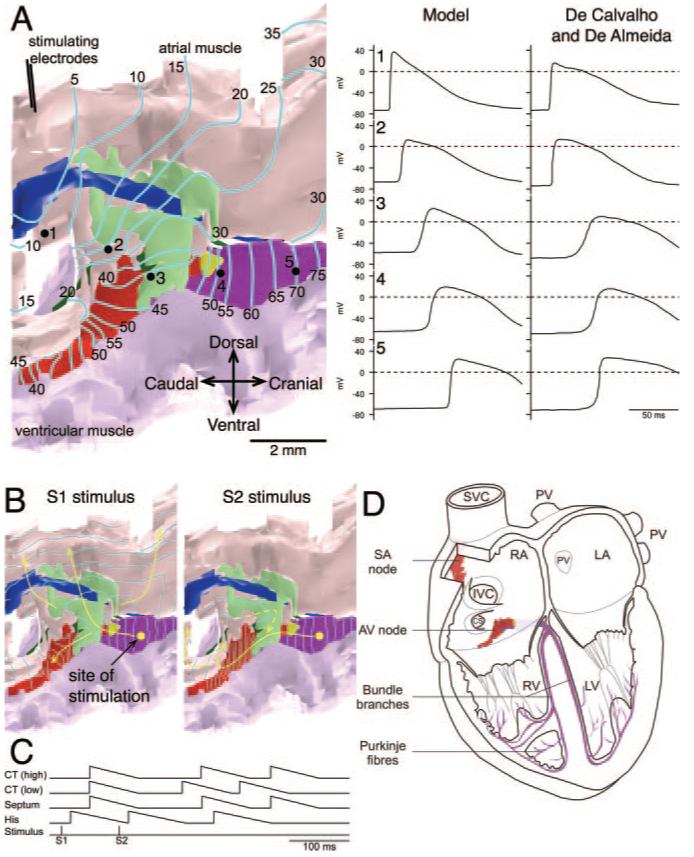
Structure-function relationships of AVN. A, Anterograde conduction as calculated using a monodomain model. Preparation (shown on the left) was stimulated at crista terminalis. The activation sequence is shown as isochrones at 5-ms intervals. Arrows highlight conduction pathway. Calculated intracellular action potentials recorded at sites 1 to 5 (see preparation) and comparable intracellular action potentials recorded experimentally8 are shown on the right. B, Fast-slow reentry as calculated using the cellular automaton model. Preparation was stimulated at the His bundle (yellow spot) using a S1-S2 protocol (S1-S2 interval, 96 ms). The activation sequence (shown as isochrones at 5 ms intervals) in response to S1 and S2 stimuli is shown. Arrows highlight the conduction pathway. C, Timing of stimuli and action potentials (at high and low crista terminalis, interatrial septum, and His bundle) during S1-S2 stimulation (from simulation in B). D, Anatomic models of AVN (nodal tissue only) and SAN4 (central SAN tissue only) superimposed on a 4-chamber view of the heart.
It was possible to simulate fast-slow reentry (Figure 7B through 7E) using the anatomic model of the AVN (cellular automaton model used). For reentry to occur, it is necessary that the INE (putative slow pathway) is electrically isolated from atrial tissue except at its 2 ends; as discussed above, this is the case in the model. In addition, it is necessary to produce unidirectional block: from experiments on the rabbit AVN, it is known that the refractory period of the fast pathway is longer than that of both the atrial muscle and slow pathway, and this property was introduced into the cellular automaton model (see the online data supplement for details). A simulation is shown in Figure 8B. The anatomic model was stimulated at the His bundle as in the experiment in Figure 7B through 7E; 2 stimuli (S1 and S2) were delivered. The S1 action potential exited into the atrial muscle via the transitional tissue (green), the putative fast pathway (Figure 8B). However, the premature S2 action potential failed to exit via the transitional tissue, because the S1-S2 interval was shorter than the refractory period of the transitional tissue. Instead, the S2 action potential exited into the atrial muscle via the INE (red; putative slow pathway) (Figure 8B) because the refractory period of the INE is shorter. The action potential then propagated anterogradely along the fast pathway (transitional tissue was no longer refractory) back into the tract of nodal tissue (Figure 8B). This resulted in reentry (Figure 8B and supplemental Movie 3). As shown in Figure 8C, in the model, the timing of the action potentials at different points on the reentry circuit is similar to that seen in experiments (Figure 7B, top).
There are 3 types of AVN reentry: slow-fast and intranodal, as well as fast-slow.5 Slow-fast reentry is clinically known as the “common type,”5 and using the anatomic model, it was also possible to simulate slow-fast reentry (see the online data supplement). In the model, as in the clinic, ablation of the isthmus abolished reentry, as dramatically shown by supplemental Movie 4.
Discussion
For the first time, based on histology and immunolabeling of marker proteins including neurofilament, which clearly and unambiguously identifies nodal tissue,1,4 we have generated a 3D anatomic model of the AVN, including 10 tissue types, as a mathematical array. Comparison of the model with electric activity measured in the same preparation shows the role of the different components of the AVN; for example, it demonstrates the importance of the INE in pacemaking, as well as atrioventricular nodal reentry. Furthermore, the anatomic model (together with simple or biophysically detailed models of action potential propagation) can be used to simulate the activation sequence of the AVN during normal anterograde conduction through the AVN, atrioventricular junctional pacemaking, and slow-fast and fast-slow atrioventricular nodal reentry.
To show the relationship between the model and other structures, Figure 8D shows the model of the AVN, together with our model of the SAN,4 superimposed on a 4-chamber view of the heart (see also Figure 1A). The general anatomic features of the rabbit AVN described here are similar to those reported by other investigators, although different investigators may use different terminology for the various structures.9,10
Nature of Slow Pathway: Entry and Exit Points
Electrophysiologically, 2 pathways (slow and fast) have been described from the atrial muscle into the penetrating bundle (Figure 1B). Figure 7B through 7E shows retrograde conduction during reentry in the preparation used to construct the model: the action potential propagated retrogradely along the slow pathway and exited into the atrial muscle (fast pathway was refractory). Figure 7B through 7E demonstrates that the INE may correspond to the slow pathway. The absence of Cx43 from much of the INE (Figure 2D) can help explain the slowness of conduction. In the rabbit, we have recently reported that the INE also does not express the cardiac Na+ channel, Nav1.5 (unlike nearby atrial and ventricular muscle)11; this explains the slow upstroke of the action potential at the INE in the rabbit (<≈12 V/sec)10 and can also help explain the slowness of conduction. The INE also expresses a different L-type Ca2+ channel isoform, Cav1.3, as compared with the atrial and ventricular muscle (which expresses Cav1.2).11
If the INE is indeed the slow pathway, it must have entry and exit sites for the action potential. Retrograde conduction during reentry was visualized in the preparation used to construct the model, and during this, the action potential propagated retrogradely along the slow pathway and exited into the atrial muscle (Figure 7D and 7E). The action potential appeared to exit from the slow pathway (presumably the INE) at the isthmus (as also observed by Nikolski and Efimov6), and Figure 1C shows that at this site there is a possible connection between the INE and the atrial muscle. Of course, the INE is also continuous with the penetrating bundle (as shown in Figure 5C).
Site of Pacemaking
This study showed that during pacemaking at the AVN, the action potential is first initiated in the INE (Figure 7A). This is consistent with our earlier report.1 This is the logical site for pacemaking to occur; we have recently shown that mRNA for HCN4, the major isoform responsible for the pacemaker current If, is more abundant in the INE than in other tissues (eg, penetrating bundle).11 HCN4 protein is also highly abundant in the INE.1 The INE also shares many other features in common with the SAN (eg, absence of Cx43 and Nav1.5, as well as the expression of Cav1.3).11,12
Nature of Fast Pathway
Electrophysiologically, the fast pathway is believed to be made of transitional atrio-nodal cells.9 The fast pathway is cranial: via this pathway, the action potential enters the INE immediately before the penetrating bundle (Figure 1B). Figures 3A and 5 show that, at this point, the nodal tissue makes contact with transitional tissue, and, therefore, the transitional tissue could constitute the fast pathway. Therefore, tissue that is transitional anatomically may be transitional electrophysiologically. Anatomically, the tissue is transitional, because it is similar to atrial muscle in terms of neurofilament and Cx43 expression but is similar to nodal tissue in terms of myocyte diameter and packing. Recently, we have obtained some evidence of reduced Nav1.5 and KChIP2 expression in this tissue, and, perhaps, this could help explain the unique electrophysiological characteristics of the atrio-nodal cells making up the fast pathway.11
Reentry
The slow pathway is known to be involved in AVN reentry. If the INE is the slow pathway (and for it to be involved in reentry), apart from its entry and exit points, it should be electrically isolated from the surrounding tissue. Of course, it is possible that the electric isolation is functional. However, in the present study, evidence was obtained of a possible structural basis for the isolation of the INE: between the entry and exit points, there appears to be little connection between the nodal tissue and surrounding transitional tissue/atrial muscle; the nodal tissue is isolated by connective and adipose tissue and most importantly by a vein (Figures 1D and 5E). Using the anatomic model, if we assumed that, between the entry and exit points, there is little connection between the nodal and transitional tissue/atrial muscle, we were able to simulate reentry (Figure 8B). Clinically, reentry is stopped by ablation of the isthmus2; Figure 8B shows why and supplemental Movie 4 confirms this.
At the end of the INE, Figure 5C shows parallel Cx43-negative and Cx43-positive tracts of nodal tissue (overlapping red and purple regions). Could these be responsible for intranodal reentry? Running alongside the INE, there is a prominent compact bundle of atrial muscle (evident in both Figures 1D, asterisk, and 3A and 3B, asterisk). This bundle has been highlighted in Figure 5D. The atrial myocytes in this bundle generally run longitudinally along the bundle. Could this prominent bundle (not previously identified) play an important role in reentry?
Supplementary Material
Acknowledgments
Sources of Funding
This work was supported by the British Heart Foundation.
Footnotes
Disclosures
None.
References
- 1.Dobrzynski H, Nikolski VP, Sambelashvili AT, Greener ID, Boyett MR, Efimov IR. Site of origin and molecular substrate of atrioventricular junctional rhythm in the rabbit heart. Circ Res. 2003;93:1102–1110. doi: 10.1161/01.RES.0000101913.95604.B9. [DOI] [PubMed] [Google Scholar]
- 2.Haissaguerre M, Shah DC, Jais P, Takahashi A, Hocini M, Garrigue SX, Clementy J. Slow and fast pathway ablation in AV nodal reentrant tachycardia. In: Mazgalev TN, Tchou PJ, editors. Atrial-AV Nodal Electrophysiology: A View From the Millennium. Futura Publishing Company; Armonk, New York: 2000. pp. 385–402. [Google Scholar]
- 3.Boyett MR, Li J, Inada S, Dobrzynski H, Schneider JE, Holden AV, Zhang H. Imaging the heart: computer 3-dimensional anatomic models of the heart. J Electrocardiol. 2005;38:113–120. doi: 10.1016/j.jelectrocard.2005.06.102. [DOI] [PubMed] [Google Scholar]
- 4.Dobrzynski H, Li J, Tellez J, Greener ID, Nikolski VP, Wright SE, Parson SH, Jones SA, Lancaster MK, Yamamoto M, Honjo H, Takagishi Y, Kodama I, Efimov IR, Billeter R, Boyett MR. Computer three-dimensional reconstruction of the sinoatrial node. Circulation. 2005;111:846–854. doi: 10.1161/01.CIR.0000152100.04087.DB. [DOI] [PubMed] [Google Scholar]
- 5.Nikolski VP, Jones SA, Lancaster MK, Boyett MR, Efimov IR. Cx43 and dual-pathway electrophysiology of the atrioventricular node and atrioventricular nodal reentry. Circ Res. 2003;92:469–475. doi: 10.1161/01.RES.0000059304.97120.2F. [DOI] [PubMed] [Google Scholar]
- 6.Nikolski V, Efimov I. Fluorescent imaging of a dual-pathway atrioventricular-nodal conduction system. Circ Res. 2001;88:e23–e30. doi: 10.1161/01.res.88.3.e23. [DOI] [PubMed] [Google Scholar]
- 7.Efimov IR, Nikolski VP, Rothenberg F, Greener ID, Li J, Dobrzynski H, Boyett M. Structure-function relationship in the AV junction. Anatom Rec. 2004;280A:952–965. doi: 10.1002/ar.a.20108. [DOI] [PubMed] [Google Scholar]
- 8.de Carvalho AP, de Almeida DF. Spread of activity through the atrioventricular node. Circ Res. 1960;8:801–809. doi: 10.1161/01.res.8.4.801. [DOI] [PubMed] [Google Scholar]
- 9.Anderson RH, Janse MJ, van Capelle FJ, Billette J, Becker AE, Durrer D. A combined morphological and electrophysiological study of the atrioventricular node of the rabbit heart. Circ Res. 1974;35:909–922. doi: 10.1161/01.res.35.6.909. [DOI] [PubMed] [Google Scholar]
- 10.Medkour D, Becker AE, Khalife K, Billette J. Anatomic and functional characteristics of a slow posterior AV nodal pathway: role in dual-pathway physiology and reentry. Circulation. 1998;98:164–174. doi: 10.1161/01.cir.98.2.164. [DOI] [PubMed] [Google Scholar]
- 11.Greener ID, Tellez JO, Dobrzynski H, Yamamoto M, Billeter-Clark R, Boyett MR. Distribution of ion channel transcripts in the rabbit atrioventricular node as studied using in situ hybridisation and quantitative PCR. J Mol Cell Cardiol. 2006;40:982–983. [Google Scholar]
- 12.Tellez JO, Dobrzynski H, Greener ID, Graham GM, Laing E, Honjo H, Hubbard SJ, Boyett MR, Billeter R. Differential expression of ion channel transcripts in atrial muscle and sinoatrial node in rabbit. Circ Res. 2006;99:1384–1393. doi: 10.1161/01.RES.0000251717.98379.69. [DOI] [PubMed] [Google Scholar]
Associated Data
This section collects any data citations, data availability statements, or supplementary materials included in this article.


