Abstract
Previous research (Andersen & Kim, 2001) has shown that a linear-trajectory collision event (i.e., collision between a moving object and an observer) is specified by objects that are expanding and maintain a constant bearing (the object location remains constant in the visual field). In the present study we examined the optical information for detecting a collision event when the trajectory was of constant curvature. Under these conditions, a collision event is specified by expansion of an object and a constant rate-of-bearing change. Three experiments were conducted in which trajectory curvature and display duration were varied while maintaining time-to-contact, speed, and initial image position of the collision objects. Results indicate that collision detection performance decreased with an increase in trajectory curvature and decreased with a decrease in display duration, especially for highly curved trajectories. In Experiment 3 we found that the presentation of constant rate-of-bearing change in non-collision stimuli resulted in an increase in the false alarm rate. These results demonstrate that observers can detect collision events on curved trajectories, and that observers utilize bearing change information.
Successfully detecting and avoiding collisions is an important task for the safety of an observer. Failure to perform this task can have serious consequences for a moving observer as well as other individuals in the environment (i.e., pedestrians, bicyclists, or other drivers). Consider findings from the fatal analysis reporting system of NHTSA (National Highway Traffic Safety Administration). 42.7% of the 25,840 fatal crashes in 2001 involved two moving vehicles (Evans, 2004). In addition, a decreased ability to detect and avoid collisions has been shown to be a central factor in the high incidence of falls among the elderly (Weerdesteyn et al., 2005; also see Northridge et al., 1995; Salgado et al., 1994).
The conditions that define a collision event are quite varied. Consider the motion of an object or observer that defines a collision event. The direction of object motion can be linear or curved and the speed of motion can be constant or varying (accelerating or decelerating). Similarly, the direction of observer motion can be linear or curved and the speed can be constant or varying. All possible combinations of object motion and observer motion would thus yield 16 different combinations of trajectories (straight trajectory/constant speed, curved trajectory/constant speed, straight trajectory/variable speed, and curved trajectory/variable speed, for object and observer motion; See Andersen and Sauer, 2004 for a detailed discussion). In addition, there are 8 other trajectory conditions for a static object and moving observer or static observer and moving object. As will be evident from the literature review below, many of these conditions have not been examined.
A considerable number of studies have investigated a related but different issue than collision detection---the time to contact (TTC) of an impending collision event. Lee (1976) provided one of the earliest analyses, showing that TTC (referred as τ) is specified by the inverse rate of relative optical expansion [i.e. the rate of expansion divided by the image size; See Tresilian (1991) and Wann (1996) for variations of this analysis]. The utility of τ has been examined in several contexts including interceptive judgments in sports (Bootsma and Van Wieringen, 1990; Savelsbergh and Bootma, 1994; Zaal & Bootsma, 2004; Lee et al., 1983), aviation (Flach & Warren, 1995), reaching (Bingham and Zaal, 2004), and driving (Schiff, Oldak & Shaw, 1992, Andersen & Enriquez, 2006; Kiefer, Flannagan & Jerome, 2006; Vogel, 2003). Other studies (DeLucia et al., 2003a; DeLucia, 2004a; DeLucia, 2004b; DeLucia, 2005; Kim and Grocki, 2006) have found evidence that observers utilize other sources of information (e.g. occlusion, binocular disparity, motion parallax, similar size, and shading) in determining TTC. Finally, studies have shown the utility of multiple sources of information (i.e., motion and disparity) for TTC under conditions in which surrounding optical flow is present (during self-motion) or absent (observer is static; Regan and Gray, 2001). Although the usefulness of τ and other information sources is well documented in the literature (see Hecht and Savelsbergh, 2004 for an edited volume on time to contact) these studies assume a collision event and thus do not address the issue of what information is available for detecting a collision event. In addition, these studies have exclusively examined linear trajectories collisions.
Research specifically examining collision detection can be categorized, for the sake of convenience, into two groups: Studies examining collisions with motion on a linear trajectory and varying in speed (i.e. deceleration during braking) and collisions with motion on a linear trajectory and constant speed. Lee (1976) proposed that the time derivative of τ, referred to as , is an important source of information for avoiding collisions during deceleration. Consider a vehicle approaching an intersection with stationary traffic (i.e. a stationary vehicle in the traffic lane). According to Lee’s analysis, if a driver regulates the deceleration to maintain a value less than or equal to -0.5 the vehicle will reach zero velocity (a safe stop) without a collision. If the driver decelerates such that is greater than -0.5 the driver will collide with the stopped vehicle in the lane. Previous studies (Yilmaz and Warren, 1995; Andersen et al. 1999, Fajen, 2005; Kim, Turvey and Carello, 1993; Rock and Harris, 2006) examined the use of in collision detection during deceleration and braking regulation. The results of these studies suggest observers use , as well as size and distance information for detecting collisions during braking. It is worth noting that these studies, similar to TTC studies, examined linear trajectories in assessing collision events.
Studies examining linear trajectory and constant speed collisions required observers to indicate whether motion of an object was or was not on a collision trajectory with the observer. Under these conditions a collision event is defined by the presence of expansion (approach of the object) and a constant bearing (the visual angle relative to a reference point in the scene remained constant). These studies have examined the ability of observers to detect a collision event when multiple moving objects are present (Andersen & Kim, 2001), in assessing age related differences in discriminating collision and non-collision objects (DeLucia, et al., 2003b), and in assessing age related differences in detecting collision events under stationary and moving observer conditions (Andersen & Enriquez, 2006).
Our review of the literature indicates that a number of studies have examined the detection of linear trajectory collision events and the related issue of time to contact. To our knowledge there have been no studies that have examined the detection of curved trajectory collision events. The lack of research on curved trajectory collision events is surprising as real world collision events would often include curved paths. The goal of the present study was to examine the detection of collision events when the trajectory of object motion was on a constant curved (circular) trajectory. Our research focused on this event because it is the least complex condition of a curved trajectory (constant curvature and constant speed). An important question is what information is available to observers for detecting collisions under these conditions? Previous research (Rieger, 1983) has suggested that the translational component of the optical flow field and the time derivatives of the velocity field are sufficient for determining the TTC and the angle of approach. Kerzel and colleagues (2001) examined time-to-passage (the time before an object passes by the observer) judgments for objects moving on circular trajectories. They found that an object that passed on an inside trajectory was more likely to be judged as the first to pass the observer. They concluded that the bias in TTP judgments was based on the use of relative optical acceleration (between the two objects). The utility of this source of information assumes that at least two objects are moving in the scene towards one another. The goal of the present study was to determine the information available from a single moving object that is on a collision event with the observer.
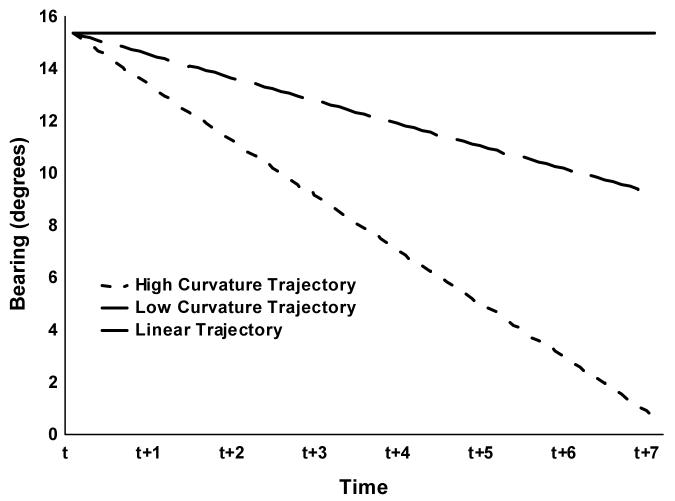
With regard to the optical specification of a collision event, a circular (curved) trajectory is different from a linear trajectory in that the object’s bearing (angular direction or position in the flow field) changes as it approaches the observer (see Figure 1). The angular direction is not constant and eventually reaches zero as a collision becomes imminent. Thus, observers cannot detect a collision event from object bearing alone. Since highly curved trajectories result in a greater bearing change, the detection of a circular trajectory collision event is related to bearing change. This suggests that bearing change information might specify an impending collision.
Figure 1.
Relationship of bearing as a function of time for two collision events (linear trajectory and circular trajectory). The circular trajectory was a path with radius of 225 units.
A formal analysis of circular trajectories indicates that the rate-of-bearing change is constant when an object is on a collision path with the observer (see Appendix). Specifically, the rate-of-bearing change for a circular trajectory is specified by
| (1) |
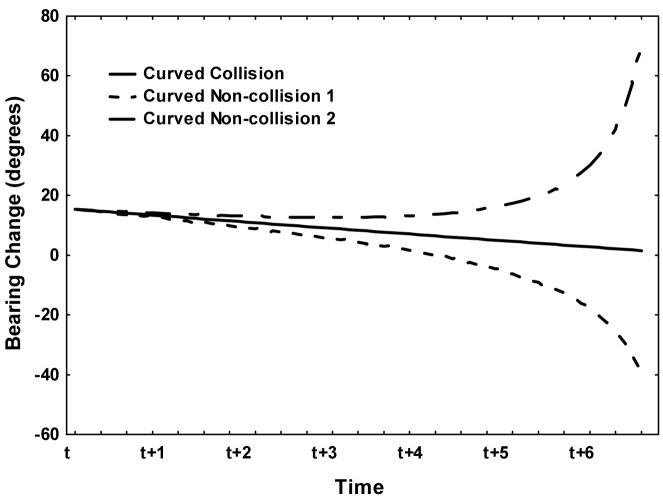
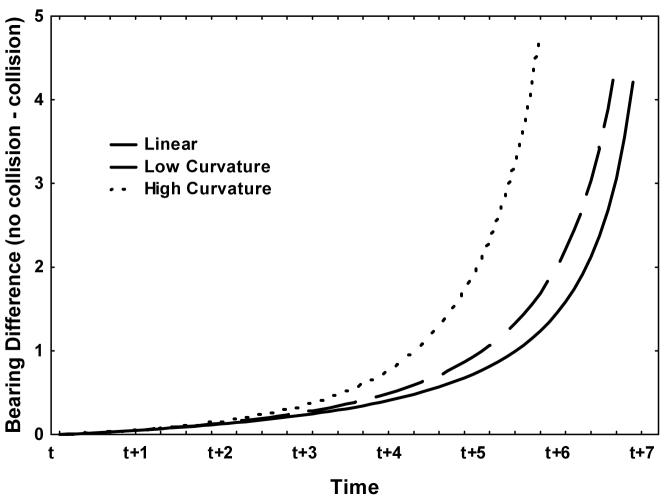
where is the time derivative of the bearing angle and ω is the angular speed of motion along the circular trajectory. Equation 1 indicates that, for a given circular path, the rate-of-bearing change over time is constant for an object on a collision trajectory (see Figure 2). However, for an object moving on a non-collision trajectory, the rate-of-bearing change varies over time (as shown in Figure 2). The difference in bearing change between collision and non-collision trajectories increases over time, suggesting that if observers use the rate-of-bearing change to detect a curved trajectory collision then detection performance will increase as a function of duration. This relationship is due to the divergence of collision and non-collision trajectories, relative to the observer’s position, with increased time. In addition, the difference in rate-of-bearing change for collision and non-collision trajectories is greater as the curvature of the trajectory is increased (see Figure 3).
Figure 2.
Relationship of change of bearing as a function of time for a curved path collision event (solid line) and two curved pah non-collision events (dotted lines). The non-collision events were created by rotating +/- 5 degrees from the collision trajectory (see Figure 4 for a detailed explanation).
Figure 3.
Relationship of the difference in bearing change between non-collision and collision trajectories as a function of time. The solid line is the difference for linear trajectories whereas the dashed lines are for low (225 radius) and high (550) curved trajectories.
Consider an object moving along a circular trajectory that will either collide or pass the observer. Under these conditions two predictions can be made regarding the detection of a collision. First, we predict that collision detection performance will increase when an increase in the divergence of collision and non-collision paths. In the present study we examined this prediction by varying the display duration (i.e. since the object is approaching an increase in display duration will result in a greater difference between the motion path of collision and non-collision events and thus a greater difference in the rate-of-bearing change). Second, we predict that an increase in trajectory curvature will result in a decrease in collision detection performance.
We conducted three experiments to examine these predictions. In Experiment 1 we compared circular-trajectory collision detection performance to linear-trajectory collision detection performance. The goal of this experiment was to determine whether observers could detect collision events on circular trajectories and to determine whether circular path collisions are more difficult to detect than linear path collisions. In Experiment 2 we examined the relationship between the magnitude of trajectory curvature and collision detection performance. In Experiment 3 we decoupled information of constant rate-of-bearing change from collision stimuli by presenting observers with non-collision events that contained this information. If observers use constant rate-of-bearing change to identify collision events then we predict an increase in the false alarm rate under these conditions.
Experiment 1: Linear and circular trajectories
In Experiment 1 we examined collision detection performance for an object moving on a linear or circular trajectory. The displays simulated an approaching spherical object in a 3D scene. On 50% of the trials the approaching object was on trajectory that would collide with the observer. On the other 50% of trials the approaching object was on a trajectory that would pass by the observer. Observers were asked to indicate whether or not the object was on a collision trajectory with the observer. We varied the motion trajectory and display duration while maintaining time-to-contact, speed, and initial image position of the objects.
Subjects
The subjects were 8 college age students at the University of California, Riverside who were paid for their participation. All subjects had normal or corrected to normal vision, and were naïve to the purpose of the experiment.
Design
The independent variables were display duration (2, 3.25, 4.5, or 5.75 seconds), collision event (collision or non-collision trajectory), and the motion trajectory of the object (curved with a radius of 225, or linear). All variables were run as within-subject variables.
Apparatus
The displays were presented on a Dell PC computer system. The display was presented on a ViewSonic VP230mb flat monitor, with the dimension of 47cm (width) by 35cm (height), with the refresh rate at 60 Hz and the resolution at 1024 by 768. Subjects viewed the displays monocularly through a 19 cm diameter glass collimation lens. Head position was fixed using a chinrest. The purpose of the collimating lens was to remove accommodation cues of distance to the monitor. The distance between the eye and the lens was approximately 10 cm and the distance from the eye to the monitor was 85 cm.
Stimuli
The displays simulated a 3-D scene consisting of a roadway, roadway strip, and textured ground (See Figure 4). The total dimensions of the simulated space were 2000 by 1000 units. The roadway was 6 units horizontally and extended the entire length of the simulated space. A solid, double yellow line was projected down the length of the roadway. An irregular green texture pattern was presented to the left and right of the roadway. The viewpoint was 1.0 unit above the ground plane, which represented 1 eye height in the scene (assumed to be 1.22 m). The object was a bright red sphere (2.0 unit diameter).
Figure 4.
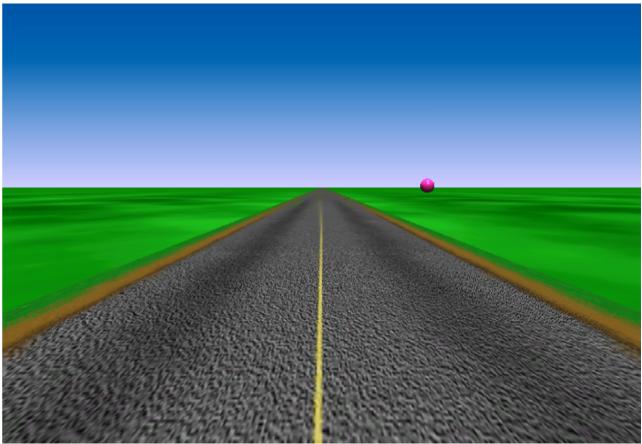
A single frame of the stimuli used in the experiments.
The approaching spherical object was initially positioned to the left or right of the roadway along an arc (+/- 20 degrees from the center of the display) at a fixed distance 115 units from the viewpoint. The object moved on either a linear or circular trajectory (radius of 225 units). The direction of motion for all displays was from the peripheral visual field to the central visual field. 50% of the trials consisted of motion trajectories that would collide with the observer. The remaining 50% of the trials consisted of motion trajectories that would pass by the observer.
Linear trajectories were generated using the same method employed by Andersen and Kim (2001). The 3D velocity for collision and non-collision events was constant. The total travel time from the initial position to the collision point was 7.2 sec. Collision events were created by intersecting the trajectory, from the initial position, with the viewpoint of the observer. Non-collision events were created by altering the trajectory of a collision event. The initial position (along the arc 115 units from the viewpoint) was kept constant but the endpoint of the trajectory was repositioned to the left or right of the viewpoint by 4 or 8 units.
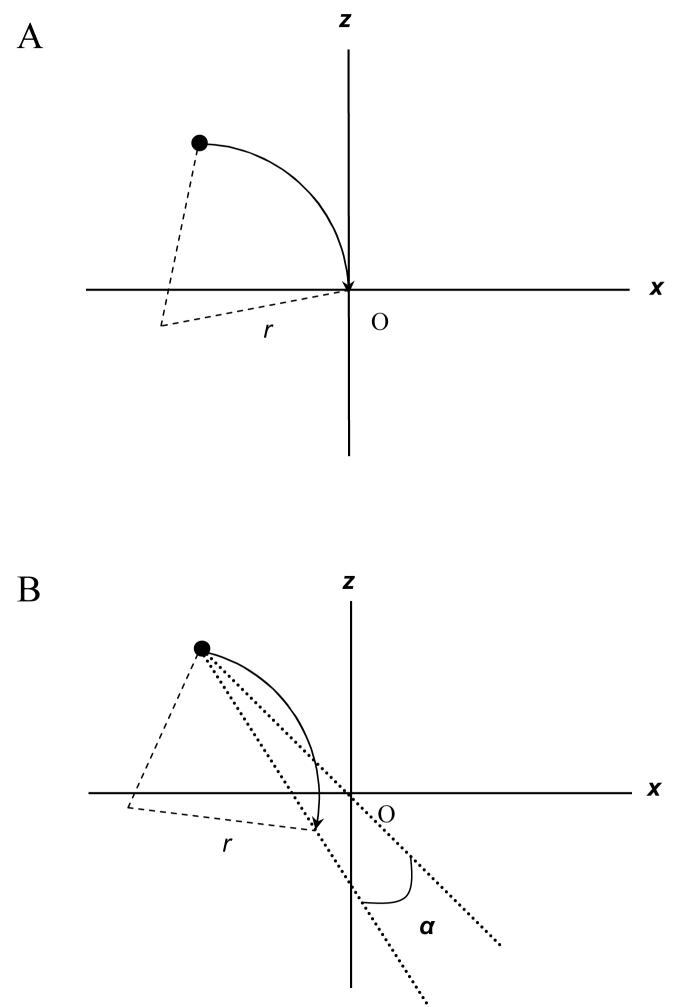
Circular trajectories were generated using the following method (see Figure 5). Both collision and non-collision events simulated object motion along a circular trajectory at a constant angular velocity. Collision events were created using the geometry illustrated in Figure 5A. Objects were initially positioned along an arc at a fixed distance of 115 units. The total travel time along the circular trajectory from the initial position to the collision point was 7.2 sec. Collision events were created by intersecting the circular trajectory with the viewpoint of the observer as shown in Figure 5B. Non-collision events were created by rotating the circular trajectory of a collision event, about the initial position of the object, +/- angle α (see Figure 5B). Two different values of α were used (2.5 and 5 deg) to prevent observers from identifying non-collision events based on the position of the object on the last frame of the display.
Figure 5.
Geometry used for collision (A) and non-collision (B) circular trajectories. O is the viewpoint of the observer. The radius of the circular path is r. Collision trajectories were of constant curvature and started from an initial fixed distance from the observer and intersected the viewpoint. Non-collision trajectories were generated by rotating the constant curvature trajectory of a collision event about the initial position by angle α.
Subjects were shown 2, 3.25, 4.5, or 5.75 sec of the motion trajectory before it disappeared. The rate-of-bearing change for the circular path collision event was -3.66 deg/sec. Projected visual angle values for collision and non-collision events are presented in Table 1. Included are values of the initial visual angle (first frame of the display) and terminating visual angle (last frame of the display). Values of the terminating visual angle for non-collision events can vary as a function of the initial position of the object (along the arc in the 3D geometry). Thus, we have included a range of values for the terminating visual angle for non-collision events.
Table 1. Projected visual angles of approaching object in Experiments 1-3.
| Collision Event |
Non-collision Event |
|||||||||
|---|---|---|---|---|---|---|---|---|---|---|
| Time(sec) |
Time(sec) |
|||||||||
| Path | 0 | 2.0 | 3.25 | 4.5 | 5.75 | 0 | 2.0 | 3.25 | 4.5 | 5.75 |
| Linear | 0.59 | 0.82 | 1.09 | 1.59 | 2.98 | 0.59 | 0.82-0.85 | 1.07-1.10 | 1.51-1.64 | 2.71-2.87 |
| 110 | 0.59 | 0.84 | 1.10 | 1.59 | 2.94 | 0.59 | 0.83-0.85 | 1.06-1.13 | 1.48-1.69 | 2.47-3.29 |
| 225 | 0.59 | 0.82 | 1.09 | 1.60 | 3.04 | 0.59 | 0.82-0.83 | 1.07-1.09 | 1.53-1.60 | 2.61-2.93 |
| 255 | 0.59 | 0.82 | 1.09 | 1.60 | 3.07 | 0.59 | 0.83-0.83 | 1.08-1.09 | 1.54-1.59 | 2.68-2.87 |
| 315 | 0.59 | 0.83 | 1.09 | 1.59 | 2.91 | 0.59 | 0.82-0.82 | 1.08-1.08 | 1.56-1.58 | 2.77-2.88 |
| 410 | 0.59 | 0.83 | 1.09 | 1.59 | 2.96 | 059 | 0.81-0.84 | 1.05-1.11 | 1.50-1.63 | 2.58-2.98 |
| 550 | 0.59 | 0.85 | 1.14 | 1.70 | 3.39 | 0.59 | 0.81-0.84 | 1.07-1.10 | 1.55-1.59 | 2.74-2.82 |
Note:Zero sec time refers to first frame of the display.
110, 225, 255, 315, 410, and 550 are radii of circular path.
Procedure
Subjects were informed that they would be shown a series of displays consisting of a 3D scene with a single object, located in the distance, that was moving towards the observer. Their task was to determine whether the moving object would hit the observer. Observers were next shown a series of demonstration displays of collision and non-collision stimuli on linear and circular paths. The demonstration displays depicted the complete trajectory. Thus, collision event displays showed a distance object that approached the observer and eventually filled the entire screen. For non-collision events the displays showed a distance object that approached and eventually passed to the left or right of the observer outside the field of view.
After observers understood the task they were presented with 8 practice trials, half of which simulated a collision, and were asked to indicate whether or not the object was on a collision trajectory. The practice trials depicted the complete event (collision or no collision) and included both linear and curved trajectories. Subjects pressed the right mouse button for non-collision responses and the left mouse button for collision responses No feedback was used at any point during the practice trials or experiment. Observers were required to correctly identify 7 of the 8 practice trials before proceeding to the experimental trials. This was done to ensure that the subjects understood the task and response.
Following the practice trials subjects were instructed that the experiment would include brief presentations of the collision and non-collision events. If they were uncertain of whether the display was a collision or non-collision event they should make the best judgment possible. Subjects were given 4 sessions of trials with 8 replications of each condition (2 trajectories by 2 collision event by 4 display durations), presented in a random order. Subjects were given a brief break between sessions.
Results
The average proportion of hits (collision response for trials that simulated a collision) and false alarms (collision response for trials that did not simulate a collision) was calculated for each subject in each condition and used to derive sensitivity (d’) and response bias (β) measures.
Sensitivity
The d’ values for each subject in each condition were analyzed in a 4 (duration) by 2 (motion trajectory) ANOVA (Analysis of Variance). The main effect of duration was significant, F(3, 21)=50.4, p<0.01. The mean d’ score was 0.96 (SE 0.10), 1.52 (SE 0.24), 2.84 (SE 0.33), and 3.97 (SE 0.22) for the 2.0, 3.25, 4.5, and 5.75 sec duration conditions, respectively. Post hoc comparisons (Tukey’s HSD test) indicated significant differences between all pairwise comparisons except the 2.0 sec and 3.25 sec conditions. These results indicate greater sensitivity in detecting a collision with increased duration.
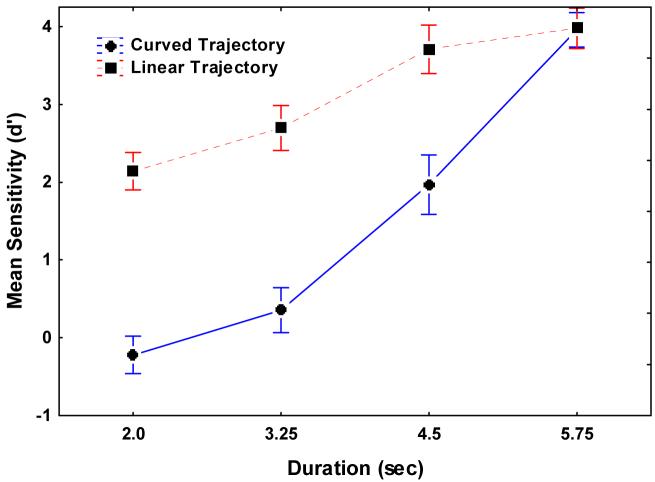
The main effect of object trajectory was significant, F(1, 7)=96.2, p<0.01. The mean d’ scores for the curved and linear conditions were 1.52 (SE 0.22), and 3.13 (SE 0.15) respectively. These results indicate a decreased sensitivity to detect a collision on a circular trajectory as compared to a linear trajectory. The interaction between motion trajectory and display duration was also significant ((F(3, 21)=17.2, p<0.01), and is shown in Figure 6. The results indicate a decrease in detection sensitivity with decreased duration, with a greater decrease obtained for circular as compared to linear trajectories.
Figure 6.
Mean d’ (sensitivity to detect a collision) plotted as a function of display duration and type of trajectory (linear and curved) from Experiment1. Error bars are +/- 1 standard error.
An important issue is whether detection performance was significantly different than chance. An additional analysis was performed to determine whether the d’s were significantly different than chance using the statistic (conversion of d’ scores into a z-statistic) proposed by Marascuillo (1970). We conducted these tests based on the individual d’ values for each observer in each condition. The results indicate that detection sensitivity for all observers was significantly above chance (p<0.05) for all conditions except for the curved trajectory event shown for durations of 2.0 and 3.25 sec. Under these conditions no subject was able to detect a collision with greater than chance performance.
Bias
The β values for each subject in each condition were analyzed in a 4 (duration) by 2 (motion trajectory) ANOVA (Analysis of Variance). The main effects of duration (F(3,21) = 0.99) and motion trajectory (F(1,7) = 0.72) were not significant, p>.05. The interaction of duration and motion trajectory was also not significant, F(3,21) = 2.1, p>.05.
Experiment 2
In Experiment 1 we found that observers could detect a circular trajectory collision event with greater than chance performance. In Experiment 2 we systematically manipulated the curvature of the trajectory to determine the relationship between the magnitude of trajectory curvature and collision detection performance.
Subjects
The subjects were 8 college age students at the University of California, Riverside who were paid for their participation. All subjects had normal or corrected to normal vision, and were naïve to the purpose of the experiment.
Design
The independent variables were display duration (2, 3.25, 4.5, or 5.75 sec), collision event (collision or non-collision trajectory), and the curvature of the trajectory (110, 225, 255, 315, 410, or 550 units in radius). All variables were run as within-subject variables.
Apparatus
The apparatus was the same as in Experiment 1.
Stimuli
The stimuli were the same as in Experiment 1 with the following exception. Six circular motion trajectories were generated (radii of 110, 225, 255, 315, 410, or 550 units) and were presented as collision or non-collision events. The rate-of-bearing change for 110, 225, 255, 315, 410, and 1.67 circular path collision events were -8.27, -4.14, -3.66, -2.86, -2.22, and -1.67 deg/sec, respectively. Projected visual angle values for collision and non-collision events are presented in Table 1.
Procedure
The procedure was the same as in Experiment 1 with the following exception. Observers were presented 16 replications of each stimulus condition (6 curved trajectories by 4 display durations by 2 collision event) across 8 blocks of trials in a randomized order.
Results
The average proportion of hits (collision response for trials that simulated a collision) and false alarms (collision response for trials that did not simulate a collision) was calculated for each subject in each condition and used to derive sensitivity (d’) and response bias (β) measures.
Sensitivity
The d’ values for each subject in each condition were analyzed in a 4 (duration) by 6 (motion trajectory) ANOVA (Analysis of Variance). The main effect for duration was significant (F (3, 21) =210.00, p<0.01). The mean d’ values for the 2.0, 3.25, 4.5, and 5.75sec durations were 0.48 (SE 0.13), 1.47 (SE 0.26), 3.33 (SE 0.19), and 4.06 (SE 0.23) respectively. Post hoc comparisons indicated significant differences (p<.05) between all pairwise comparisons.
The main effect of curvature trajectory was significant (F (5, 35) =37.24, p<0.01). The mean d’ values for the 110, 225, 255, 315, 410 and 550 unit radii conditions were 1.32 (SE 0.26), 1.67 (SE 0.23), 2.34 (SE 0.18), 2.77 (SE 0.23), 2.88 (SE 0.22) and 3.04 (SE 0.13) respectively. Post hoc comparisons (Tukey’s HSD test) indicated significant differences between all pairwise comparisons with the exception of the 110 and 225, 255 and 315, 315 and 410, 315 and 550, and 410 and 550 comparisons.
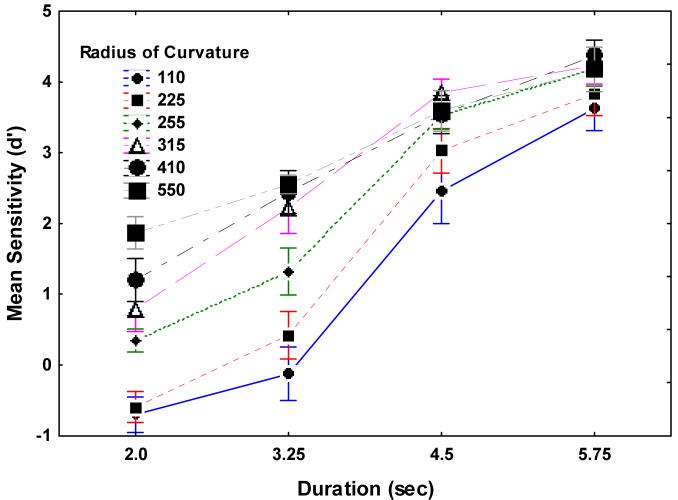
The interaction between trajectory curvature and display duration was also significant (F (15, 105) =4.8100, p<0.01), and is shown in Figure 7. The results indicate that sensitivity increased more sharply with an increase in both display duration and radius of the motion trajectory. A decrease in the radius will result in an increase in curvature. Thus, the result suggests that observers need more information, available with a longer duration, to detect collision events on highly curved paths.
Figure 7.
Mean d’ plotted as a function of display duration and curvature radius from Experiment 2. Error bars are +/- 1 standard error.
An additional analysis was performed to determine whether the d’s were significantly different than chance using the statistic proposed by Marscuilo (1970). For the 4.5 and 5.75 sec durations the results indicated that detection performance was significantly greater than chance for all observers. The number of observers, with greater than chance sensitivity, decreased at shorter durations. For the 3.5 sec duration the number of observers with greater than chance sensitivity (out of 8 observers) were 2, 3, 6, 8, 8, and 8 for the 110, 225, 255 315, 410 and 550 unit radii trajectories. For the 2.0 sec duration the number was 0, 0, 2, 5, 8, and 8 for the 110, 225, 255 315, 410 and 550 radii trajectories, respectively. These results indicate that the number of observers with greater than chance sensitivity increased with an increase in duration and radius of the trajectory.
Bias
The β values for each subject in each condition were analyzed in a 4 (duration) by 6 (motion trajectory) ANOVA (Analysis of Variance). The main effect of duration (F(3,21) = 4.7) was significant, p<.05. The mean β values for the 2.0, 3.25, 4.5, and 5.75 sec durations were 0.80 (SE 0.04), 1.00 (SE 0.11), 1.15 (SE 0.07), and 1.05 (SE 0.10), respectively. Post hoc comparisons (Tukey HSD test) indicated a significant difference between the 2.0 and 3.25 sec conditions. These results indicate that observers were more conservative in their responses at the shortest display duration. The main effect of motion trajectory (F(5,35) = 2.1) and the duration by motion trajectory interaction (F(15,105) = 1.63), were not significant, p>.05.
Correlation Analysis
As indicated in the introduction, the rate-of-bearing change for a collision object on a curved trajectory is constant whereas the rate-of-bearing change for a non-collision object on a curved trajectory will vary. Furthermore, the difference in rate-of-bearing change between collision and non-collision objects will vary according to factors such as the curvature of the trajectory and the duration of the display. This suggests that if observers use the rate-of-bearing change to detect collision and non-collision events then the difference in rate-of-bearing change for these factors should be correlated with performance. To examine this possibility we derived the difference in rate-of-bearing change between collision and non-collision events from the conditions examined in Experiment 2 and determined the correlation of this information to detection performance. 24 difference values were derived for the conditions in Experiment 2 by subtracting the bearing value of non-collision objects from the bearing value of collision objects for each combination of trajectory curvature (6 different trajectories) and display duration (4 durations). The correlation (r=.80) of these values with the average d’ values in Experiment 2 was significant (F(1,22) = 39.5, p<.01). This result indicate that detection performance was strongly correlated with the difference in rate-of-bearing change between collision and non-collision trajectories, accounting for 64% (r2) of the variability in detection performance.
Experiment 3
In Experiment 1 we found that observers could detect a collision on a circular path. In Experiment 2 we found that collision detection performance varied as a function of the curvature of the trajectory. In addition, a significant correlation was obtained between detection performance and the difference in rate-of-bearing change (between collision and non-collision trajectories), suggesting that subjects use the rate-of-bearing change to detect circular path collisions. All of the collision conditions examined in Experiment 2 contained constant rate-of-bearing change whereas the non-collision events contained a rate-of-bearing change that varied. In Experiment 3 we tested the use of this information by generating non-collision stimuli that contained constant rate-of-bearing change. This manipulation was produced by varying the speed of the approaching object along the trajectory. If subjects use constant rate-of-bearing change information for detecting a collision event, then we predict an increase in the false alarm rate for these special non-collision stimuli as compared to non-collision stimuli that did not contain this information.
Subjects
The subjects were 8 college age students at the University of California, Riverside who were paid for their participation. All subjects had normal or corrected to normal vision, and were naïve to the purpose of the experiment.
Design
The independent variables were display duration (2 or 4.5 sec), collision event (collision trajectory, non-collision trajectory with constant rate-of-bearing change, or non-collision with variable rate-of-bearing change), and the curvature of the trajectory (110, 255, or 410 units in radius). All variables were run as within-subject variables.
Apparatus
The apparatus was the same as in Experiment 1.
Stimuli
The method used to generate the trajectories was the same as that used in Experiment 2 (see Figure 5). Three circular motion paths (110, 255, or 410 unit radii) were examined. For collision events the 3D angular velocity (along the trajectory) was constant (the same conditions examined in Experiment 2). The rate-of-bearing change for the 110, 225, and 410 radii collision stimuli was -8.27, -4.14, and -2.22 deg/sec, respectively. For 75% of non-collision stimuli the 3D angular velocity (along the trajectory) was also constant (identical to the non-collision conditions examined in Experiment 2). For the remaining 25% of non-collision stimuli the 3D angular velocity (along the trajectory) was varied to produce a constant bearing change equal to that present in the collision stimuli. Thus, the constant rate-of-bearing change for the 110, 225, and 410 radii non-collision stimuli was -8.27, -4.14, and -2.22 deg/sec, respectively. Projected visual angle values for collision and non-collision events are presented in Table 1.
Procedure
The procedure was the same as in Experiment 2 with the following exceptions. Demonstration and practice trials only included stimuli with constant 3D angular velocity (i.e. non-collision stimuli with constant rate-of-bearing change were not shown). Observers were presented 32 replications of each stimulus condition (3 curved trajectories by 2 display durations by 2 collision event) across 8 blocks of trials in a randomized order.
Results
The average proportion of hits (collision response for trials that simulated a collision) and false alarms (collision response for trials that did not simulate a collision) was calculated for each subject in each condition.
False Alarm Rate
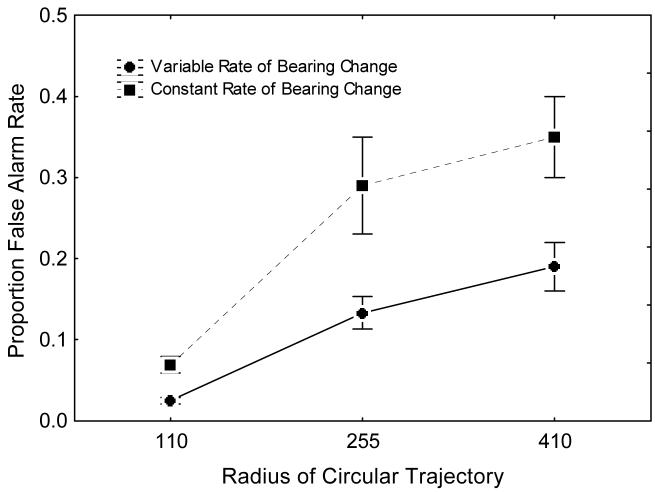
The mean proportion of false alarms for each subject was analyzed in a 2 (rate-of-bearing change) by 2 (duration) by 3 (curved trajectory) ANOVA. The main effect of rate-of-bearing change was significant, F(1,7) = 5.7, p<.05. The average false alarm rate for the variable and constant rate-of-bearing change was 0.11 (SE 0.016) and 0.24 (SE 0.04), respectively. This finding indicates an increase in the false alarm rate when a constant rate-of-bearing change was present in non-collision events. In addition, the interaction of rate-of-bearing change and path curvature was significant, F(2,14) = 7.2, p<.05, and is shown in Figure 8. According to this result, the false alarm rate for constant rate-of-bearing change stimuli increased with an increase in the radius of the curved path. For some conditions this effect was quite pronounced. For example, for the 255 and 410 radii trajectories the false alarm rate increased 17% and 18% respectively when constant rate-of-bearing change was present.
Figure 8.
Mean false alarm rate plotted as a function of bearing change (variable or constant) and radius of circular trajectory from Experiment 3. Error bars are +/- 1 standard error.
Sensitivity
The d’ values for each subject in each condition (using non-collision trials in which the rate-of-bearing change varied) were analyzed in a 2 (duration) by 3 (motion trajectory) ANOVA (Analysis of Variance). The main effect for duration was significant (F (1, 7) =75.6, p<0.01). Overall sensitivity increased with an increase in duration. The main effect of motion trajectory was significant, F(2,14) = 42.8, p<.01, with greater sensitivity occurring with an increase in the radius of the curved path. Finally, the interaction of duration and curvature was significant, F(2,14) = 7.4, p<.01. All three of these findings are a replication of the results obtained in Experiment 2 with different subjects.
Bias
The β values for each subject in each condition (using non-collision trials in which the rate-of-bearing change varied) were analyzed in a 4 (duration) by 6 (motion trajectory) ANOVA (Analysis of Variance). The main effect of duration (F(1,7) = 0.84), motion trajectory (F(2,14) = 2.8), and the interaction of duration and motion trajectory (F(2,14) = 0.94) were not significant, p>.05.
General Discussion
In the introduction of this paper we reviewed the wide range of conditions that can result in a collision event. These conditions can include motion of an object or of the observer, and can involve linear or curved paths of motion. The present study focused on a specific set of these conditions---circular trajectories of object motion. A formal analysis of this condition indicates that collision events are specified by a constant rate-of-bearing change. We examined the use of this information in three experiments. In the first experiment, we examined the detection of collision events on linear and circular trajectories. The results indicated greater sensitivity to detect a collision on a linear as compared to a circular trajectory. However, observers could detect a collision event on a circular trajectory with greater than chance performance, particularly for longer display durations. In Experiment 2 we examined the relationship between the curvature of the trajectory and display duration in detecting collision events. The results indicated decreased sensitivity to detect a collision with an increase in trajectory curvature. Similar to the results of Experiment 1 performance was dependent on display duration, with greater sensitivity at increased durations. A correlational analysis of the difference in rate-of-bearing change for collision and non-collision stimuli was significant, providing further support that subjects use rate-of-bearing change to detect collision events. In Experiments 1 and 2 constant rate-of-bearing information was only present in collision event stimuli. In Experiment 3 we decoupled this relationship by presenting constant rate-of-bearing change for non-collision events. The results indicated a significant increase in the false alarm rate, indicating that subjects used this information to identify a collision event.
The results of the present study, considered together, indicate that observers use constant rate-of-bearing change information to detect circular path collision events. An important question is whether other sources of information are used to detect collision events? For example, previous studies have shown that relative size and edge rate information is used to detect collision events during deceleration and for regulation of braking (Andersen, Cisneros, Atchley & Saidpour, 1999; Andersen, Cisneros, Saidpour, & Atchley, 2000; see Andersen & Sauer, 2004 for a detailed discussion). Other studies have shown that relative size, familiar size, binocular disparity, and occlusion are used in judging TTC (DeLucia, 1991; DeLucia and Warren, 1994; DeLucia, 2005; See DeLucia 2004a for a detailed discussion). The goal of the present study was not to argue that constant rate-of-bearing change is the sole source of information for detecting curved path trajectories. We expect that sources of information found important for time to contact judgments and collision detection during deceleration will likely be important for curved path collision detection. An important issue for future research will be to examine these information sources.
The present study examined the simplest case of curved trajectories---constant curvature. Real world conditions will often involve much more complex trajectories in which curvature can dramatically vary over time. Detecting a collision, under these conditions, may be particularly difficult because the rate-of-bearing change will not be constant. Instead, observers may need to recover information specified by higher order derivatives of bearing change that allow observers to extrapolate future changes in curvature from recent changes in curvature or to use other sources of information (e.g., pictorial cues for distance) to detect collision events. The present results (Experiment 1) showed a significant decrease in detection performance when subjects were required to detect circular as compared to linear trajectories. We expect greater difficulty when the trajectory is more complex. An important issue for future research will be to determine if indeed subjects can detect collision events with complex trajectories.
These results, considered together, indicate that observers can detect collision events on circular trajectories and that observers use constant rate-of-bearing change to identify collision events. It is worth noting that although observers can detect circular path collisions detection performance was below detection results for linear path collisions (Experiment 1). This finding has important implications for human factors issues such as driving. The present scenario simulated object motion along a circular trajectory with a static viewpoint. In real world settings this scenario is similar to an approaching vehicle undergoing a left turn in front of a driver stopped at a traffic light. Mathematically, the same constant bearing information is present to the driver undergoing the left turn. The decreased detection performance for circular paths was dependent on display duration, indicating that with sufficient viewing time detection performance was equal to detection of linear collision events. But the improved performance with longer durations comes at a cost for safety---an increase in viewing time results in less time for the observer to maneuver their vehicle to avoid the impending collision. This observation suggests that drivers are more likely to be involved in a collision when the motion path is curved. The increased crash risk, under these conditions, suggests driver safety might be improved by the development and implementation of warning systems for this type of event.
In summary, the results of the present study indicate that observers can detect collision events of objects moving on circular trajectories. Performance in detecting circular trajectory collisions is less robust than detecting linear trajectory collisions and requires more viewing time for optimal performance. The need for additional time to detect such events suggests that observers may be at greater risk of a collision when the impending collision is on a curved path. This finding suggests that a significant portion of driving accidents may be due to the difficulty in detecting curved path collision events.
Acknowledgments
This research was supported by NIH AG13419 and NIH EY18334.
Appendix
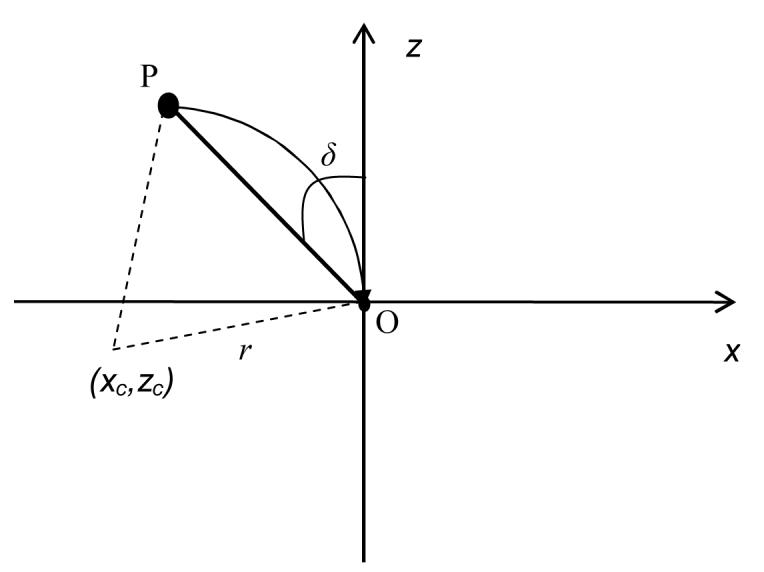 Consider an object moving along a circular trajectory in the x (horizontal) and z (depth) plane where O is the viewpoint of the observer, P is the approaching object, xc and zc are the center x and z coordinates of the circular path, r is the radius of the circle defining the circular path and δ is the visual angle. Furthermore, assume that ω is the angular speed, and t0 is the initial angular position of the moving object. The trajectory of motion is defined as
| (1) |
and
| (2) |
The relationship of bearing and time is defined as
| (3) |
The rate-of-bearing change over time is the time derivative of bearing change:
| (4) |
where
| (5) |
with
| (6) |
and
| (7) |
Substituting equations (1), (2), (5), (6), and (7) in Equation (4), we have:
| (8) |
If an object P is moving on a collision trajectory with the observer O then
| (9) |
Substituting (9) in Equation (8) we have:
which when simplified is
| (10) |
Thus, any object P moving on a circular collision path with the observer O will have a constant rate-of-bearing change.
References
- Andersen GJ, Sauer CW. Optical information for collision detection during deceleration. In: Hecht H, Savelsbergh G, editors. Advances in Psychology Volume 135: Time to Contact. Elsevier; Amsterdam, Netherlands: 2004. pp. 93–108. [Google Scholar]
- Andersen GJ, Cisneros J, Saidpour A, Atchley P. Speed, size and edge rate information for the detection of collision events. Journal of Experimental Psychology: Human Perception and Performance. 1999;25:256–279. doi: 10.1037//0096-1523.25.1.256. [DOI] [PubMed] [Google Scholar]
- Andersen GJ, Cisneros J, Saidpour A, Atchley P. Age-related differences in collision detection during deceleration. Psychology & Aging. 2000;15:241–252. doi: 10.1037//0882-7974.15.2.241. [DOI] [PubMed] [Google Scholar]
- Andersen GJ, Kim RD. Perceptual information and attentional constraints in visual search of collision events. Journal of Experimental Psychology: Human Perception and Performance. 2001;27:1039–1056. doi: 10.1037//0096-1523.27.5.1039. [DOI] [PubMed] [Google Scholar]
- Andersen GJ, Enriquez A. Aging and the Detection of Observer and Moving Object Collisions. Psychology and aging. 2006;21(1):74–85. doi: 10.1037/0882-7974.21.1.74. [DOI] [PubMed] [Google Scholar]
- Bingham GP, Zaal FT. Why tau is probably not used in guide reaches. In: Hecht H, Savelsburgh GJP, editors. Advances in psychology: Vol. 135. Time-to-contact. Elsevier-North-Holland; Amsterdam: 2004. pp. 371–388. [Google Scholar]
- Bootsma RJ, vanWieringen PCW. Timing an attacking forehand drive in table tennis. Journal of Experimental Psychology: Human Perception and Performance. 1990;16:21–29. [Google Scholar]
- DeLucia PR. Pictorial and motion-based information for depth perception. Journal of Experimental Psychology: Human Perception and Performance. 1991;17:738–748. doi: 10.1037//0096-1523.17.3.738. [DOI] [PubMed] [Google Scholar]
- DeLucia PR, Warren R. Pictorial and motion-based depth information during active control of self-motion: Size-arrival effects on collision avoidance. Journal of Experimental Psychology: Human Perception and Performance. 1994;20:783–798. doi: 10.1037//0096-1523.20.4.783. [DOI] [PubMed] [Google Scholar]
- DeLucia PR. Multiple sources of information influence time-to-contact judgments: Do heuristics accommodate limits in sensory and cognitive processes? In: Hecht H, Savelsburgh GJP, editors. Advances in psychology: Vol. 135. Time-to-contact. Elsevier-North-Holland; Amsterdam: 2004a. pp. 243–286. [Google Scholar]
- DeLucia PR. Time-to-contact judgments of an approaching object that is partially concealed by an occluder. Journal of Experimental Psychology: Human Perception and Performance. 2004b;30:287–304. doi: 10.1037/0096-1523.30.2.287. [DOI] [PubMed] [Google Scholar]
- DeLucia PR. Does binocular disparity or familiar size information override effects of relative size on judgements of time to contact? The Quarterly journal of experimental psychology. A, Human experimental psychology. 2005;58(5):865–886. doi: 10.1080/02724980443000377. [DOI] [PubMed] [Google Scholar]
- DeLucia PR, Kaiser MK, Bush JM, Meyer LE, Sweet BT. Information integration in judgments of time to contact. Quarterly Journal of Experimental Psychology. 2003a;56:1165–1189. doi: 10.1080/02724980343000053. [DOI] [PubMed] [Google Scholar]
- DeLucia PR, Kaiser MK, Meyer LE, Bush JM. Judgments about collision in younger and older drivers. Transportation research. Part F, Traffic psychology and behaviour. 2003b;6(1):63–80. [Google Scholar]
- Evans L. Traffic Safety. Science Serving Society; Bloomfield Hills, MI: 2004. [Google Scholar]
- Fajen BR. The Scaling of Information to Action in Visually Guided Braking. Journal of experimental psychology: human perception and performance. 2005;31(5):1107–1123. doi: 10.1037/0096-1523.31.5.1107. [DOI] [PubMed] [Google Scholar]
- Flach JM, Warren R. Global perspectives on the ecology of human-machine systems. Vol. 1. Lawrence Erlbaum Associates, Inc.; Hillsdale, NJ, England: 1995. Active psychophysics: The relation between mind and what matters. [Google Scholar]
- Hecht H, Savelsbergh GJP, editors. Advances in Psychology. Vol. 135. Elsevier; Amsterdam, Netherlands: 2004. Time to contact. [Google Scholar]
- Kim NG, Turvey MT, Carello C. Optical information about the severity of upcoming contacts. Journal of Experimental Psychology: Human Perception and Performance. 1993;19:179–193. doi: 10.1037//0096-1523.19.1.179. [DOI] [PubMed] [Google Scholar]
- Kerzel D, Hecht H, Kim N-G. Time-to-passage judgments on circular trajectories are based on relative optical acceleration. Perception & Psychophysics. 2001;63(7):1153–1170. doi: 10.3758/bf03194531. [DOI] [PubMed] [Google Scholar]
- Kiefer RJ, Flannagan CA, Jerome CJ. Time-to-Collision Judgments Under Realistic Driving Conditions. Human factors. 2006;48(2):334–345. doi: 10.1518/001872006777724499. [DOI] [PubMed] [Google Scholar]
- Kim N-G, Grocki MJ. Multiple sources of information and time-to-contact judgments. Vision Research. 2006;46(12):1946–1958. doi: 10.1016/j.visres.2005.12.011. [DOI] [PubMed] [Google Scholar]
- Lee DN. A theory of visual control of braking based on information about time to collision. Perception. 1976;5:437–459. doi: 10.1068/p050437. [DOI] [PubMed] [Google Scholar]
- Lee DN, Young DS, Reddish PE, Lough S, Clayton TMH. Visual timing in hitting an accelerating ball. Quarterly Journal of Experimental Psychology. 1983;35:333–346. doi: 10.1080/14640748308402138. [DOI] [PubMed] [Google Scholar]
- Marascuilo LA. Extensions of the significance test for one-parameter signal detection hypotheses. Psychometrika. 1970;35(2):237–243. [Google Scholar]
- Northridge ME, Nevitt MC, Kelsey JL, Link B. Home hazards and falls in the elderly: The role of health and functional status. American journal of public health. 1995;58(4):509–515. doi: 10.2105/ajph.85.4.509. [DOI] [PMC free article] [PubMed] [Google Scholar]
- Regan D, Gray R. Hitting what one wants to hit and missing what one wants to miss. Vision Research. 2001;41:3321–3329. doi: 10.1016/s0042-6989(01)00068-2. [DOI] [PubMed] [Google Scholar]
- Rieger JH. Information In Optical Flows Induced By Curved Paths Of Observation. Journal of the Optical Society of America. 1983;73(3):339–344. doi: 10.1364/josa.73.000339. [DOI] [PubMed] [Google Scholar]
- Rock PB, Harris MG. τ as a Potential Control Variable for Visually Guided Braking. Journal of Experimental Psychology: Human Perception and Performance. 2006;32:251–267. doi: 10.1037/0096-1523.32.2.251. [DOI] [PubMed] [Google Scholar]
- Salgado OJ, Greenberg R. Factors associated with falling in elderly hospital patients. Gerontology. 1994;40(6):325–331. doi: 10.1159/000213607. [DOI] [PubMed] [Google Scholar]
- Savelsbergh GJP, Bootsma RJ. Perception-action coupling in hitting and catching. International journal of sport psychology. 1994;25(3):331–343. [Google Scholar]
- Schiff W, Oldak R, Shah V. Aging persons’ estimates of vehicular motion. Psychology and aging. 1992;7(4):518–525. doi: 10.1037//0882-7974.7.4.518. [DOI] [PubMed] [Google Scholar]
- Tresilian JR. Empirical and theoretical issues in the perception of time to contact. Journal of Experimental Psychology: Human Perception and Performance. 1991;17:865–876. doi: 10.1037//0096-1523.17.3.865. [DOI] [PubMed] [Google Scholar]
- Vogel K. A comparison of headway and time to collision as safety indicators. Accident analysis and prevention. 2003;35(3):427–433. doi: 10.1016/s0001-4575(02)00022-2. [DOI] [PubMed] [Google Scholar]
- Wann JP. Anticipating arrival: Is the tau margin a specious theory? Journal of experimental psychology. human perception and performance. 1996;22(4):1031–1048. doi: 10.1037//0096-1523.22.4.1031. [DOI] [PubMed] [Google Scholar]
- Weerdesteyn V, Nienhuis B, Duysens J. Advancing age progressively affects obstacle avoidance skills in the elderly. Human Movement Science. 2005;24(5):865–880. doi: 10.1016/j.humov.2005.10.013. [DOI] [PubMed] [Google Scholar]
- Yilmaz EH, Warren WH. Visual control of braking: A test of the π hypothesis. Journal of Experimental Psychology: Human Perception and Performance. 1995;21:996–1014. doi: 10.1037//0096-1523.21.5.996. [DOI] [PubMed] [Google Scholar]
- Zaal FTJM, Bootsma RJ. Advances in psychology, Vol 135: Time-to-contact. Elsevier Science Publishers B.V.; Amsterdam, Netherlands: 2004. The use of time-to-contact information for the initiation of hand closure in natural prehension. [Google Scholar]


