Abstract
We demonstrate the use of electron microscopy as a powerful characterization tool to identify and locate antibody-conjugated composite organic-inorganic (COINs) surface enhanced Raman scattering (SERS) nanoparticles on cells. U937 leukemia cells labeled with antibody CD54-conjugated COINs were characterized in their native, hydrated state using wet Scanning Electron Microscopy (SEM) and in their dehydrated state using high-resolution SEM. In both cases, the backscattered electron detector (BSE) was used to detect and identify the silver constituents in COINs due to its high sensitivity to atomic number variations within a specimen. The imaging and analytical capabilities in the SEM were further complemented by higher resolution Transmission Electron Microscope (TEM) images and Scanning Auger Electron Spectroscopy (AES) data to give reliable and high-resolution information about nanoparticles and their binding to cell surface antigens.
Keywords: SERS Nanoparticles on Cells, Scanning Electron Microscopy, Transmission Electron Microscopy, Scanning Auger Electron Spectroscopy
1. Introduction
There is increasing interest in applying “nanotechnology” for medical applications, most notably for early cancer detection and therapy [1 – 3]. This generally involves attachment of nanoparticles or nanotubes to cancer cells, followed by their detection by magnetic means, Raman spectroscopy and the like [4 – 11]. Alternatively, the nanoparticles can be used to target cancer cells by drug delivery or hyperthermia. It is therefore important to assess how, or indeed whether, the nanomaterials are attaching to the cells and direct microscopy can play a significant role in this regard. Because of the dimensions involved, electron microscopy is invaluable. This article describes the successful imaging of Composite Organic-Inorganic Nanoparticles (COINs) onto U937 leukemia cells by a variety of electron-based techniques and it is thought to be the first time this has been done.
Composite Organic-Inorganic Nanoparticles (COINs) [12, 13] represent a novel type of surface enhanced Raman (SERS) nanoparticles formed by aggregating inorganic silver nanoparticles in the presence of a chosen organic molecule with a distinct Raman fingerprint. SERS nanoparticles have previously been used for in vivo molecular imaging and targeted therapy [14–16] and are emerging as an important technology for immunodetection. This is a process whereby antibodies are conjugated to the nanoparticles and used for specific detection and localization of antigens in cells. Binding of antibody-conjugated SERS nanoparticles onto cells is detected primarily using Raman spectroscopy, which measures spectral shift of the excitation light due to inelastic scattering. The spectra intensity can be enhanced as much as 1014 to 1015 times [16] when molecules are adsorbed on rough surfaces of noble metals. SER spectra are characterized by a series of Raman shifts with narrow peak widths (~2nm) which are unique for different organic molecules, making them ideal candidates for biological applications.
In spite of its numerous advantages, SER spectroscopy has its limitations. For example, the number of antigens and their location on the cell cannot be determined from the spectra. It is also impossible to resolve the morphology and dimensions of the nanoparticles by simply analyzing their SER spectra. These missing gaps can be best addressed using tools with superior imaging capabilities. The electron microscope is of course an important tool to characterize the material-biology interface between COINs and cells due to its high spatial resolution, good depth of field and ability to resolve specimens to the (sub) nanometer level. Recent advances in this field relating to biological applications were propelled by the search for methods that best preserve structures at a state most closely approximating the native state [17, 18] and by the use of preparative chemicals that will not mask the chemical signals from the original structures [19]. In this paper, we highlight the versatility of electron-based techniques as a means to identify and localize antibody-conjugated COINs on cells. We combined various imaging and analytical capabilities in the Scanning Electron Microscope (SEM), Transmission Electron Microscope (TEM) and Scanning Auger Electron Microscope (SAM) to obtain reliable and high-resolution information about nanoparticles and their binding to cell surface antigens. To our best knowledge, this work is unprecedented for single cell assays.
2. COINs Synthesis and Cell-Labeling Experiments
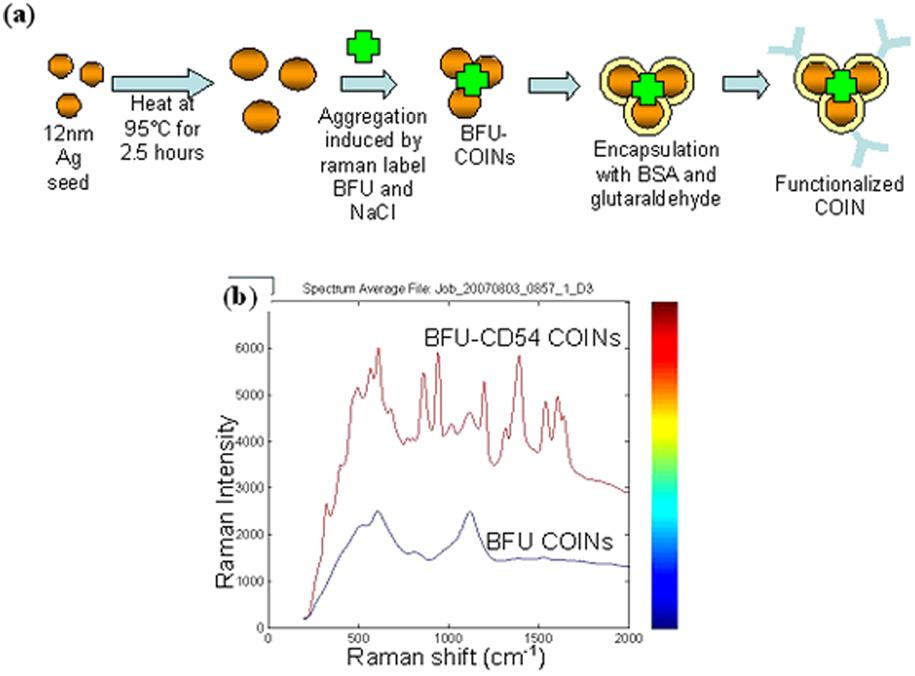
We selected the U937 cell line for our experiments. This is a monocytic leukemia with high ICAM-1 (CD54 adhesion molecule) expression on the cell surface. The COINs used in these experiments comprised inorganic silver nanoparticles prepared by reduction of silver nitrate with sodium borohydride and aggregated with organic Raman label Basic Fuchsin (BFU) [12, 13]. BFU-COINs were synthesized by aggregation in the presence of sodium chloride (NaCl) and Basic Fuchsin (BFU). Aggregates were encapsulated with Bovine Serum Albumin (BSA) and cross-linked with glutaraldehyde. At the final stage of synthesis, COINs were functionalized with CD54 antibodies (Fig. 1a) and then conjugated onto U937 cells. From the literature [20], it is known that CD54 is localized on apicolateral portions of cells. The specific and focal localization is challenging not only for fluorescence detection but also for electron microscopy detection.
Fig. 1.
(a) Diagram illustrating the synthesis process of BFU-COINs. (b) Raman spectra showing a distinct difference between U937 cells labeled with BFU-CD54 COINs and the control sample of U937 cells labeled with BFU- COINs (without antibody).
In the COIN-cell conjugation experiment, U937 cells were fixed with 2% paraformaldehyde at room temperature for 15 minutes. The fixed cells were centrifuged at 1000rpm for 6 minutes, and washed twice with staining buffers (1×Phosphate Buffered Saline (PBS) and 0.5% Bovine Serum Albumin (BSA)) to remove and replace the fixation buffer. The cells were then blocked with 1% BSA in PBS and Tween 20 (PBST) for 60 minutes at room temperature and under constant gentle rotation. The optimal COIN concentration of 0.25mM (as previously determined for single cell labeling) was added to the blocking solution. Cells were incubated with BFU-CD54 COIN at room temperature for 30 minutes. After that, the samples were washed three times by centrifugation at 1000rpm for 6 minutes and the pellet was re-suspended with PBST. After the final wash cycle, about one million cells were re-suspended in 100µl of PBS buffer. Cells were also incubated with non-antibody conjugated BFU-COIN as a negative control, to check antibody conjugated COIN binding specificity.
Specific BFU-CD54 COIN binding was first determined using Integrated Raman BioAnalyzer (IRBA) spectroscopy, the details of which will be described in another paper (C.M. Shachaf, S. Elchuri, A.L. Koh, D.J. Mitchell, J. Zhu L. Nguyen, J. Zhang, L. Sun, L.4, S. Chan, R. Sinclair, and G.P. Nolan, manuscript under review). For IRBA detection, cells were immobilized on aldehyde glass slides and scanned using a continuous wave, diode-pumped, solid-state laser with an excitation wavelength of 532nm. Single Raman spectra from a one micron2 cell surface area were collected. The Raman spectra were collected, analyzed and quantitated. U937 cells labeled with BFU-CD54 COINs show a distinct Raman spectra compared to cells labeled with non-conjugated BFU-COINs (Fig. 1b).
3. Electron Microscopy Characterization
3.1 As-Synthesized COINs
As-synthesized BFU-COINs were first analyzed using Scanning Electron Microscopy (SEM) and Transmission Electron Microscopy (TEM). SEM samples were prepared by adding 5µl of BFU-COINs onto an oxidized silicon substrate and allowing them to air-dry. They were imaged using an FEI XL30 Sirion SEM at the Stanford Nanocharacterization Laboratory at an operating voltage of 5kV. For TEM characterization, 5µl of BFU-COINs was pipetted onto an ultrathin Carbon Type-A 400-mesh TEM copper grid (Tedpella Inc., Redding, CA) that had been glow-discharged. After about ten minutes, the grid was rinsed with de-ionized water to remove any buffer salts that may be present in the samples and wicked to complete dryness with filter paper. TEM samples of negatively-stained BFU-COINs and BFU-CD54 COINs were also prepared using the same method described above, except that after the rinsing process, the grid was partially dried. Phosphotungstic acid (PTA) of pH 7.0 was then added to the grid to negatively stain the samples. TEM analysis was performed using a CM20-FEG TEM operated at 200kV in the Stanford Nanocharacterization Laboratory (SNL). It is equipped with an Energy Dispersive X-ray (EDS) spectrometer.
3.2 Characterization of BFU-CD54 COINs Conjugated onto U937 Leukemia Cells
3.2.1 WetSEM™ Specimen Preparation and Analysis
COIN-labeled cells were characterized in their native, hydrated state using Quantomix™ [17, 18]. This is a wet scanning electron microscopy (WetSEM™) technique which consists of a vacuum-tight capsule bounded by an electron-transparent polyamide membrane that completely isolates native hydrated samples from the microscope’s vacuum chamber while allowing penetration of the scanning electron beam. 15µl of samples of U937 cells labeled with CD54-conjugated BFU-COINs and the control sample of U937 cells labeled with non-antibody conjugated BFU COINs were loaded onto Quantomix™ QX-102 capsules (Electron Microscopy Sciences, Hatfield, PA) and centrifuged at 500×g for five minutes to improve adhesion between the cells and capsule membrane. They were imaged using the Hitachi S-3400N variable pressure SEM equipped with a tungsten filament, at the Cell Sciences Imaging Facility at Stanford University. The samples were imaged under high-vacuum conditions, at 30kV using the backscattered electron (BSE) detection mode.
3.2.2 SEM Dehydration and Imaging
For high-resolution scanning electron microscopy (SEM) characterization, paraformaldehyde-fixed U937 cells labeled with BFU-CD54 COINs and control samples of U937 cells labeled with BFU-COINs (no antibodies) were incubated on polylysine-coated glass cover slips for 20 minutes and dehydrated in successive concentrations of ethanol (50%, 70%, 95% and twice at 100%) with 15 minutes incubation time between each step. The samples were then critical point-dried using a Tousimis Autosamdri-814 critical point dryer (Tousimis Research Corporation, Rockville, MD). Each specimen was mounted on a SEM stub and sputter-coated with a conductive layer of AuPd. The samples were imaged using an FEI XL30 Sirion SEM at the Stanford Nanocharacterization Laboratory. It is equipped with an FEG source, secondary and backscattered imaging capabilities and an energy-dispersive X-ray spectrometer.
3.2.3 TEM Specimen Preparation
Transmission electron microscopy (TEM) samples were prepared by centrifuging 1.5ml tubes containing paraformaldehyde-fixed U937 cells with BFU-CD54 COINs and control samples of paraformaldehyde-fixed U937 cells labeled with BFU-COINs (no antibodies) at 4000 rpm for five minutes to form a pellet. The supernatant was removed and the cells were enrobed in gelatin. They were kept in a water bath at 37°C for five minutes, and then centrifuged at 4000 rpm for five minutes to concentrate the cells within the gelatin matrix. The samples were then placed on an ice bath for 15 minutes for the gelatin to solidify. They were then cut into smaller blocks of approximately 2 mm while still in the tubes, and stained in 1% osmium tetroxide in water at 4°C for one hour. This was followed by three rinse cycles with doubly-deionized water (ddH2O) at 4°C, each involving centrifuging the specimens at 4000rpm for five minutes and replacing the supernatant with ddH2O. After the third wash, the samples were re-suspended in 2% uranyl acetate in water and stained overnight at 4°C.
The samples were then dehydrated in increasing concentrations of ethanol (50%, 70% and 95%) at 4°C, with 15 minutes incubation time between ethanol changes. They were allowed to warm to room temperature gradually, and dehydrated twice with 100% ethanol (at room temperature) and once with propylene oxide with 15 minutes incubation time. For infiltration, the samples were replaced with a 1:1 solution of propylene oxide: embedding medium (Embed812 resin, Electron Microscopy Sciences, Hatfield, PA; mixture comprises 20ml of Embed 812, 16ml of Dodecenyl Succinic Anhydride (DDSA), 8ml of Nadic© Methyl Anhydride (NMA) and 1.2ml of Benzyldimethylamine (BDMA)) for one hour at room temperature. This was then replaced with a 1:2 solution of propylene oxide : embedding medium with one hour incubation time at room temperature. The mixture was removed and replaced with 100% embedding medium and left at room temperature for two hours. Embedding was done using a flat embedding mold (Electron Microcopy Sciences Catalog #70900). Each block was transferred to the mold and the mold was filled with embedding medium. The medium was cured in an oven at 60°C for at least 24 hours.
After curing, the blocks were trimmed to first expose the specimen surface. Sections of 80nm thicknesses were made using a Leica Ultracut S microtome equipped with a diamond knife, and analyzed using a CM20-FEG TEM operated at 120kV in the Stanford Nanocharacterization Laboratory (SNL).
3.2.4 Scanning Auger Electron Spectroscopy (AES)
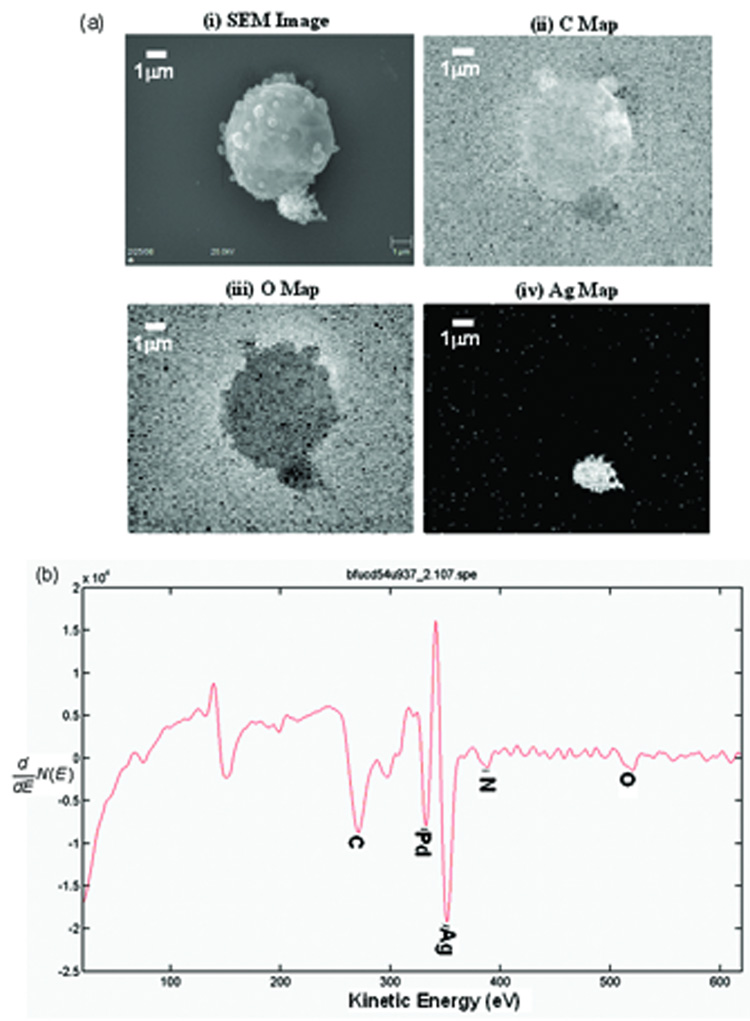
Scanning Auger Electron Spectroscopy (AES) analyses were also performed on the same samples that were used for high-resolution SEM imaging (as described in Section 3.2.2). AES data was acquired using a PHI 700 Scanning Auger Nanoprobe (Physical Electronics Inc., Chanhassen, MN) at the Stanford Nanocharacterization Lab (SNL), using an incident electron beam voltage of 20kV and a probe current of 20nA. SEM images of cells of interest, elemental maps and differentiated Auger spectra were acquired in this characterization experiment.
4. Results and Discussion
4.1 As-synthesized COINs
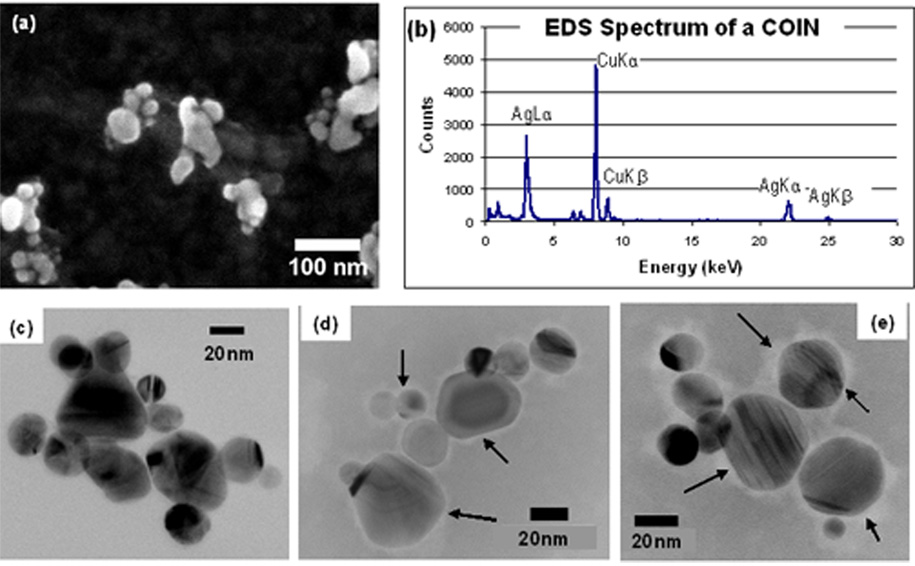
Fig. 2a shows an SEM image of several COINs clusters. Each COIN is an aggregate of smaller silver nanoparticles. Using transmission electron microscopy (TEM), the average dimension of BFU-COINs, defined as the geometric mean measured along the long axis and corresponding orthogonal short axis of each COIN, is determined to be about 100 nm. The average number of silver nanoparticles per COIN is 12, but can vary anywhere between 1 and 30. The silver constituent in COINs was verified by EDS (Fig. 2b). The additional peaks are copper X-ray lines from the TEM grid.
Fig. 2.
(a) SEM image of BFU-COINs revealing that they are composed of aggregates of smaller particles. (b) EDS spectrum of a COIN cluster which shows that the inorganic constituents are silver. Additional peaks are from the TEM copper grid. (c) TEM bright field (BF) image of BFU-COINs which shows diffraction contrast typical of crystalline solids. (d) TEM bright field (BF) image of BFU-COINs negatively stained with Phosphotungstic Acid (PTA) at pH 7.0. The organic components (indicated by arrows) appear as light halos surrounding the inorganic silver nanoparticles. (e) TEM bright field (BF) image of BFU-COINs functionalized with CD54 antibodies, negatively stained with Phosphotungstic Acid (PTA) at pH 7.0. There is an increase in the size of the halos in (e) compared to (d)., as indicated by the arrows in the two images. Images (c) to (e) were taken under the same operating conditions and a small (20 µm) objective aperture was used to enhance contrast in all cases.
We experimented with the technique of negative staining [21 – 24] to investigate possible differences in the COINs before and after antibody-functionalization. Figs. 2(c) to (e) are representative TEM bright field (BF) images of an as-synthesized BFU-COIN (without stain), as-synthesized BFU-COIN that has been negatively stained with Phosphotungstic Acid (PTA) at pH 7.0, and a BFU-COIN functionalized with CD54 antibodies negatively stained with PTA at pH 7.0. These images were taken under the same operating conditions and a small (20 µm) objective aperture was used to enhance contrast in all cases. Regular TEM BF images of COINs without stain, such as the one in Fig. 2c, shows diffraction contrast typical of crystalline materials. The negatively-stained COIN sample (Fig. 2d) shows light halos (indicated by arrows) around the inorganic silver nanoparticles. The size of the halos (indicated by arrows) appears to increase after CD54-antibody functionalization, as observed in the TEM BF image in Fig. 2e. Images of at least ten COIN clusters from each sample show similar results. The negative staining experiments were also repeated using at least three different batches of COINs, before and after antibody-functionalization, and the increase in halo sizes after antibody-functionalization was observed in all these experiments. This leads us to conclude that the increase in halo sizes may be attributed to successful functionalization of COINs with antibodies. We have since carried out EFTEM imaging to show the carbon distribution, which confirms our interpretation but which we feel is relevant to a future article (A.L. Koh, M. Watanabe and R. Sinclair, manuscript in preparation).
4.2 COIN-Labeled Cells
4.2.1 SEM localization of BFU-CD54 COINs on cells
To locate the BFU-CD54 COINs on U937 cells, two SEM techniques using backscattered electron (BSE) detection were employed: wet scanning electron microscopy (WetSEM™) of native, hydrated cell samples and conventional SEM imaging of dehydrated cells. BSE detection was found to be an effective tool in detecting the inorganic (silver) components in COINs as the backscattered electron intensity increases with atomic number (Z).
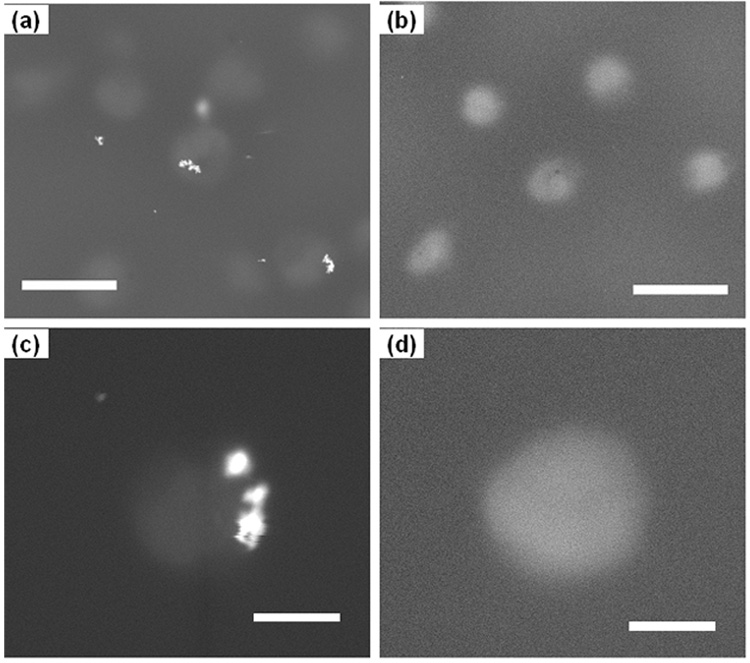
The hydrated samples were completely sealed by capsules and protected from the high vacuum conditions of the SEM. Therefore, low vacuum operation was not necessary for imaging. We operated the SEM at 30kV using the backscattered electron (BSE) detection mode. The COINs appear as bright spots against a relatively dark background due to the differences in scattering between the low Z components from the organic cells and the high Z components from the silver COIN clusters (Fig. 3a). BFU-CD54 COINs exhibit high intensity relative to the cells due to the presence of the silver constituent. This contrast differential was not observed in the control sample of U937 cells labeled with non-antibody conjugated BFU-COINs (Fig. 3b). This suggests that COINs without antibodies do not bind to the cells. Figs. 3c and 3d show SEM images of individual cells. The BFU-CD54 COINs is observed to localize to a single area on the cell and not disperse on the surface. This is consistent with reports from the literature [20], indicating that binding between BFU-CD54 COINs and U937 cells is specific. From the WetSEM™ images, about one out of ten cells have COINs attached to them. This data was tabulated by counting 100 cells from each sample.
Fig. 3.
Scanning electron micrographs of hydrated U937 cells sealed in Quantomix™ capsules and imaged using the backscattered electron (BSE) detection mode at 30kV: (a) Binding between U937 cell surfaces and BFU-CD54-conjugated COINs and (b) the control sample in which no COIN is detected. (c) Higher magnification SEM image detailing binding of BFU-CD54 COIN on the U937 cell surface and (d) a U937 cell in the control sample. The scale bars are 10µm for (a) and (b) and 2µm for (c) and (d).
The BSE detector is useful for localizing COINs on cells due to its high sensitivity to atomic number differences. Another key strength of the SEM is its high depth of field and superior topographical contrast obtained from low-energy (<50 eV) secondary electrons (SEs) emitted from sample surfaces. However, the low energy SEs cannot penetrate the wet-cell membrane so they must be observed in the standard vacuum environment of the SEM. This necessitates the additional processes of dehydrating the specimens whilst maintaining structural preservation. U937 cells labeled with BFU-CD54 COINs and BFU-COINs (control) were adhered to polylysine-coated glass cover slips, dehydrated in increasing concentration of ethanol, and then critical point dried. The cover slips were then affixed onto SEM specimen mounts and sputter-coated with a conductive layer of AuPd of approximately 5nm in thickness. The dehydrated samples were imaged using an FEI XL30 Sirion SEM at the Stanford Nanocharacterization Laboratory. It is equipped with a field emission gun (FEG) source and so has superior resolution compared to the tungsten-gun SEM above.
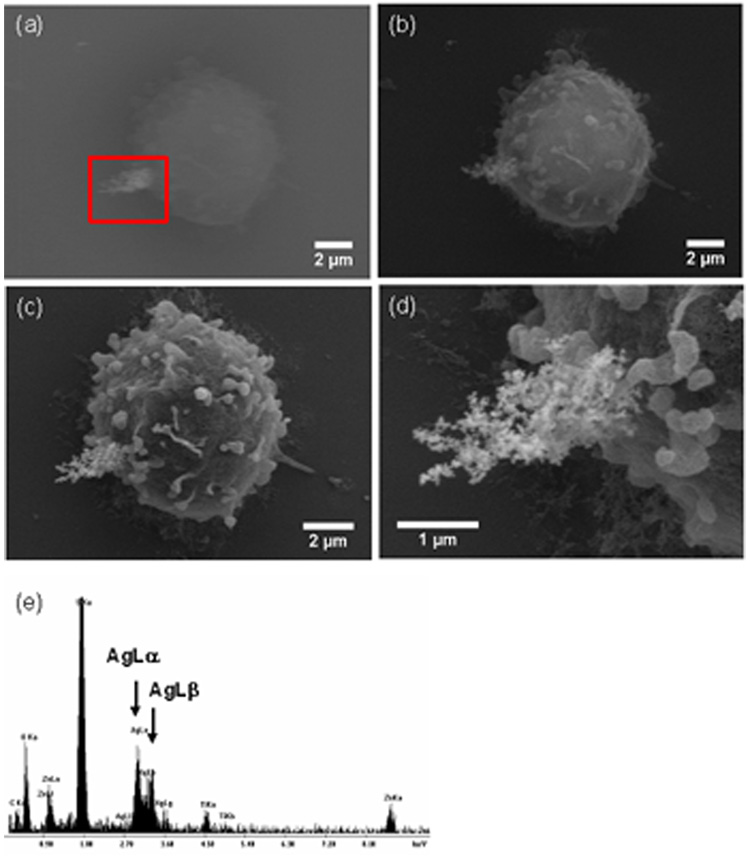
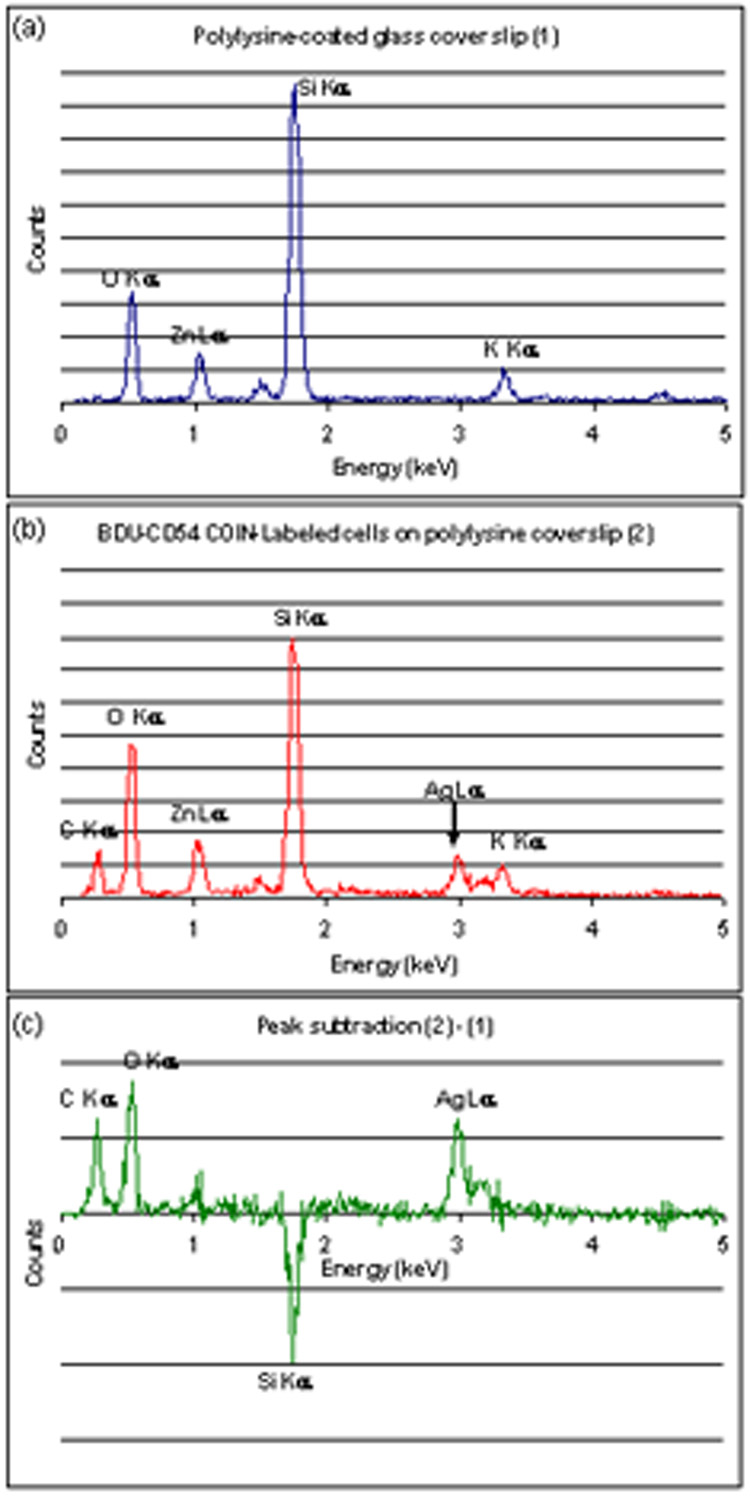
To identify the BFU-CD54 COINs on the dehydrated samples, we relied on the BSE detector for atomic contrast differences. Fig. 4a shows an SEM image of a dehydrated U937 cell at 20kV in the BSE mode. The BFU-CD54 COIN appears bright on the apical area of the cell, at the lower left of the image (marked with a box). The contrast obtained from the cell was minimal as the latter is composed of low atomic number elements which do not scatter electrons sufficiently. We switched to the secondary electron (SE) detector for increased topographical contrast. At 20kV in SE mode (Fig. 4b), we began to make out the morphological features of the sample. At a lower operating voltage of 5kV (Fig. 4c), the structural details of the cell became even more prominent due to less beam penetration (i.e. lower background) at lower operating voltages. The structural details of the cell and COIN are clearly visible in this image. A higher magnification SEM image showing the binding site of BFU-CD54 COINs on a U937 cell is presented in Fig. 4d. We also used Energy Dispersive X-ray Spectrometry (EDS) to confirm that the high elemental contrast originated from the COIN. The EDS spectrum shows AgL X-rays from the inorganic silver COINs (Fig. 4e). The other signals are from the polylysine-coated glass cover slips (see Fig. 1 in Appendix). Images of about 20 COIN-labeled cells showed equivalent results.
Fig. 4.
SEM images of BFU-CD54 COINs conjugated on U937 monocytic leukemia cell imaged using (a) backscattered electron (BSE) detector at 20kV showing the differences in contrast between COINs (at lower left of image) and cell; (b) corresponding secondary electron (SE) image at 20kV; (c) SE image at 5kV. This image taken at lower kV exhibits improved topographical contrast; (d) Higher magnification SEM image at 5kV showing the COINs; (e) Energy-Dispersive X-ray spectrum where the AgL lines confirm the presence of COINs. The cells were dehydrated with ethanol, critical point dried and sputtered with a thin layer of gold-palladium. Extra X-ray lines are from the glass slide. These SEM images are representative of the many that were obtained.
Appendix Fig. 1.
EDS spectra of (a) Polylysine-coated glass cover slip; (b) BFU-CD54 COINs on a cell and (c) the difference spectrum. The AgL X-rays from the COINs and carbon and oxygen signals from the cell are quite clear in the latter. The spectra were obtained using the FEI XL30 Sirion SEM in the Stanford Nanocharacterization Laboratory.
COIN-cell binding statistics were also obtained from SEM-BSE images of the dehydrated samples. By counting at least 300 cells each from the experimental and control samples, the percentage of cells with COINs bound onto them are 17% and 5% respectively.
4.2.2 Comparison of SEM Methods
Two SEM techniques to image immuno-localized COINs on cells are presented in this manuscript. Whilst the WetSEM™ technique provided a simple and convenient means to image fully-hydrated samples with resolution better than optical methods [18], its resolution falls short of that obtainable in modern high resolution SEMs. This can be attributed to a few reasons. Firstly, imaging hydrated samples in a sealed capsule requires higher accelerating voltages using BSE detection mode so that the electrons can penetrate the membrane and liquid containing the cells, and so suffer significant scattering from the wet environment. Secondly, the objective lens aberrations are not as good as those in a high resolution SEM resulting in more blurred images. Thirdly, the signal-to-noise limitation is more severe in a tungsten filament SEM compared to a FEG SEM. Moreover, cell surface topography using SEs was not possible because of absorption by the capsule membrane which had a thickness of about 140nm. To localize the actual binding, there is clearly a need for additional specimen preparation steps that would allow the COIN-labeled cells to preserve their structural integrity and stability under high vacuum conditions. At the same time, the use of fixatives containing heavy elements (such as osmium tetroxide and uranyl acetate) that might mask the silver signals from the COINs should be avoided. To meet these criteria, heavy metal stains that are traditionally used to fix and stain biological specimens were deliberately eliminated, even though it was suggested in the literature that they could stabilize certain cellular components and make the latter more resistant to the damage caused by the electron beam [21].
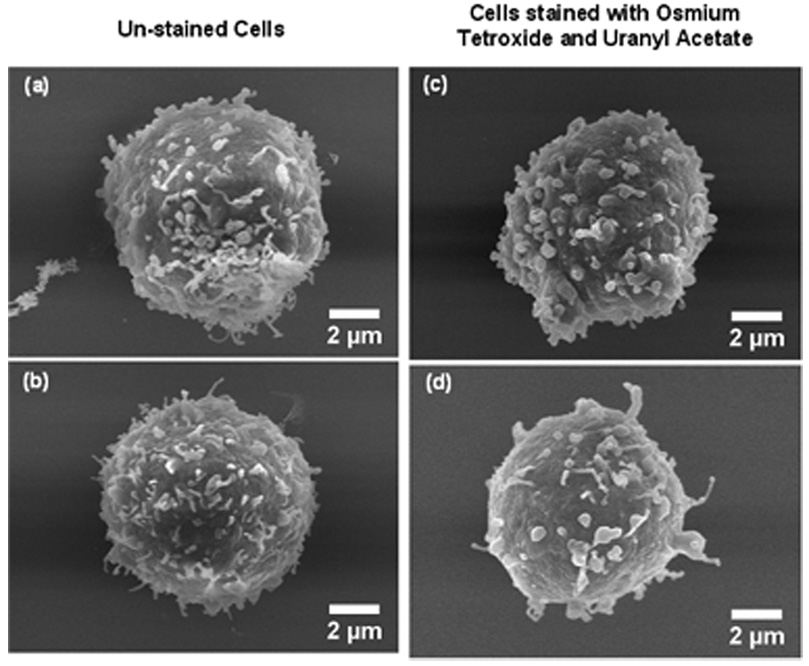
Even without the heavy metal stains, we did not find any significant difference between the stained and unstained cells in terms of structural preservation (Fig. 2 in Appendix). SEM measurements of 100 cells each from unstained and heavy metal-stained samples show minimum difference between the average diameter of the unstained cells (8.2 ± 0.8 µm (9.4%)) and those that had been stained with osmium tetroxide and uranyl acetate (8.7 ± 0.9 µm (10.6%)).
Appendix Fig. 2.
SEM secondary electron (SE) images of cells dehydrated without stain (Figs. 2a and 2b) and stained with osmium tetroxide and uranyl acetate (Figs. 2c and 2d). Good structural preservation is obtained even for cells without the use of heavy metal stains.
Another drawback of the WetSEM™ approach is that it also requires cells to be as close to the capsule membrane as possible in order to be visualized. On the other hand, all dehydrated cells that adhere onto the glass coverslips can be examined using high-resolution SEM. The latter is advantageous because it gives larger sample sizes and therefore more accurate statistics in COIN-cell binding quantification. As reported in the previous section, from counting 100 cells each from the experimental and control samples, the percentages of COINs bound onto cells determined by WetSEM™ are 10% and 1% respectively. From the dehydrated cell samples, the numbers obtained are 17% and 5% by counting at least 300 cells per sample. We believe the binding statistics are more accurate using the latter method in consideration of the larger sample sizes involved.
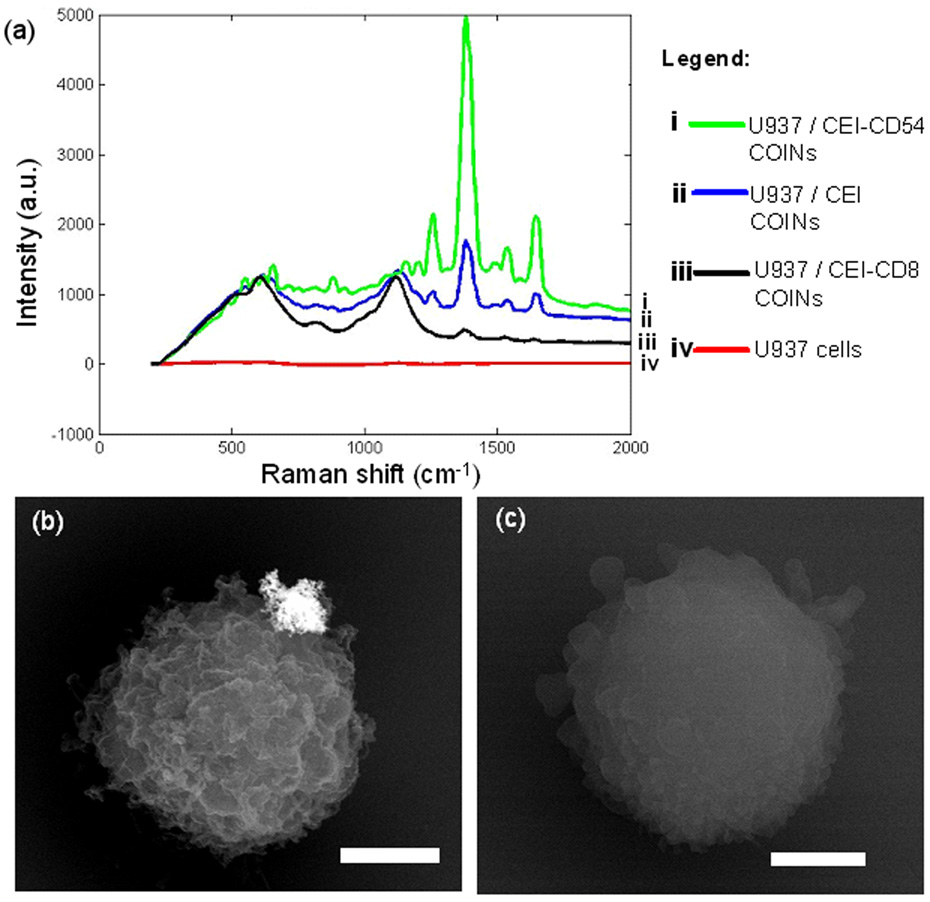
Binding specificity between CD54-COINs and U937 cells was also determined by using COINs synthesized with a different Raman label and by including a negative control. In this validation test, COINs with Raman label 1,1'-diethyl-2,2'-cyanine iodide (thereafter termed “CEI-COINs”) were synthesized using the same method as BFU-COINs. CEI-COINs functionalized with antibodies CD54 and CD8, and the control comprising CEI-COINs without antibody, were labeled onto U937 cells using the same protocol described in Section 2. The second sample is a negative control because U937 cells do not express CD8 antigen (determined from flow cytometry studies) and so CEI-COINs functionalized with CD8 antibodies should not bind onto the cells. Fig. 3a in the Appendix shows the SER spectra from this set of experiments. At the characteristic Raman shift of 1378cm−1, the spectrum is most intense for the cells labeled with CEI-CD54 COINs, and decreases for the control sample of CEI-COINs and CEI-CD8 COINs respectively. Cells labeled with CEI-CD8 COINs exhibit lower SER intensity than the control sample because antibody functionalization modifies the surface charges of the COINs and so reduces their affinity to bind non-specifically onto cell surfaces. Hence COIN-cell binding specificity is verified.
Appendix Fig. 3.
(a) SER spectra of U937 cells labeled with (i) CEI-CD54 COINs; (ii) CEI COINs (control), (iii) CEI-CD8 COINs (negative control) and (iv) cells only. The intensity decreases in the order from (i) to (iV), suggesting that binding is specific. (b) SEM BSE image taken at 20 kV showing a CEI-CD54 COIN bound onto a specific region on the U937 cell. (c) SEM BSE image taken at 20 kV showing a U937 cell in the control sample. The scale bars in (b) and (c) denote 2 µm.
SEM-BSE images of dehydrated cell samples from this experiment also show that CEI-CD54 COINs are localized on a specific region of the U937 cell (Fig. 3b in Appendix). This is consistent with our earlier observations about BFU-CD54 COINs on the same cell line. Fig. 3c in the Appendix is a representative SEM-BSE image of most of the cells in the other two (control and negative control) samples where there is no COIN attached. By counting at least 200 cells in each sample, the COIN-cell binding statistics in this experiment are determined to be 18%, 7% and 5% for CD54-CEI COINs, COINs without antibody (control) and CD8-CEI COINs (negative control) respectively.
4.2.3 Comparison with TEM methods
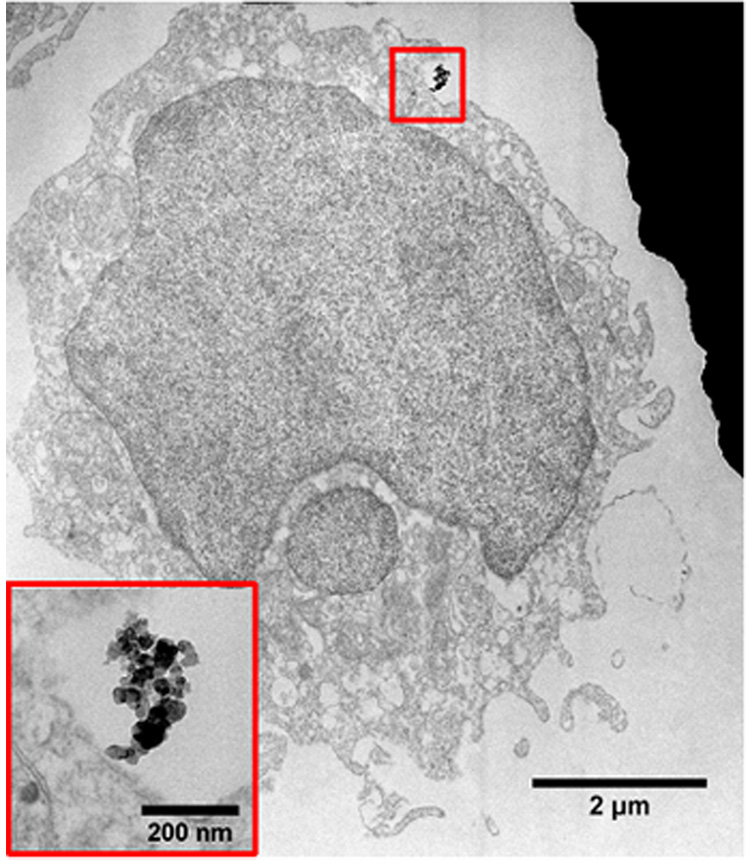
Transmission electron microscopy (TEM) is the alternative technique to characterize nano-materials owing to its ability to resolve specimens to the sub-nanometer level. Traditional biological applications of TEM include ultrastructure analyses of tissues, cells and micro-organisms. Recent developments in nanoparticles for biomedical applications have also led to the TEM being employed to evaluate, for example, the cellular uptake of nanoparticles on cells [25 – 27]. To compare this method with the SEM techniques described above, we also utilized the TEM to locate BFU-CD54 COINs on U937 cells. Samples were post-fixed, stained, dehydrated, embedded and sectioned (see Methods section) for TEM analysis. Fig. 5 shows a bright field TEM image of a sectioned U937 cell with a BFU-CD54 COIN bound on the apical region. The inset shows a higher magnification image of the COIN. From the image, the cell appears to have a large nucleus, and filapodic features that are characteristic of lymphocytes are well-preserved. As there is only one region that expresses biomarker CD54, localizing BFU-CD54 COINs on U937 cell sections is tedious and challenging. The yield, using TEM, is low. Each section consists of multiple (at least five) cells, but typically only one cell in twenty sections is observed to contain a COIN. Therefore, the SEM methods described above are more efficient in locating the biomarker CD54 expression site on the cell.
Fig. 5.
TEM bright field image of a sectioned U937 cell showing a BFU-CD54 COIN labeled on the cell surface. The inset shows a higher magnification image of the COIN.
There is a noticeable difference between the TEM and SEM images. This arises due to differences in image formation principles and hence their requirements on specimen thicknesses. TEM imaging requires the cells to be sectioned so that they are thin enough (<100 nm) for electrons to be transmitted through to form an image. Hence, TEM images (such as those shown in Fig. 5) reveal the cell ultrastructure, COIN structure and the binding site in greater detail. On the other hand, contrast in an SEM image depends on topographical and elemental differences in the specimens with a large depth of field and almost no limitation in specimen thickness. Therefore, cells can be imaged in their entirety in an SEM. The latter is also advantageous in that it allows us to gain insight into the intermediate experimental steps. As described previously, the average dimension of the as-synthesized BFU-COINs is about 100 nm. However, in the dehydrated cell samples, the BFU-CD54 COINs appear to be in clusters much larger than their as-synthesized dimensions. One possible for the size difference may be due to aggregation of the COIN assay during the antibody-conjugation and labeling processes. Another possibility may be the presence of several CD54 antigen-expressing sites on the U937 cells which are all localized on its apicolateral portion. Thus, COINs appear to form large clusters because there are a number of them binding in a specific region. At this point, however, reasons for the apparent formation of larger COIN aggregates are not known due to the lack of information on the number of CD54 surface antigens and their distribution on the U937 cells. Nonetheless, the difference in COIN structure and dimensions could only be observed using imaging techniques such as the SEM, where the specimens are imaged whole (i.e. un-sectioned). It is therefore important that multiple characterization techniques be employed to give complementary information.
As in the SEM, it is also possible for cells to be observed in their native, hydrated state under the TEM. This requires the use of cryo-TEM specimen preparation techniques. There have been reports on the use of cryo-TEM techniques to study aggregation effects on nanoparticles [28], cell structure [29 – 31] but not nanoparticle-conjugated cells which is the focus of this paper. The use of cryo-TEM techniques is beyond the scope of this present study. However, this method can be used to good effect as a possible future work to compare the preservation of cell structure and antigenicity of biomolecules in the cells.
4.2.4 Scanning Auger Spectroscopy (AES) Analyses
Since BFU-CD54 COINs bind onto the exterior of U937 cells, we also attempted to characterize the samples using Auger Electron Spectroscopy (AES). This is a surface-sensitive technique whereby a primary electron beam is used to probe the surface of a solid material. The energy of the emerging electrons is determined by the differences in binding energies associated with the de-excitation of an atom as it re-arranges its electron shells and emits (Auger) electrons with characteristic energies. The identity and quantity of the elements are determined from the kinetic energy and intensity of the Auger peaks. Surface sensitivity in AES arises from the fact that emitted electrons usually have energies ranging from 50eV to 3keV and can only escape from the outer 5 to 50Å of a solid surface at their characteristic energy. Auger electron transitions generally appear as small features superimposed on the large background of secondary electrons [32]. The usual practice is to use derivative techniques and generate a function, where N(E) denotes the number of electrons as a function of kinetic energy E.
Fig. 6(a(i)) shows an secondary electron image of a dehydrated U937 cell from the samples that had been labeled with BFU-CD54 COINs. This image was acquired using the PHI 700 Scanning Auger Nanoprobe. Figs. 6a(ii)–(iv) are elemental maps showing the distribution of carbon, oxygen and silver elements on the cell. The latter confirms the attachment of the silver-rich COINs onto the cell. From these maps, one can infer that regions where COINs are found correspond to lower intensities of the C and O signals. This is consistent with what one would expect. Figure 6(b) shows the corresponding differential Auger spectrum that confirms the presence COINs on the cell. The Pd peak is also present because the sample had been sputter-coated with a conductive layer of AuPd to reduce charging effects.
Fig. 6.
Scanning Auger Electron Spectroscopy data of BFU-CD54 COINs on a U937 cell. (a) (i) Secondary electron image and elemental maps showing the distribution of (ii) carbon, (ii) oxygen and (ii) silver of BFU-CD54 COINs attached on a U937 cell. (b) Corresponding differentiated Auger spectrum confirming the presence of silver COINs on the cell.
One of the most common limitations in AES is the charging effect on non-conducting samples. Because of its high surface sensitivity, coatings used to reduce sample charging for other electron beam-based techniques are typically not employed in AES as they may occupy the entire sampling depth and the samples cannot be analyzed [33]. However, in the case of our biological specimens, it was necessary to sputter-coat the latter with AuPd because of severe charging issues associated with these highly insulating samples. In spite of the presence of the additional coating, we were still able to detect silver signals from the COINs on the cells and derive elemental maps showing the distribution of key elements. This finding came as a surprise and also gave us the confidence to conclude that the thickness of the AuPd coating is less than 50Å. We also demonstrated that Scanning Auger Spectroscopy can potentially be used as a characterization tool for the biological sciences community.
4.2.5 Comparison of electron microscopy-based characterization and labeling techniques
In this paper, a number of electron microscopy -based techniques to identify and localize antibody-conjugated COINs on cells are discussed. Each method yields complementary information about the nanoparticles, cell structures and the binding of nanoparticles onto cells, and should be utilized to their maximum effect whenever necessary. When time is a limiting factor, high-resolution SEM techniques are favored due to the relative short specimen preparation time and the ability to achieve high resolution information about nanoparticles and their binding onto cell surfaces. For possible changes in cell ultrastructure, TEM observations of sectioned samples will be paramount.
It is also worth comparing the utilization of COINs as extra-cellular labels against currently available immuno-gold or immuno-silver labeling techniques. COINs are similar to the latter in terms of electron density. Moreover, they have an added advantage because the introduction of Raman labels during the synthesis process cause them to exhibit enhanced SER intensity which can be employed in the Raman bio-detection platform. On the other hand, currently available antibody-conjugated gold or silver immunolabels cannot be used in bio-detection because of the lack of Raman reporter molecules in these nanoparticles [34]. Thus, we believe that the use of COINs to detect cell surface antigens is a superior approach compared to current immuno-labeling techniques.
5. Conclusion
We have demonstrated the versatility of the electron microscope (EM) as a powerful means to detect antibody CD54-functionalized COINs conjugated on U937 cells. With careful specimen preparation, it is possible to utilize the different detection modes of the microscope to give reliable and high-resolution information about how nanoparticles target biomarkers. The conjugation of antibodies to COINs not only provides the ability to quantitatively measure the analyte using Raman spectroscopy, but the presence of heavy elements from the silver constituents of the COINs allows them to be detected using the SEM BSE detector. We obtained reliable and high-resolution information about antibody CD54-conjugated COINs and their binding to complementary antigens on U937 cells. The imaging and analytical capabilities in the SEM were further complemented by higher resolution Transmission Electron Microscope (TEM) images and Scanning Auger Electron Spectroscopy (AES) data to give reliable and high-resolution information about antibody-conjugated nanoparticles and their specific binding to complementary cell surface antigens.
Acknowledgements
This work was supported by the Center for Cancer Nanotechnology Excellence focused on Therapy Response (CCNE-TR) Grant NIH U54, Nanyang Technological University (Singapore) Overseas Scholarship (A.L.K.) and FAMRI - Young Clinical Scientist Award (C.M.S.). The authors would like to thank Mr. Chuck Hitzman from the Stanford Nanocharacterization Laboratory for assistance with Scanning Auger Electron Spectroscopy, and Mr. John Perrino and Dr. Lydia Marie-Joubert from the Cell Sciences Imaging Facility, Stanford Medical School, for helpful discussions on biological specimen preparation.
Footnotes
Publisher's Disclaimer: This is a PDF file of an unedited manuscript that has been accepted for publication. As a service to our customers we are providing this early version of the manuscript. The manuscript will undergo copyediting, typesetting, and review of the resulting proof before it is published in its final citable form. Please note that during the production process errors may be discovered which could affect the content, and all legal disclaimers that apply to the journal pertain.
PACS: 81.07.-b; 87.85.Rs; 87.19.xj
References
- 1.Ferrari M. Nat. Rev. Cancer. 1995;5:161. doi: 10.1038/nrc1566. [DOI] [PubMed] [Google Scholar]
- 2.Whitesides GM. Nat. Biotechnol. 2003;21:1161. doi: 10.1038/nbt872. [DOI] [PubMed] [Google Scholar]
- 3.Service RF. Science. 2005;310:1132. doi: 10.1126/science.310.5751.1132. [DOI] [PubMed] [Google Scholar]
- 4.Lewin M, Carlesso N, Tung C-H, Tang X-W, Cory D, Scadden DT, Weissleder R. Nat. Biotechnol. 2000;18:410. doi: 10.1038/74464. [DOI] [PubMed] [Google Scholar]
- 5.Maier-Hauff K, Rothe R, Scholz R, Gneveckow U, Wust P, Thiesen B, Feussner A, von Deimling A, Waldoefner N, Felix R, Jordan A. J Neurooncol. 2007;81:53. doi: 10.1007/s11060-006-9195-0. [DOI] [PubMed] [Google Scholar]
- 6.Liu Z, Sun X, Nakayama N, Dai H. ACS Nano. 2007;1:50. doi: 10.1021/nn700040t. [DOI] [PubMed] [Google Scholar]
- 7.Brigger I, Dubernet C, Couvreur P. Adv. Drug Delivery Rev. 2002;54:631. doi: 10.1016/s0169-409x(02)00044-3. [DOI] [PubMed] [Google Scholar]
- 8.Loo C, Lowery A, Halas N, West J, Drezek R. Nano Lett. 2005;5:709. doi: 10.1021/nl050127s. [DOI] [PubMed] [Google Scholar]
- 9.Brannon-Peppas L, Blanchette JO. Adv. Drug Delivery Rev. 2004;56:1649. doi: 10.1016/j.addr.2004.02.014. [DOI] [PubMed] [Google Scholar]
- 10.Bianco A, Kostarelos K, Partidos CD, Prato M. Chem Commun. 2005:571. doi: 10.1039/b410943k. [DOI] [PubMed] [Google Scholar]
- 11.Kam NWS, O’Connell M, Wisdom JA, Dai H. Proc Natl Acad Sci USA. 2005;102:11600. doi: 10.1073/pnas.0502680102. [DOI] [PMC free article] [PubMed] [Google Scholar]
- 12.Su X, Zhang J, Sun L, Koo T-W, Chan S, Sundararajan N, Yamakawa M, Berlin AA. Nano Lett. 2004;5:49. doi: 10.1021/nl0484088. [DOI] [PubMed] [Google Scholar]
- 13.Sun L, Sung K-B, Dentinger C, Lutz B, Nguyen L, Zhang J, Qin H, Yamakawa M, Cao M, Lu Y, Chmura AJ, Zhu J, Su X, Berlin AA, Chan S, Knudsen B. Nano Lett. 2007;7:351. doi: 10.1021/nl062453t. [DOI] [PubMed] [Google Scholar]
- 14.Qian X, Peng X-H, Ansari DO, Yin-Goen Q, Chen GZ, Shin DM, Yang L, Young AN, Wang MD, Nie S. Nat. Biotechnol. 2008;26:83. doi: 10.1038/nbt1377. [DOI] [PubMed] [Google Scholar]
- 15.Cao YC, Jin R, Mirkin CA. Science. 2002;297:1536. doi: 10.1126/science.297.5586.1536. [DOI] [PubMed] [Google Scholar]
- 16.Nie S, Emory SR. Science. 1997;275:1102. doi: 10.1126/science.275.5303.1102. [DOI] [PubMed] [Google Scholar]
- 17.Thiberge S, Nechushtan A, Sprinzak D, Gileadi O, Behar V, Zik O, Chowers Y, Michaeli S, Schlessinger J, Thiberge EM. Proc. Natl. Acad. Sci. USA. 2004;101:3346. doi: 10.1073/pnas.0400088101. [DOI] [PMC free article] [PubMed] [Google Scholar]
- 18.Thiberge S, Zik O, Moses E. Rev. Sci. Instrum. 2004;75:2280. [Google Scholar]
- 19.Goldstein J, Newbury D, Joy D, Lyman C, Echlin P, Lifshin E, Sawyer L, Michael J. Scanning Electron Microscopy and X-Ray Microanalysis. Third Edition. NY: Springer Science + Business Media; 2003. p. 610. [Google Scholar]
- 20.Vignola AM, Chanez P, Campbell AM, Pinel AM, Bousquet J, Michel F-B, Godard PH. Clin. Exp. Immunol. 1994;96:104. doi: 10.1111/j.1365-2249.1994.tb06238.x. [DOI] [PMC free article] [PubMed] [Google Scholar]
- 21.Hayat MA. Principles and Techniques of Electron Microscopy – Biological Applications. Fourth Edition. NY: Cambridge University Press; 2000. p. 243. [Google Scholar]
- 22.Hayat MA, Miller SE. Negative Staining. Mc-Graw Hill Publishing Company; 1990. pp. 1–5. [Google Scholar]
- 23.Massover WH. Microsc. Microanal. 2008;14:126. doi: 10.1017/S1431927608080033. [DOI] [PubMed] [Google Scholar]
- 24.Bremmer A, Henn C, Engel A, Baumeister W, Aebi U. Ultramicroscopy. 1992;46:85. doi: 10.1016/0304-3991(92)90008-8. [DOI] [PubMed] [Google Scholar]
- 25.Dixit V, Bossche J, Sherman DM, Thompson DH, Andres RP. Bioconjugate Chem. 2006;17:603. doi: 10.1021/bc050335b. [DOI] [PubMed] [Google Scholar]
- 26.Billotey C, Wilhelm C, Devaud M, Bacri JC, Bittoun J, Gazeau F. Magn. Reson. Med. 2003;49:646. doi: 10.1002/mrm.10418. [DOI] [PubMed] [Google Scholar]
- 27.Limbach LK, Li Y, Grass RN, Brunner TJ, Hintermann MA, Muller M, Gunther D, Stark WJ. Environ. Sci. Technol. 2005;39:9370. doi: 10.1021/es051043o. [DOI] [PubMed] [Google Scholar]
- 28.Butter K, Bomans PHH, Frederik PM, Vroege GJ, Philipse AP. Nat. Mater. 2003;2:88. doi: 10.1038/nmat811. [DOI] [PubMed] [Google Scholar]
- 29.Hayat MA. Principles and Techniques of Electron Microscopy – Biological Applications. Fourth Edition. NY: Cambridge University Press; 2000. pp. 400–401. [Google Scholar]
- 30.Adrian M, Dubochet J, Lepault J, McDowall AW. Nature. 1984;308:32. doi: 10.1038/308032a0. [DOI] [PubMed] [Google Scholar]
- 31.Al-Amoudi A, Norlen LPO, Dubochet J. J. Struct. Biol. 2004;148:131. doi: 10.1016/j.jsb.2004.03.010. [DOI] [PubMed] [Google Scholar]
- 32.Feldman LC, Mayer JW. Fundamentals of Surface and Thin Film Analysis. North-Holland, Amsterdam: 1986. p. 269. [Google Scholar]
- 33.Prutton M, El Gomati MM. Scanning Auger Electron Microscopy. England: John Wiley & Sons Ltd; 2006. p. 333. [Google Scholar]
- 34.Park H-Y, Driskell JD, Kwarta KM, Lipert RJ, Porter MD, Schoen C, Neill JD, Ridpat JF. Surface-Enhanced Raman Scattering – Physics and Applications. In: Kneipp K, Moskovits M, Kneipp H, editors. Topics Appl. Phys. Vol. 103. Springer-Verlag Berlin Heidelberg; 2006. p. 427. [Google Scholar]


