

Abstract
Introduction
As pulmonary artery obstruction results in proliferation of the bronchial circulation in a variety of species, we investigated this angiogenic response using single photon emission computed tomography (SPECT) and micro-CT.
Materials and methods
After surgical ligation of the left pulmonary artery of rats, they were imaged at 10, 20, or 40 days post-ligation. Before imaging, technetium-labeled macroaggregated albumin (99mTc MAA) was injected into the aortic arch (IA) labeling the systemic circulation. SPECT/micro-CT imaging was performed, the image volumes were registered, and activity in the left lung via the bronchial circulation was used as a marker of bronchial blood flow. To calibrate and to verify successful ligation, 99mTc MAA was subsequently injected into the left femoral vein (IV), resulting in accumulation within the pulmonary circulation. The rats were reimaged, and the ratio of the IA to the IV measurements reflected the fraction of cardiac output (CO) to the left lung via the bronchial circulation. Control and sham-operated rats were studied similarly.
Results
The left lung bronchial circulation of the control group was 2.5% of CO. The sham-operated rats showed no significant difference from the control. However, 20 and 40 days post-ligation, the bronchial circulation blood flow had increased to 7.9 and 13.9%, respectively, of CO. Excised lungs examined after barium filling of the systemic vasculature confirmed neovascularization as evidenced by tortuous vessels arising from the mediastinum and bronchial circulation.
Conclusion
Thus, we conclude that SPECT/micro-CT imaging is a valuable methodology for monitoring angiogenesis in the lung and, potentially, for evaluating the effects of pro- or anti-angiogenic treatments using a similar approach.
Keywords: Lung, Bronchial blood flow, Neovascularization, Postobstructive pulmonary vasculopathy, Dual-modality imaging
Introduction
The bronchial circulation provides an oxygenated blood supply to the airway walls, the airway epithelium, the mucous and serosal glands, and the lymph nodes in the lung parenchyma [1]. But besides its normal function, the vessels of the bronchial circulation can play an important role in various pathologies of the lung, partly because they can effectively form anastomoses with the pulmonary precapillary microvessels, such as may occur with congenital heart disease and pulmonary edema [2] or pulmonary arterial occlusion and embolism [3, 4]. Furthermore, it has been shown that primary bronchogenic carcinomas and bronchial adenomas derive a significant portion of their blood supply from the bronchial circulation [5-8] and that blood flow within the bronchial circulation is correspondingly increased [9]. As tumor regression has been observed after infusion of chemotherapeutic agents directly into the bronchial circulation, cancer therapies using antiangiogenic drugs are being developed to limit blood flow by inhibiting the development of the bronchial circulation [10, 11]. Thus, the establishment of suitable protocols for delivery of these agents depends in part on an understanding of the development of the bronchial circulation supplying the tumor.
One common model for initiation of bronchial angiogenesis is the ligation of a pulmonary artery. After ligation of the left pulmonary artery (LPA), the bronchial circulation of the left lung has been shown to develop in sheep [3], dogs [10-14], rats [15-18], and mice [19, 20] in an attempt to compensate for the lack of perfusion via the pulmonary circulation. Commonly, ligation of the LPA has been used because it is generally more accessible than the right lung, and in the rat, the left lung accounts for only one third of the total lung capacity, which can be partially compensated for by the right lung. One indication of angiogenesis and the accompanying vascular remodeling in these lungs is the increased presence of growth factors endothelin-1 and nitric oxide [15, 21]. In addition, new precapillary anastomoses between the bronchial circulation and the pulmonary circulation have been observed to form [18], thereby, allowing blood from the systemic circulation to participate in gas exchange. This vascular remodeling within the ligated lung, known as post-obstructive pulmonary vasculopathy, has also been observed after pulmonary embolus [22].
Proliferation of the bronchial circulation after LPA ligation in rats was observed histologically after only 4 days [18]. In addition, an increase in systemic perfusion of the lung from 0.2% of the cardiac output to ∼ 5% was measured in mice using colored microspheres injected intravenous and intraaortic [19]. Similar results were also obtained in dogs where an increase in perfusion of up to 30% was measured using direct flow measurement techniques [13]. However, specific information on the extent and time course of the development of the bronchial circulation has not previously been presented, yet will be important for designing protocols for delivery of anti-cancer drugs. Thus, we developed and utilized a dual-modality single photon emission computed tomography (SPECT)/micro-CT imaging system to quantify the proliferation of the bronchial circulation of rats after LPA ligation. Recovery flow to the left lung via the bronchial circulation was observed using SPECT detection of radiolabeled macroaggregated albumin (MAA) that deposits in the microvasculature in proportion to local flow. As the recovery flow to the left lung originates from the aorta, the MAA injection was made into the aorta via the carotid artery, and accumulation of MAA in the lung was used as an index of bronchial flow. Micro-CT was used to obtain anatomical thorax images so that the lung field could be identified within the SPECT images, as the entire systemic vasculature was radiolabeled. Registration of the SPECT and micro-CT image volumes then enabled segmentation of the SPECT images of the left lung for subsequent flow quantification.
Materials and methods
Animal preparation: IA and IV
Twenty-seven Sprague-Dawley rats weighing 325 g (±41 SD) were used. All protocols and procedures are approved by the Institutional Animal Care and Use Committee of the Zablocki VA Medical Center. Six animals served as controls, three received a sham surgery, and the remaining 18 underwent LPA surgical occlusion. The animals were anesthetized (75 mg/kg ketamine and 0.5 mg/kg medetomidine hydrochloride, IP), intubated with PE240 tubing, and ventilated continuously using a small animal ventilator (CIV-101, Columbus Instruments) set to a tidal volume of 2 ml at a rate of 60 breaths/min. The chest was then opened laterally in the third intercostal space on the left side of the thorax, the ribs were spread, and the left lung was deflated and moved aside. The left pulmonary artery was identified, separated from the airway, and then ligated with 4-0 suture. After ligation, the left lung was reinflated with 2-3 tidal volumes, and the chest was closed. An IP injection of 1 mg/kg atipamezole hydrochloride was administered as an antagonist to the medetomidine hydrochloride to assist in the recovery of the animals. The ventilator was removed upon onset of a normal breathing pattern, and the rats were allowed to recover for a predetermined number of days (10, 20, or 40 days) before subsequent imaging studies.
The sham surgery for the three rats included all steps of the surgical ligation with the exception that the ligature was positioned around the left pulmonary artery in a loose loop, allowing normal perfusion of the left lung via the pulmonary circulation. These animals were imaged at 40 days post-ligation (458 g±55 SD). The six control rats (396 g±92 SD) received no surgery. The LPA-ligated, the sham, and the control animals were all imaged identically using the protocol described below.
Imaging of the bronchial circulation (referred to subsequently as IA imaging) of the rats occurred at 10 (341 g±31 SD), 20 (444 g±17 SD), and 40 (477 g±56 SD) days after LPA ligation. The animals were anesthetized (82 mg/kg ketamine and 1.8 mg/kg acepromazine, IM), a left carotid artery catheter (PE50) was inserted, and a retrograde injection of 74 MBq of 99mTc MAA (1.0 ml) was then made into the aortic arch. 99mTc MAA was obtained (Cardinal Health, Wauwatosa, WI) and consisted of 2.5 mg of aggregated human albumin, 5.0 mg of human albumin, 0.06 mg of stannous chloride, and 1.2 mg of sodium chloride (particle sizes of 20 to 40 μm). Ninety-five percent of the 99mTc was bound to the MAA. After removal of the catheter and closure of the wound, the rats were suspended in a plastic tube (diameter=70 mm) and positioned vertically on the specimen stage of the imaging system.
To examine perfusion via the pulmonary circulation (referred to subsequently as IV imaging), the animals were imaged again ∼5 days later, allowing for sufficient time for recovery and adequate clearance/decay of the 99mTc MAA. The rats were reanesthetized (82 mg/kg ketamine and 1.8 mg/kg acepromazine, IM), a femoral venous catheter (PE10) was inserted, and 74 MBq of 99mTc MAA (1.0 ml) was injected. The catheter was removed, the wound was closed, and the animals were imaged as described below.
Imaging system: SPECT and micro-CT
All animals were first imaged with SPECT to visualize the MAA distribution, and subsequently, without relocation or repositioning, using micro-CT to identify the lung boundaries. The tube containing the rat was positioned vertically on a micromanipulator-controlled specimen stage with vertical (z) and horizontal (x, y) translation accuracy of 1 μm and rotational accuracy of 0.001°. The stage height was adjusted so that the thorax was within the field-of-view of both the SPECT and micro-CT system simultaneously.
For SPECT data acquisition, a mobile gamma camera (DYNA MO, Picker Corporation) with a 260-mm diameter scintillation crystal [NaI(Tl)] equipped with a 5-mm pinhole collimator was positioned in front of the specimen, perpendicular to the X-ray beam. The center of the pinhole was matched with the axis of rotation and positioned at the same height as the X-ray focal spot for subsequent registration of the two image volumes. To maximize the magnification and simultaneously insure that the thorax was kept within the field of view of the gamma camera at all angular positions, the pinhole-to-object and pinhole-to-detector distances were set at a distance of 60 and 180 mm, respectively, yielding ×3 magnification. The imaging time was set to 20 s per view, and 128 projection images over 360° were acquired in a step-and-shoot mode. The raw images consisted of 128×128 pixels. Although the 5-mm pinhole was relatively large, the images reveal that the resulting spatial resolution was adequate for this experiment, involving left versus right lung comparison of MAA accumulation.
The SPECT image data were reconstructed using a voxel-driven, ordered-subset expectation maximization (OS-EM) algorithm [23, 24]. This algorithm, a variant of maximum-likelihood expectation maximization [25], computes a spatial estimate of the MAA distribution using an iterative procedure that incorporates physical and statistical parameters of the image acquisition. In particular, the algorithm incorporates an error function [26] model of the geometric response of an idealized pinhole, as well as the experimentally measured point spread function of the camera [27]. Generally, the image data were organized into four subsets, and five iterations were needed for convergence. These parameters were selected based upon previous simulation and experimental test phantom results [24, 28]. The resulting reconstructed volume matrix consisted of 128 × 128 × 128 isotropic voxels with a linear size of 0.7 mm.
For subsequent micro-CT imaging, X-ray projection images were obtained using a Feinfocus FXE 0.20 microfocal X-ray source with a 3-μm effective focal spot at a voltage of 70 kVp and a current of 30 μA. The detection system consisted of an image intensifier (Thomson TH0438 HX H661 VR24) optically coupled to a charge-coupled device (CCD) camera (Silicon Mountain Design SMD1M-15) as described previously [29, 30]. Typical source-to-detector and source-to-object distances were 800 and 350 mm, respectively, so that the projection images filled the 7-in. detector input screen, yielding ×2.3 magnification. The CCD camera acquired images consisting of 512×512 pixels. The raw images were acquired at 30 frames per second, and then 7 frames were averaged at each of 360 views over 360°. These averaged projection images were reconstructed using a Feldkamp cone-beam back-projection method [31], resulting in a reconstructed volume consisting of 497×497×497 isotropic voxels, each with a linear size of 0.11 mm.
Image analysis: registration, segmentation, and quantification
Because the rat remained in the same position on the stage during the SPECT and subsequent micro-CT imaging, the axis of rotation was identical for the SPECT and micro-CT imaging, resulting in automatic alignment of the x- and y-axes of the SPECT and micro-CT reconstructed image volumes. Furthermore, the X-ray focal spot and the gamma camera pinhole were positioned at the same height, which aligned the horizontal center plane of the SPECT and micro-CT volumes and resulted in z-axis alignment. Thus, the x-, y-, and z-axes of the object space of both image volumes had the same origin. However, to compensate for differing magnification factors between the two image volumes, the voxel sizes were rescaled so that the corresponding voxels within each image volume could be determined, resulting in co-registration of the SPECT and micro-CT image volumes.
Image segmentation was performed on the micro-CT image volume to first identify the entire lung field (left and right lungs) and, subsequently, to differentiate the left and right lungs. The image volume was initially segmented using standard region-growing techniques [32]. A seed point within the image of the air-filled lung parenchyma was positioned and a grayscale window with a lower threshold of zero (corresponding to air) and an upper threshold of the maximum grayscale value within the lung parenchyma region, excluding major blood-filled vessels, was established. The algorithm proceeded by labeling the seed point as segmented lung and then examining all eight neighboring voxels within the current slice, as well as those directly neighboring within the two adjacent slices. Any of these neighboring voxels with a grayscale value within the specified grayscale window was labeled as segmented lung. The algorithm then proceeded to examine the neighbors of each of the newly segmented voxels in the same manner and repeated the procedure until no new segmented voxels were identified and a region representing the lung without large blood-filled vessels was determined. The larger blood-filled vessels were then included in the segmentation by applying a two-step morphological closing algorithm [32]. In the first step, “dilation” was implemented by positioning a disk of the same size as the largest blood-filled vessel (∼2.5 mm) over each segmented voxel within the image, and all voxels covered by the disk were labeled as segmented. The second step (erosion) consisted of positioning the disk over each nonsegmented voxel within the image and labeling each voxel covered by the disk as nonsegmented. This two-step closing operation was repeated on each image slice within the volume and resulted in a 3D representation of the segmented lung volume within the micro-CT images.
Next, the boundary between the left and right lungs was identified manually in all slices of the micro-CT image volumes. For the IA images, several circular regions of interest (ROIs) were drawn, covering the entire left lung, while avoiding the right lung. Each ROI was extended in the vertical dimension until it intersected with the right lung, generally covering ∼25-30 slices, and closed to form a cylinder. At that slice level, the next ROI was drawn, and this procedure was repeated until the entire left lung was covered with three or four ROIs. For the IV images, the same procedure was used to segment out the right lung in the LPA-ligated rats and both lungs in the control and sham rat micro-CT image volumes.
Upon successful segmentation of the left and right lungs, MAA accumulation in the corresponding regions of the co-registered SPECT volume was determined by summing the intensity value of each voxel within the region. In particular, for the LPA-ligated rats, left-lung MAA accumulation was measured from the IA images, and right-lung MAA accumulation was measured from the IV images, whereas for the control and sham rats, MAA accumulation was measured in both lungs. As 9 of the 27 rats failed to recover after the IA imaging, right-lung measurements from the IV experiments were averaged over all rats. The bronchial circulation flow fraction, representing the fraction of cardiac output perfusing the left lung via the bronchial circulation, was then calculated as the ratio of left-lung IA to right-lung IV MAA accumulation.
In one control, one sham, one 20-day, and one 40-day LPA-ligated rat, vessel morphology was examined. The animal was anesthetized (50 mg/kg sodium pentobarbital, IP) and heparinized, (250 USP units), and PE240 tubing was inserted into the trachea through a tracheotomy. The abdomen was opened just below the xiphoid process, the diaphragm was exposed, and the lungs were inflated with a positive pressure of 6 mmHg before the diaphragm was cut and pulled back. The abdominal aorta was dissected, and PE240 tubing was inserted retrograde into the aorta and secured with 3-0 suture. Warm saline was flushed through the tubing followed by infusion of a barium-sulfate gelatin mixture (60 ml saline, 6 g gelatin, 60 g barium-sulfate) at a pressure of 90 mmHg, resulting in immediate death of the animal. As barium-sulfate particles are larger than capillaries, they did not pass through the capillary bed but instead filled the systemic arteries. The infusion was stopped when the barium had clearly filled the intercostal arteries. The aorta and trachea were ligated with suture, and the specimen was immediately cooled in the freezer to allow the barium-gelatin solution to set. The lungs and heart were then excised and preserved in formalin for subsequent examination.
Results
Reconstructed and co-registered SPECT/micro-CT images of the type used for perfusion analysis are shown in Fig. 1. One typical slice through the co-registered SPECT/micro-CT volume of an IA image acquisition in a control rat is shown in Fig. 1a, where MAA distribution through-out the systemic circulation can be observed. The IV injection resulted in 97% MAA accumulation in the right and left lungs with the corresponding images shown in Fig. 1b.
Fig. 1.
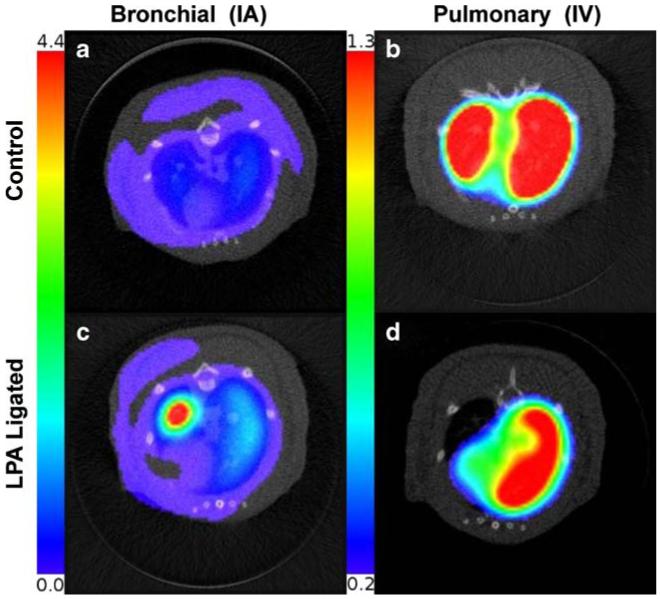
Co-registered micro-CT and SPECT reconstructions of a control rat imaged after IA injection of MAA: activity distributed uniformly in the entire systemic circulation of the rat; b control rat imaged after IV injection of MAA: activity distributed in left and right lungs; c LPA-ligated rat 40 days after surgery imaged after IA injection of MAA: activity distributed in entire systemic circulation, with increased activity in the left lung; d LPA-ligated rat imaged after IV injection of MAA: activity distributed only in the right lung. Color scale for IA and IV SPECT images is different to visualize low activity in bronchial circulation
Examples of images from the co-registered reconstructions of a 40-day post-ligation rat are shown in Fig. 1c (IA) and d (IV). Figure 1c reveals increased perfusion in the ligated left lung when compared to the control (Fig. 1a), whereas Fig. 1d confirms successful ligation of the left lung, in that MAA accumulation is observed only in the perfused right lung.
MAA distribution within the left lung was quantified by first segmenting out the lung field in the micro-CT image slices, as shown in Fig. 2a. The black region corresponds to the lung parenchyma, whereas the purple represents the eliminated non-lung tissue region. The small isolated purple regions within the parenchyma correspond to blood-filled vessels and the esophagus as noted. Figure 2b shows the same slice after the morphological closing operation, where all isolated regions within the lung parenchyma, except the esophagus, have been included into the lung region. Finally, the left lung was differentiated from the right lung using a circular ROI as shown in Fig. 2c, and total activity intensity within the left lung determined.
Fig. 2.
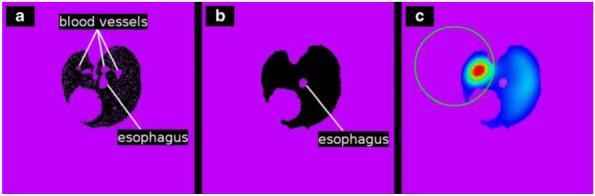
Segmentation and measurement procedure of the registered micro-CT and SPECT images. a Region growing with a seed point inside the lung parenchyma of the micro-CT reconstruction segments both lungs but misses blood vessels and denser tissue. b Morphological closing incorporates blood vessels and dense tissue into the segmentation. c Manually drawn ROI separates left from right lung, enabling measurement of activity within the left lung of the registered SPECT reconstruction
Quantification of blood flow to the left lung via the bronchial circulation, as a fraction of cardiac output, was calculated by computing the ratio of IA left lung MAA activity to IV right lung MAA activity. The bronchial circulation developed substantially over the 40-day time period studied. Figure 3 shows that, in control rats, the left lung bronchial circulation was 2.5% (±1.2, SE) of the total cardiac output (i.e., fractional flow=0.025) and increased significantly (p<0.005) to 7.5% (±0.7, SE), and 13.9% (±1.6, SE) by 20 and 40 days, respectively. Figure 3 also shows that there was no significant difference between the control group and the sham-operated group imaged 40 days post-surgery, suggesting that the impact of the surgery itself was minimal.
Fig. 3.
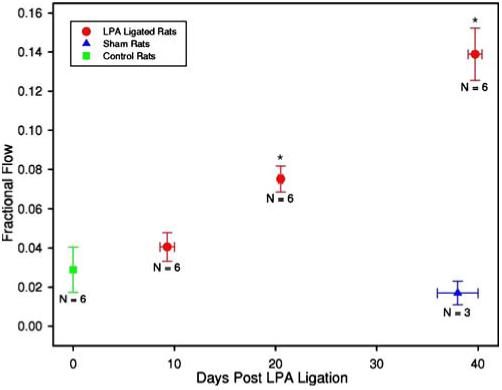
Fractional flow of output to the left lung via the bronchial circulation plotted versus time between the LPA ligation surgery and IA imaging. N represents the number of animals in each group, and the asterisk indicates significantly different from the control with p<0.005
We examined the accuracy of using a set of three or four cylinders to differentiate the left lung from the right in the segmentation procedure as described above (and referred to in this paper as the cylinder method). In four rats, the number of counts within the left lung was obtained using the cylinder method, as well as by using a labor-intensive but more accurate approach of identifying a circular ROI over the lung region within each individual slice of the volume containing the lung field (slice method). Table 1 shows that the difference for the four subjects was less than 2%. Furthermore, the repeatability of the cylinder method was examined by repeating the procedure at least 2 weeks later (to eliminate bias) on the same data set and comparing the quantification results. The data in Table 1 show that the error in the repeated cylinder measurements, when compared to using individual slices, was less than 7%. This measurement error is reflected in the error bars of Fig. 3, along with subject variation. Note that, in this worst case, a 7% increase in the number of counts in the left lung would cause the left lung fractional flow to increase from the reported 0.14 to 0.15.
Table 1.
Quantification measurement error using the slice or cylinder method to determine the left-lung boundary
| Rat no. | Left lung counts slice method | Left lung counts cylinder method | Percent error | Left lung counts cylinder method (repeated) | Percent error |
|---|---|---|---|---|---|
| 19 | 8,017 | 8,079 | 0.77 | 7,565 | -6.36 |
| 41 | 11,603 | 11,799 | 1.69 | 11,578 | -0.22 |
| 42 | 9,187 | 9,335 | 0.61 | 9,437 | +2.72 |
| 52 | 3,386 | 3,365 | -0.62 | 3,552 | +4.9 |
| Average | 1.17 | -3.55 |
The barium-filled lungs were examined for the presence of newly formed vessels, commonly having a twisted or corkscrew appearance [33], using digital macro-photography of the excised lungs, as shown in Figs. 4 and 5. No evidence of newly formed vessels or of differences in appearance between the left and rights lungs was visible in either the control or sham rats. However, Fig. 4a shows a photo of the excised lungs of the 20-day rat, wherein the left lung appears substantially lighter in color, presumably because of increased barium filling, upon comparison to the right lung, which appears deeper red. Furthermore, the left lung shows new vascularization as evidenced by the tortuous vessels, arising from the mediastinum and from the bronchial circulation. In addition to proliferation of systemic vessels within the lung parenchyma, vessels originating from intercostal arteries were observed to form a dense vascular network on the dorsal surface of the lung as illustrated in Fig. 4b obtained from a 40-day rat. These vessels appear to enter the lung parenchyma through the visceral pleura via adhesions between the left lung and the thoracic wall. Their tortuous pathways can be seen in the magnified image in Fig. 4c. Figure 5a shows the inner thoracic cavity of a sham rat with the ventral surface of the lung visible. Adhesions were formed in the sham rats; however, no vascularization of these adhesions was observed. This is in comparison to Fig. 5b from a 40-day LPA rat exhibiting a densely vascularized adhesion between the inner chest wall and the left lung parenchyma. On gross visual inspection, neither the left lung nor the right lung showed signs of necrosis or atelectasis in any of the lungs examined.
Fig. 4.
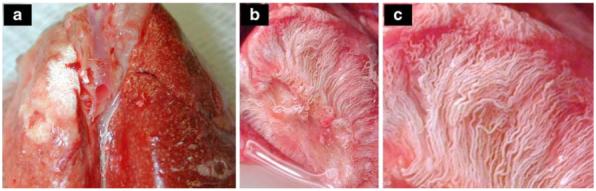
Photographs of excised LPA-ligated rat lungs filled with barium-sulfate solution. a Twenty days after LPA ligation surgery, the left lung shows increased barium filling as indicated by the lighter color compared to the deep red of the right lung. New vessels originating from the mediastinum are present on the surface. b Forty days after LPA ligation, the left lung shows a dense network of new vessels originating from the intercostal space and the mediastinum. c Magnification of b reveals tortuous vessels characteristic of angiogenesis
Fig. 5.
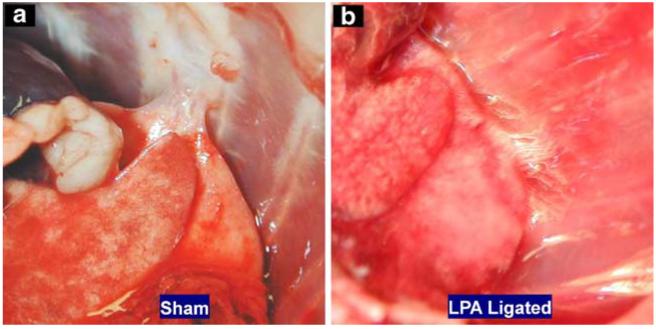
Photographs of the inner chest cavity of a a rat 40 days after sham surgery, where a loose barely vascularized adhesion formed between the rib cage and the left lung, and b a rat 40 days after a LPA ligation surgery, where tight highly vascularized adhesions formed between the left lung and rib cage
Discussion
We have used in vivo SPECT/micro-CT imaging to quantify neovascularization within the lung of a rat. Total ligation of the LPA as a stimulus of angiogenesis in the bronchial circulation has been previously reported by others [3, 18, 19, 32, 34]. However, to the best of our knowledge, the time course of bronchial perfusion increases has not been reported in a rat model nor has an effective in vivo imaging protocol been developed for its study.
In this study, the measured value of normal left lung bronchial circulation in the rat, 2.5% of total cardiac output, corresponds well to values published by Deffebach et al. [1] for other species. At 40 days post-ligation the bronchial circulation blood flow increased to ∼14% of the total cardiac output, representing a greater than fourfold increase. This is in line with studies reporting on other species such as sheep, where bronchial flow increased from 0.6 to 2.4% over 3 weeks [3, 34, 35]; mice, in which flow increased from less than 1 to ∼5% over 3 weeks [19]; and dogs from less than 0.5 to ∼10% over a 17-week period [13]. The differences in the bronchial circulation blood flow as a percent of cardiac output under normal conditions, as well as after LPA ligation, appear to vary somewhat between species, although it is not currently possible to determine whether these differences are caused by species variations or to the use of different experimental approaches for quantifying flow.
One of the primary objectives of this study was to develop an in vivo imaging protocol for assessing the pulmonary and bronchial circulations. Previous studies described above have utilized casting and histology [3, 13, 18, 19], flow probes positioned at the bronchial artery [35], fluorescent microspheres [19], and dual pump perfusion of the pulmonary and bronchial circulations [12], all methods that require sacrifice of the animal for flow quantification. Nonetheless, some have the advantage that morphological data from individual pulmonary and bronchial vessels can be measured, as well as changes in these vessels in response to ligation. The SPECT/micro-CT imaging approach used in our study is not capable of resolving individual vessels of the bronchial circulation more generally but instead relies on regional measurements of perfusion within the lung to determine bronchial blood flow and changes therein. Furthermore, this in vivo imaging approach has the potential for longitudinal observations in the same animal, yielding statistically more powerful data and possibly higher through-put imaging. Although, in our protocol, the animals were killed after IV imaging, permanent placement of a carotid catheter during the ligation surgery would permit repetitive intra-arterial imaging in the same animal.
In this study, we imaged all animals with both micro-CT and SPECT. As the sole objective of the micro-CT imaging was to define the lung boundaries, we used a fast-scan protocol (∼2 min total scan time) with relatively low amperage (70 kVp and 30 μA). As Fig. 1 reveals, the resulting micro-CT images appear somewhat noisy because of the short- and low-intensity exposure, yet are satisfactory for the subsequent boundary identification procedure. We used a clinical mobile gamma camera for SPECT imaging. The use of this system was relatively straightforward in that the image acquisition and manipulation were standard with the system, and its mobility insured compatibility with our existing micro-CT system. However, the overall spatial resolution was limited by the 5-mm diameter pinhole collimator available to us and the intrinsic resolution of the camera itself (∼3 mm). We attempted to accommodate for this by implementing an OS-EM algorithm that incorporated the effects of the point spread function of the pinhole, as well as the camera. The SPECT images indicate that the spatial resolution is adequate for lung-to-lung comparisons for rats but would certainly need improvement to accurately visualize and quantify heterogeneity of perfusion within rat lungs or lung-to-lung comparisons for mice. In this work, the lung-to-lung flow comparison may be confounded by the cylinder method used to identify the left-right boundary between the lungs, as well as potential partial volume effects that may produce spill-in or spill-out errors. As discussed above, these errors are expected to be small relative to subject variation.
OS-EM was implemented and used exclusively in the SPECT reconstructions in this study. We used five iterations based on previous simulation studies that suggested that edges of activity-filled tubes were well resolved at this point, whereas further iteration resulted in the development of artifacts in the images. Although this value is consistent with iteration numbers reported by others [23, 36], the number of iterations will depend on the complexity of the imaging model used in the reconstruction algorithm. Although the model kernel we implemented in the OS-EM algorithm incorporated the effects of the collimator and the camera as indicated above, we did not include attenuation and scatter of the emitted gamma rays within the animal. The necessity for or benefits of attenuation and scatter correction for small animal imaging in general have not been well characterized, and most research and commercially available small animal systems do not incorporate these features [27, 37, 38]. Recently, Rutao et al. [39], by simulating and comparing images of an intact rat skull with an excised rat brain, reported that attenuation correction may be beneficial but that scatter correction did not improve image quality significantly. Nonetheless, development of reliable methods for accurate quantification of physiologic function from SPECT images will require a thorough analysis of attenuation and scatter. One approach currently being investigated is the use of the X-ray images obtained from micro-CT as the attenuation map required for SPECT reconstruction [40, 41].
Acknowledgment
This work was supported by the National Institutes of Health grants HL-19298 and 64368, and the Department of Veterans’ Affairs.
Contributor Information
Christian Wietholt, MC-2026 Department of Radiology, The University of Chicago, 5841 S Maryland Avenue, Chicago, IL 60637, USA.
David L. Roerig, Department of Anesthesiology, Medical College of Wisconsin, Milwaukee, WI, USA & Zablocki VA Medical Center, Research Service 151, 5000 W. National Avenue, Milwaukee, WI 53295, USA
John B. Gordon, Zablocki VA Medical Center, Research Service 151, 5000 W. National Avenue, Milwaukee, WI 53295, USA & Department of Pediatrics, Medical College of Wisconsin, Milwaukee, WI, USA & Children’s Hospital Research Institute, Milwaukee, WI, USA
Steven T. Haworth, Zablocki VA Medical Center, Research Service 151, 5000 W. National Avenue, Milwaukee, WI 53295, USA & Division of Pulmonary and Critical Care, Medical College of Wisconsin, Milwaukee, WI, USA
Robert C. Molthen, Zablocki VA Medical Center, Research Service 151, 5000 W. National Avenue, Milwaukee, WI 53295, USA & Division of Pulmonary and Critical Care, Medical College of Wisconsin, Milwaukee, WI, USA
Anne V. Clough, Zablocki VA Medical Center, Research Service 151, 5000 W. National Avenue, Milwaukee, WI 53295, USA & Division of Pulmonary and Critical Care, Medical College of Wisconsin, Milwaukee, WI, USA & Department of Mathematics, Statistics and Computer Science, Marquette University, Milwaukee, WI, USA
References
- 1.Deffebach ME, Charan NB, Lakshminarayan S, Butler J. The bronchial circulation. Small, but a vital attribute of the lung. Am Rev Respir Dis. 1987;135:463–81. doi: 10.1164/arrd.1987.135.2.463. [DOI] [PubMed] [Google Scholar]
- 2.Nathanson I, Nadel JA. Movement of electrolytes and fluid across airways. Lung. 1984;162:125–37. doi: 10.1007/BF02715640. [DOI] [PubMed] [Google Scholar]
- 3.Charan NB, Carvalho P. Angiogenesis in bronchial circulatory system after unilateral pulmonary artery obstruction. J Appl Physiol. 1997;82:284–91. doi: 10.1152/jappl.1997.82.1.284. [DOI] [PubMed] [Google Scholar]
- 4.Kamler M, Nowak K, Bock M, Herold U, Motsch J, Hagl S, et al. Bronchial artery revascularization restores peribronchial tissue oxygenation after lung transplantation. J Heart Lung Transplant. 2004;23:763–6. doi: 10.1016/j.healun.2003.07.016. [DOI] [PubMed] [Google Scholar]
- 5.Ohta Y, Ohta N, Tamura M, Wu J, Tsunezuka Y, Oda M, et al. Vascular endothelial growth factor expression in airways of patients with lung cancer: a possible diagnostic tool of responsive angiogenic status on the host side. Chest. 2002;121:1624–7. doi: 10.1378/chest.121.5.1624. [DOI] [PubMed] [Google Scholar]
- 6.Inoue K, Kawahito Y, Sano H, Takano H, Yoshikawa T. New diagnostic tool for tumor angiogenesis. Chest. 2003;123:966–7. doi: 10.1378/chest.123.3.966-a. [DOI] [PubMed] [Google Scholar]
- 7.Hirsch FR, Franklin WA, Gazdar AF, Bunn PA., Jr. Early detection of lung cancer: clinical perspectives of recent advances in biology and radiology. Clin Cancer Res. 2001;7:5–22. [PubMed] [Google Scholar]
- 8.Hirsch FR, Merrick DT, Franklin WA. Role of biomarkers for early detection of lung cancer and chemoprevention. Eur Respir J. 2002;19:1151–8. doi: 10.1183/09031936.02.00294102. [DOI] [PubMed] [Google Scholar]
- 9.Cudkowicz L. Cardio-respiratory studies in patients with lung tumors. Dis Chest. 1967;51:427–32. doi: 10.1378/chest.51.4.427. [DOI] [PubMed] [Google Scholar]
- 10.Folkman J. Role of angiogenesis in tumor growth and metastasis. Semin Oncol. 2002;29:15–8. doi: 10.1053/sonc.2002.37263. [DOI] [PubMed] [Google Scholar]
- 11.Gross DJ, Reibstein I, Weiss L, Slavin S, Stein I, Neeman M, et al. The antiangiogenic agent linomide inhibits the growth rate of von Hippel-Lindau paraganglioma xenografts to mice. Clin Cancer Res. 1999;5:3669–75. [PubMed] [Google Scholar]
- 12.Michel RP, Hakim TS. Increased resistance in postobstructive pulmonary vasculopathy: structure-function relationships. J Appl Physiol. 1991;71:601–10. doi: 10.1152/jappl.1991.71.2.601. [DOI] [PubMed] [Google Scholar]
- 13.Michel RP, Hakim TS, Petsikas D. Segmental vascular resistance in postobstructive pulmonary vasculopathy. J Appl Physiol. 1990;69:1022–32. doi: 10.1152/jappl.1990.69.3.1022. [DOI] [PubMed] [Google Scholar]
- 14.Simon BA, Tsuzaki K, Venegas JG. Changes in regional lung mechanics and ventilation distribution after unilateral pulmonary artery occlusion. J Appl Physiol. 1997;82:882–91. doi: 10.1152/jappl.1997.82.3.882. [DOI] [PubMed] [Google Scholar]
- 15.Kim H, Yung GL, Marsh JJ, Konopka RG, Pedersen CA, Chiles PG, et al. Pulmonary vascular remodeling distal to pulmonary artery ligation is accompanied by upregulation of endothelin receptors and nitric oxide synthase. Exp Lung Res. 2000;26:287–301. doi: 10.1080/019021400404555. [DOI] [PubMed] [Google Scholar]
- 16.Shi W, Cernacek P, Hu F, Michel RP. Endothelin reactivity and receptor profile of pulmonary vessels in postobstructive pulmonary vasculopathy. Am J Physiol. 1997;273:H2558–64. doi: 10.1152/ajpheart.1997.273.6.H2558. [DOI] [PubMed] [Google Scholar]
- 17.Wang HY, Ng B, Ahrens C, Burt M. Unilateral pulmonary artery occlusion inhibits growth of metastatic sarcoma in the rat lung. J Surg Oncol. 1994;57:183–6. doi: 10.1002/jso.2930570309. [DOI] [PubMed] [Google Scholar]
- 18.Weibel ER. Early stages in the development of collateral circulation to the lung in the rat. Circ Res. 1960;8:353–76. doi: 10.1161/01.res.8.2.353. [DOI] [PubMed] [Google Scholar]
- 19.Mitzner W, Lee W, Georgakopoulos D, Wagner E. Angiogenesis in the mouse lung. Am J Pathol. 2000;157:93–101. doi: 10.1016/S0002-9440(10)64521-X. [DOI] [PMC free article] [PubMed] [Google Scholar]
- 20.Mitzner W, Srisuma S, Wagner E. Genetic regulation of systemic angiogenesis in the mouse lung. Arch Physiol Biochem. 2003;111:357–9. doi: 10.3109/13813450312331337595. [DOI] [PubMed] [Google Scholar]
- 21.Kim H, Park HA, Suh GY, Chung MP, Kwon OJ. Quantitative analysis of endothelin and nitric oxide synthase in rat model of postobstructive pulmonary vasculopathy. Exp Lung Res. 2002;28:351–9. doi: 10.1080/01902140290091985. [DOI] [PubMed] [Google Scholar]
- 22.Iwasaki K, Kusachi S, Hina K, Murakami M, Matano S, Ohnishi N, et al. Coronary to bronchial artery anastomosis in patients with noncyanotic cardiopulmonary disease: report of seven cases. Can J Cardiol. 1997;13:898–900. [PubMed] [Google Scholar]
- 23.Hudson H, Larkin R. Accelerated image reconstruction using ordered subsets of projection data. IEEE Trans Med Imag. 1994;13:601–9. doi: 10.1109/42.363108. [DOI] [PubMed] [Google Scholar]
- 24.Wietholt C, Molthen RC, Johnson RH, Dawson CA, Clough AV. In: Clough A, Amini AA, editors. SPECT imaging of pulmonary blood flow in a rat; Proc. SPIE Medical Imaging 2003: Physiology and function: methods, systems, and applications; SPIE. 2003.pp. 252–61. [Google Scholar]
- 25.Shepp L, Vardi Y. Maximum likelihood reconstruction for emission tomography. IEEE Trans Med Imag. 1982;1:113–22. doi: 10.1109/TMI.1982.4307558. [DOI] [PubMed] [Google Scholar]
- 26.Abramowitz M, Stegun IA. Handbook of mathematical functions. US Government Printing Office; Washington, DC: 1972. [Google Scholar]
- 27.Barrett H, Swindell W. Radiological imaging: the theory of image formation, detection, and processing. Vol. 1. Academic; San Diego, CA: 1981. [Google Scholar]
- 28.Wietholt C, Molthen RC, Roerig DL, Haworth ST, Dawson CA, Clough AV. In: Amini A, Manduca A, editors. Quantification of bronchial circulation perfusion in rats; Proc. SPIE Medical Imaging 2004: Physiology and function: methods, systems, and applications; Bellingham, WA: SPIE. 2004. [Google Scholar]
- 29.Molthen R, Wietholt C, Haworth ST, Dawson CA. In: Chen C, Clough AV, editors. Estimation of pulmonary arterial volume changes in the normal and hypertensive fawn-hooded rat from 3D micro-CT data; Proc. SPIE Medical Imaging 2002: Physiology and function from multidimensional images; Bellingham, WA: SPIE. 2002.pp. 266–75. [Google Scholar]
- 30.Karau KL, Molthen RC, Dhyani A, Haworth ST, Hanger CC, Roerig DL, et al. Pulmonary arterial morphometry from microfocal X-ray computed tomography. Am J Physiol Heart Circ Physiol. 2001;281:H2747–56. doi: 10.1152/ajpheart.2001.281.6.H2747. [DOI] [PubMed] [Google Scholar]
- 31.Feldkamp L, Davis L, Kress J. Practical cone-beam algorithm. J Opt Soc Am A. 1984;1:612–9. [Google Scholar]
- 32.Gonzalez RC, Woods RE. Digital image processing. 2nd ed. Prentice Hall; Upper Saddle River, NJ: 2002. [Google Scholar]
- 33.Buschmann I, Schaper W. Arteriogenesis versus angiogenesis: two mechanisms of vessel growth. News Physiol Sci. 1999;14:121–5. doi: 10.1152/physiologyonline.1999.14.3.121. [DOI] [PubMed] [Google Scholar]
- 34.Carvalho P, Thompson WH, Riggs R, Carvalho C, Charan NB. Management of bronchopleural fistula with a variable-resistance valve and a single ventilator. Chest. 1997;111:1452–4. doi: 10.1378/chest.111.5.1452. [DOI] [PubMed] [Google Scholar]
- 35.Charan NB, Baile EM, Pare PD. Bronchial vascular congestion and angiogenesis. Eur Respir J. 1997;10:1173–80. doi: 10.1183/09031936.97.10051173. [DOI] [PubMed] [Google Scholar]
- 36.Seret A, Bleeser F. Intrinsic uniformity requirements for pinhole SPECT. J Nucl Med Technol. 2006;34:43–7. [PubMed] [Google Scholar]
- 37.Wu M, Hasegawa BH, Daw MW. Performance evaluation of a pinhole SPECT system for myocardial perfusion imaging of mice. Med Phys. 2002;29:2830–9. doi: 10.1118/1.1521939. [DOI] [PubMed] [Google Scholar]
- 38.Schramm N, Wirrwar A, Sonnenberg F, Halling H. Compact high resolution detector for small animal SPECT. IEEE Trans Nucl Sci. 2000;47:1163–7. [Google Scholar]
- 39.Rutao Y, Seidel J, Johnson C, Daube-Witherspoon M, Green M, Carson R. Performance characteristics of the 3D OSEM algorithm in the reconstruction of small animal PET images. IEEE Trans Med Imag. 2000;19:798–804. doi: 10.1109/42.876305. [DOI] [PubMed] [Google Scholar]
- 40.Hwang AB, Hasegawa BH. Attenuation correction for small animal SPECT imaging using x-ray CT data. Med Phys. 2005;32:2799–804. doi: 10.1118/1.1984347. [DOI] [PubMed] [Google Scholar]
- 41.Ritman EL. Molecular imaging in small animals—roles for micro-CT. J Cell Biochem Suppl. 2002;39:116–24. doi: 10.1002/jcb.10415. [DOI] [PubMed] [Google Scholar]