

Abstract
Dip pen nanolithography (DPN) involves the direct transfer of an ink from a coated atomic force microscope (AFM) tip to a substrate of interest and uses as many as 55,000 pens to form arbitrary patterns of alkanethiols, oligonucleotides, proteins and viruses. Two limitations of DPN are the difficulty in transporting high molecular weight inks and the need to optimize individually the transport rates and tip inking methods of each molecule. As an alternative strategy that circumvents these two challenges, a method termed redox activating DPN (RA-DPN), is reported. In this strategy, an electrochemically active quinone functionalized surface is toggled from the reduced hydroquinone form to the oxidized benzoquinone form by the delivery of an oxidant by DPN. While the benzoquinone form is susceptible to nucleophilic attack in Michael-type additions, hydroquinone is not and acts as a passivating agent. Because both forms of the quinone are kinetically stable, the patterned surface can be immersed in a solution of a target containing any strong nucleophile, which will react only where the benzoquinone form persists on the surface. For proof-of-concept demonstrations, quinone surfaces were patterned by the delivery of the oxidant cerric ammonium nitrate and were immersed in solutions of AF549 labeled cholera toxin β subunit or oligonucleotides modified at the 5’ end with an amine and the 3’ end with a fluorophore. Fluorescent patterns of both the proteins and oligonucleotides were observed by epifluorescence microscopy. Additionally, RA-DPN maintains the advantageous ability of DPN to control feature size by varying the dwell time of the tip on the surface, and variation of this parameter has resulted in feature sizes as small as 165 nm. With this resolution, patterns of 50,000 spots could be made in a 100 × 100 µm grid.
The localized deposition of biological molecules is increasingly employed in materials applications,1 diagnostic screening2 and genetic assays.3 Current commercial methods for generating DNA microarrays are limited in feature size to 1 µm for the direct synthesis of oligonucleotides up to 60 bp on a surface, or ~ 50 µm for oligonucleotides or proteins spotted on surfaces.4 Consequently, new lithographic methods capable of patterning biological molecules with sub-micrometer resolution are necessary. Contact printing,5 dip-pen nanolithography,6 (DPN) and polymer-pen lithograpy (PPL)7 have emerged as powerful tools for patterning surfaces on the sub-µm length scale because they can be used to transfer molecules directly to a surface rather than use energy to activate a surface in an indirect manner. The direct transfer of molecules has several advantages over photolithography and indirect scanning probe methods,8 including potentially reduced costs and time, the ability to pattern organic and biological molecules, and, in the case of DPN and PPL, arbitrary pattern design with the potential for massive parallelization. Indeed, DPN uses as many as 55,000 pens in a 1 cm2 cantilever array,9 and PPL now utilizes as many as 11 × 106 pens in a 3 inch wafer to pattern over square centimeter areas with sub-100 nm resolution. DPN, the highest resolution technique of the three aforementioned methods, involves the direct transfer of an ink from a coated atomic force microscope (AFM) tip to a substrate of interest, and has been used to form patterns of alkanethiols, oligonucleotides, proteins, and viruses. Two limitations of DPN and PPL, however, are (1) the difficulty in transporting high molecular weight species or molecules with poor aqueous solubility through the meniscus to the surface and (2) the need to optimize individually the transport rates and tip inking methods of each molecule.
An alternative strategy is to develop an electrochemically addressable surface that can be switched from active to inactive states during or just before a patterning event. Indeed, Yousaf, Mrksich and coworkers have developed10 ways of using electroactive and photoprotected quinones with alkanethiols adsorbed on gold to create surfaces that can be toggled between states inactive and active towards Diels-Alder or nitroxamine addition reactions with cyclopentadiene or nitroxamine-containing reagents. Several aspects of this important technique limit its widespread use, notably the lengthy synthesis of the photolabile protected quinone, the requirement of a photomask, which increases complexity and limits resolution, and the reliance on a Diels-Alder or nitroxamine reaction for surface immobilization, which necessitates labeling the target. Herein, we describe a more straightforward and high resolution method for using quinones to create redox switchable surfaces that can be patterned with reagents that contain a strong nucleophile. Moreover, this new technique, termed Redox Activating DPN (RA-DPN), can be carried out on almost any type of surface, including insulators like Si/SiO2 and glass with many bio-relevant structures, including unmodified proteins and amine-modified oligonucleotides.
The RA-DPN method relies on the spatially resolved delivery of the oxidant, cerric ammonium nitrate (CAN), to a hydroquinone (HQ) surface by DPN, which reversibly switches the quinone moiety from the reduced HQ to the oxidized benzoquinone (BQ) state (Scheme 1). This redox chemistry, in turn, alters the reactivity of the quinone-rich surface in a highly localized manner. While the BQ form is susceptible to nucleophilic attack in Michael-type additions,11 HQ is not and acts as a passivating layer. Because both forms of the quinone are kinetically stable, the patterned surface can be immersed in a solution of a target containing any strong nucleophile, which will only react where the BQ form persists on the surface. The silane surface is prepared in only two steps, and features as small as 165 nm have been generated by RA-DPN. Importantly, this solution-based immobilization circumvents the transport optimization required for every different material patterned because the same oxidant is always delivered to the surface.
Scheme 1.

In a proof-of-concept experiment, an aminated surface was formed12 by immersing an oxidized silicon wafer (525 nm SiO2 layer) in a 2% (v/v) solution of aminopropyl trimethoxysilane (APTMS) in dry toluene for 5 hours in an oxygen free environment. The resulting surface, upon exposure to an ethanolic solution of freshly sublimed 1,4-BQ, forms the BQ-terminated surface via Michael Addition.13 To ink the cantilever arrays for RA-DPN with CAN, parafilm was used to sandwich the chip holding the array of 26 cantilevers (F26 pen array, NanoInk, Skokie, IL) so that the CAN solution deposited by micropippette would be localized on the cantilevers.14 Drying the array in an oven resulted in an even coating of the CAN oxidant on the tips, as evidenced by optical microscopy (see supporting information). To form patterns, the CAN coated tips were used in a DPN experiment to activate the HQ surface through local oxidation to BQ at a relative humidity of 40–60%. The hydrophilic nature of the substrate facilitates the formation of a meniscus15 and, as a result, the transport of the ink to the surfaces. The CAN inked arrays were washed with deionized water and immersed in a 10 µM solution of an oligonucleotide sequence, modified at the 5′ end with an amine and at the 3′ with a Cy3 fluorophore, for 2 hrs. The resulting oligonucleotide arrays could be imaged by epifluorescence microscopy (Figure 1A). Similarly, arrays of dots consisting of proteins were also prepared by RA-DPN by immersing the patterned quinone surface for 2 h in a 50 µg mL−1 solution of the AF549 labeled protein cholera toxin β subunit, and arrays of proteins dots were observable by epifluorescence microscopy (Figure 1B). Presumably, Michael addition occurs between the BQ moieties on the surface and the lysine residues that occur frequently on the exterior of proteins, resulting in the immobilization of the proteins on the surface without prior labeling. Upon exposure to fluorophore-labeled complementary antibodies for the protein, binding was observed, demonstrating that the proteins maintain bioactivity.
Figure 1.
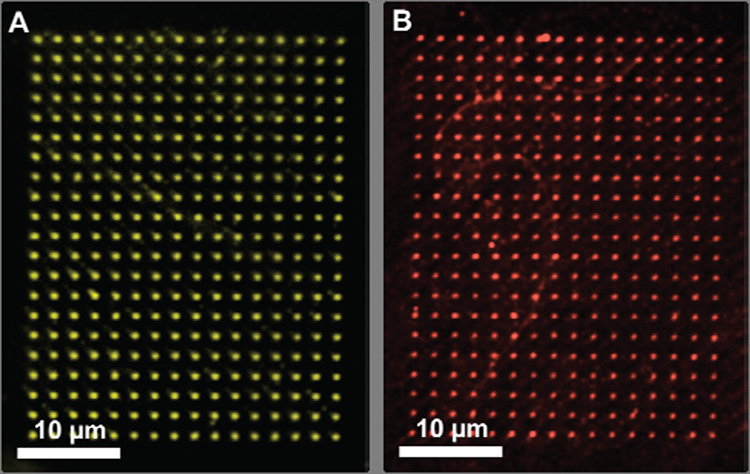
Fluorescence image of 16 × 21 pattern of (A) Cy3-labelled oligonucleotide and (B) AF549 labeled protein dot features assembled on an Si/SiO2 surface, prepared by the RA-DPN method with a 26 pen array.
An important feature of DPN, which is maintained in RA-DPN, is the ability to form patterns on a large range of length scales with precise control over size by varying dwell time. Tip arrays inked with CAN were brought into contact with the HQ surface with dwell times ranging from 0.01 to 10 s. Fluorescent images show an increase in spot size as well as fluorescence intensity as the dwell time increases (see supporting information). AFM topographical images of these patterns confirm that as dwell time increases so too does the feature size (Figure 2), following the same growth rate predicted theoretically,15 with a diameter range from 350 to 830 nm, while maintaining a constant height.
Figure 2.

(A) AFM topographical image of a series of oligonucleotide dots of increasing size created by varying dwell times (0.01, 0.05, 0.1, 0.5, 1, 5, 10 s, left to right) results in increasing spot size (350, 450, 500, 650, 740, 800, 830 nm). (B) Plot of Dwell time vs. Feature Area.
In conclusion, a novel method for using DPN to activate and deactivate features on hydroquinone functionalized surfaces has been developed. This method avoids time consuming optimization processes to pattern each additional species, can be used to pattern any material containing a strong nucleophile, and the relationship between dwell time and feature size is maintained. With the resolution demonstrated here, patterns of 50,000 spots of oligonucleotides and proteins could be made in a 100 × 100 µm grid.
Supplementary Material
Experimental preparation and instrumentation. Surface characterization by XPS, ATR-FTIR, and Raman Spectroscopy. Demonstration of surface switching by Contact Angle Measurement. Fluorescence images.
ACKNOWLEDGMENT
CAM acknowledges the AFOSR, the NIH (for a Director’s Pioneer Award), and the NCI-CCNE program for financial support. ABB is grateful to the NIH for financial support (1F32CA136148-01).
References
- 1.(a) Storhoff JJ, Mirkin CA. Chem. Rev. 1999;99:1849–1862. doi: 10.1021/cr970071p. [DOI] [PubMed] [Google Scholar]; (b) Niemeyer CM. Angew. Chem. Int. Ed. 2001;40:4128–4158. doi: 10.1002/1521-3773(20011119)40:22<4128::AID-ANIE4128>3.0.CO;2-S. [DOI] [PubMed] [Google Scholar]; (c) Groves JT, Ulman N, Boxer SG. Science. 1997;275:651–653. doi: 10.1126/science.275.5300.651. [DOI] [PubMed] [Google Scholar]
- 2.(a) Razin S. Mol. Cell. Probes. 1994;8:497–511. doi: 10.1006/mcpr.1994.1071. [DOI] [PubMed] [Google Scholar]; (b) Hacia JG, Brody LC, Chee MS, Fodor SPA, Collins FS. Nature Genet. 1996;14:441–447. doi: 10.1038/ng1296-441. [DOI] [PubMed] [Google Scholar]; (c) Elgahanian R, Storhoff JJ, Mucic RC, Letsinger RL, Mirkin CA. Science. 1997;277:1078–1081. doi: 10.1126/science.277.5329.1078. [DOI] [PubMed] [Google Scholar]
- 3.Schena M. Microarray Analysis. New Jersey: Wiley-LISS; 2002. [Google Scholar]
- 4.(a) Lipshutz RJ, Fodor SPA, Gingeras TR, Lockhar DJ. Nat. Genet. 1999;21:20–24. doi: 10.1038/4447. [DOI] [PubMed] [Google Scholar]; (b) Pirrung MC. Angew. Chem. Int. Ed. 2002;41:1276–1289. doi: 10.1002/1521-3773(20020415)41:8<1276::aid-anie1276>3.0.co;2-2. [DOI] [PubMed] [Google Scholar]
- 5.(a) Xia Y, Whitesides GM. Angew. Chem. Int. Ed. 1998;37:550–575. doi: 10.1002/(SICI)1521-3773(19980316)37:5<550::AID-ANIE550>3.0.CO;2-G. [DOI] [PubMed] [Google Scholar]; (b) Chen CS, Mrksich M, Huang S, Whitesides GM, Ingber DE. Science. 1997;276:1425–1428. doi: 10.1126/science.276.5317.1425. [DOI] [PubMed] [Google Scholar]; (c) Rozkiewicz DI, Brugman W, Kerkhoven RM, Ravoo BJ, Reinhoudt DN. J. Am. Chem. Soc. 2007;129:11593–11599. doi: 10.1021/ja073574d. [DOI] [PubMed] [Google Scholar]
- 6.(a) Piner RD, Zhu J, Xu F, Hong S, Mirkin CA. Science. 1999;283:661–663. doi: 10.1126/science.283.5402.661. [DOI] [PubMed] [Google Scholar]; (b) Sekula S, Fuchs J, Weg-Remers S, Nagel P, Schuppler S, Fragala J, Theilacker N, Franzreb M, Wingren C, Ellmark P, Borrebaeck CAK, Mirkin CA, Fuchs H, Lenhert S. Small. 2008;4:1785–1793. doi: 10.1002/smll.200800949. [DOI] [PubMed] [Google Scholar]; (c) Rozhok S, Shen CK-F, Littler P-YH, Fan Z, Liu C, Mirkin CA, Holz RC. Small. 2005;1:445–451. doi: 10.1002/smll.200400072. [DOI] [PubMed] [Google Scholar]
- 7.Huo F, Zheng Z, Zheng G, Giam LR, Zhang H, Mirkin CA. Science. 2008;321:1658–1660. doi: 10.1126/science.1162193. [DOI] [PMC free article] [PubMed] [Google Scholar]
- 8.(a) Maoz R, Cohen SR, Sagiv J. Adv. Mater. 1999;11:55–61. [Google Scholar]; (b) Maoz R, Frydman E, Cohen SR, Sagiv J. Adv. Mater. 2000;12:424–429. [Google Scholar]; (c) Li Y, Maynor BW, Liu J. J. Am. Chem. Soc. 2001;123:2105–2106. doi: 10.1021/ja005654m. [DOI] [PubMed] [Google Scholar]
- 9.Salaita K, Wang Y, Fragala J, Vega RA, Liu C, Mirkin CA. Angew. Chem. Int. Ed. 2006;43:7220–7223. doi: 10.1002/anie.200603142. [DOI] [PubMed] [Google Scholar]
- 10.(a) Yousaf MN, Houseman BT, Mrksich M. Proc. Natl. Acad. Sci. USA. 2001;98:5992–5996. doi: 10.1073/pnas.101112898. [DOI] [PMC free article] [PubMed] [Google Scholar]; (b) Dillmore WS, Yousaf MN, Mrksich M. Langmuir. 2004:7223–7231. doi: 10.1021/la049826v. [DOI] [PubMed] [Google Scholar]; (c) Yeo W-S, Mrksich M. Langmuir. 2006;22:10816–10820. doi: 10.1021/la061212y. [DOI] [PMC free article] [PubMed] [Google Scholar]; (d) Houseman BT, Huh JH, Kron SJ, Mrksich M. Nature Biotech. 2002;20:270–274. doi: 10.1038/nbt0302-270. [DOI] [PubMed] [Google Scholar]; (e) Chan EWL, Yousaf MN. J. Am. Chem. Soc. 2006;128:15542–155546. doi: 10.1021/ja065828l. [DOI] [PubMed] [Google Scholar]; (f) Chan EWL, Par S, Yousaf MN. Angew. Chem. Int. Ed. 2008:6267–6271. doi: 10.1002/anie.200800166. [DOI] [PubMed] [Google Scholar]; (g) Wescott NP, Yousaf MN. Langmuir. 2008;24:2261–2265. doi: 10.1021/la703744v. [DOI] [PubMed] [Google Scholar]; (h) Hoover DK, Chan EWL, Yousaf MN. J. Am. Chem. Soc. 2008;130:3280–3281. doi: 10.1021/ja711016m. [DOI] [PubMed] [Google Scholar]
- 11.Bunimovich YL, Ge G, Beverly DC, Ries RS, Hood L, Heath JR. Langmuir. 2004;20:10630–10638. doi: 10.1021/la047913h. [DOI] [PubMed] [Google Scholar]
- 12.LeMieux MC, Roberts M, Barman S, Jin YW, Kim JM, Bao Z. Science. 2008;321:101–104. doi: 10.1126/science.1156588. [DOI] [PubMed] [Google Scholar]
- 13.Sarkar S, Sampath S. Langmuir. 2006;22:3388–3395. doi: 10.1021/la051857i. [DOI] [PubMed] [Google Scholar]
- 14.Wang WM, Stoltenberg RM, Liu S, Bao Z. ACS Nano. 2008;2:2135–2142. doi: 10.1021/nn8005416. [DOI] [PubMed] [Google Scholar]
- 15.(a) Jang J, Hong S, Schatz GC, Ratner MA. J. Chem. Phys. 2001;115:2721–2729. [Google Scholar]; (b) Weeks BL, Noy A, Miller AE, De Yoreo JJ. Phys. Rev. Lett. 2002;88 doi: 10.1103/PhysRevLett.88.255505. 255505-1. [DOI] [PubMed] [Google Scholar]
Associated Data
This section collects any data citations, data availability statements, or supplementary materials included in this article.
Supplementary Materials
Experimental preparation and instrumentation. Surface characterization by XPS, ATR-FTIR, and Raman Spectroscopy. Demonstration of surface switching by Contact Angle Measurement. Fluorescence images.