Abstract

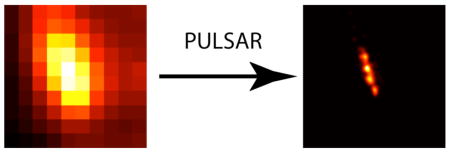
Beyond-diffraction-limit optical imaging of cells will reveal biological mechanisms, cellular structures, and physiological processes in nanometer scale. Harnessing the photoswitching properties of spiropyran fluorophores, we achieved nano-resolution fluorescence imaging using photo-actuated unimolecular logical switching attained reconstruction (PULSAR) microscopy. The PULSAR microscope successfully resolved nanostructures and subcellular organelles when the photoswitchable nanoparticles containing spiropyran dyes were used as the fluorescent probes.
Fluorescence imaging has transformed biological sciences and opened a window to reveal biological mechanisms in real time despite the diffraction limit restricts the optical microscope resolution to about 300 nm. Recently, two ultra-high-resolution fluorescence microscopic techniques have circumvented the diffraction limit by stochastically photoswitching fluorophores on and off.1–4 The current selection of photoswitchable fluorophores for such high resolution imaging techniques are extremely limited and the photoswitching mechanisms have not been well studied. Two methods were reported: photoactivatable fluorescence protein (PFP) and a pair of Cy3 and Cy5 dyes in close proximity. However, the PFP is much bigger than dye molecules and Cy3–Cy5 pairs suffer from stringent requirements that the environments must be oxygen free. These will limit their cellular imaging applications. Thus, new photoswitchable fluorophore development becomes critically important to apply such ultra-high resolution microscopy broadly.5
The ideal photoswitchable probe should integrate high brightness, low molecular weight, and flexible chemical modifications into a single molecule so that it will easily adapt to the cellular environment. In this paper, we present that spiropyran derivatives have the desired characteristics and are excellent photoswitchable fluorophores. Using such a fluorophore, we have achieved photo-actuated unimolecular logical switching attained reconstruction (PULSAR) microscopy, with resolution down to 10~40 nm, far beyond the diffraction limit. Herein, we observe nanostructures on glass surfaces and cellular organelles in fixed cells, which cannot be resolved by conventional fluorescence microscopy. Spiropyran requires no special treatment to cells and can be readily modified using chemical functional groups for specific targeting.6,7
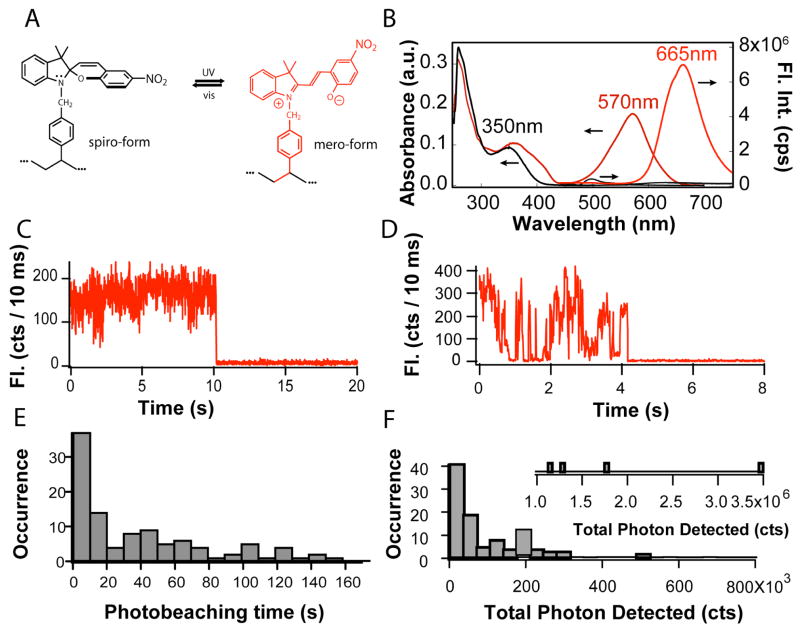
Unlike the photoactivatable green fluorescent protein and the Cy3–Cy5 pair in very close proximity, the spiropyran-merocyanine photoswitching mechanism and photochemical induced structures are well understood (Figure 1a).8–12 The spiropyran form has negligible visible absorption and consequently no fluorescence under visible excitation (Figure 1b). Its ring-opened form merocyanine, however, absorbs strongly at 570 nm and emits vivid red-fluorescence (665 nm) in hydrophobic nanoparticle cores (Figure 1b).6,7 UV illumination induces the spiropyran-to-merocyanine conversion and switches on fluorescence; visible photoexcitation of the merocyanine accelerates the back conversion and returns the photoswitching dye into the off state. Such desired fluorescence photoswitching properties will enable nanometer-resolution PULSAR microscopy provided that spiropyran/merocyanine dyes have a high emission rate, long photobleaching time, qualified emitted photon count, and efficient photochemical switching.
Figure 1.
(A) Spiropyran (spiro-form) and merocyanine (mero-form) were polymerized into the hydrophobic cores of polymer nanoparticles and thus their photochemical conversion occurs within isolated protected nanoparticles. (B) The optical absorption (left and bottom axes) of spiro-(black) and mero-form (red) and fluorescence spectra (bottom and right axes) of the spiro-(black) and mero-form (red) are plotted against the wavelength. (C & D) Two typical single-molecule intensity trajectories illustrate that the photoswitching dye in its emissive state–merocyanine behaves very much like normal high-quantum yield dyes such as rhodamine. (E) The photobleaching time histogram reveals that the photobleaching reaction follows first order kinetics. (F) The histogram of total detected photon displays the number of photons detected by each individual molecule and such emission occurrence.
Accordingly, the single-molecule photophysics of merocyanine was studied first. Spin-coating dilute spiropyran and poly (methyl methacrylate) in dichloromethane resulted in thin films containing isolated photoswitchable dyes. Next, UV illumination converted the spiropyran dye to the merocyanine fluorophore. The detected merocyanine photons produce an emission rate of several kHz under 0.6 kW/cm2 excitation, comparable to other high-quantum yield dyes such as rhodamine and strong enough for single-molecule studies.13
Figure 1c and d display two representative fluorescence intensity trajectories from 100 photoswitchable individual merocyanine molecules and the trajectories exhibit typical single molecule signatures such as intensity blinking and one-step photobleaching. Permanent merocyanine photobleaching is evident. In Figure 1c and d, the molecules were bleached at 10.2 seconds and at 4.2 seconds, respectively. Moreover, Figure 1e reveals the measured photobleaching times in a histogram, which yields an average photobleaching time of 47 seconds. The histogram exponential decay suggests that photobleaching obeys the first order kinetics with a rate constant of ~0.02 s−1.
The total number of photons that one molecule can emit before photobleaching is an important photophysical property because it determines the ultimate spatial resolution of the PULSAR imaging (vide infra). Summing all the photons from an individual molecule until photobleaching while excluding background yields the total number of detected photons. Figure 1f plots the total detected photon histogram, revealing that an average merocyanine molecule emits 1.8×10⁵ detected photons before permanent photobleaching. Both the photobleaching time and total photon emission are comparable to other frequently used dyes in single molecule spectroscopy such as rhodamine dyes.13,14 In summary, the single-molecule spectroscopic studies demonstrate that merocyanine dyes exhibit good fluorescence brightness and photobleaching resistance, thus useful photoswitching fluorophores for high-resolution PULSAR microscopy.
The fluorescence onset involves the spiropyran-to-merocyanine conversion and can be photoswitched on very quickly and efficiently. Because this photochemical conversion proceeds very easily, a much lower UV laser power about 1~100 mW/cm2, orders of magnitudes lower than the power required for normal fluorescence imaging, was used to switch on the fluorescence. Although UV contains high energetic photons, such low power is expected to induce no more photo-toxicity than the visible imaging excitation at considerably higher power. Unlike the photobleaching kinetics, the spiropyran dark states switch to the bright states very quickly and its fast kinetics makes the fluorescence on-switching difficult to measure. Interestingly, the photobleached merocyanine does not become spiropyran under these conditions as subsequent UV illumination from sub-seconds to tens of seconds cannot switch on any detectable red-fluorescence when excited at 532 nm. Therefore, UV pulses cannot reverse the photobleached molecules back into the fluorescent form, a desirable characteristic for PULSAR microscopy.
The high-resolution microscope principle has been demonstrated and described fully.1,4 A single molecule can be located precisely, even down to the nanometer scale 15,16 as long as its neighboring molecules within the diffraction limited area are switched off to the “dark” state. The spiropyran-to-merocyanine photoswitching property enables the PULSAR far field optical microscopy to achieve nanometer resolution. Under controlled conditions, each image reveals a limited number of photoswitchable molecules that are fluorescing; many accumulated images consist of thousands of single molecule on-switching events. Next, fitting every single-molecule location in each image frame and finally summing all the fitted single-molecule frames reconstructs a high-resolution microscopic image.
Firstly, we used PULSAR microscope to image 70-nm spiropyran nanoparticles that have been synthesized previously.6,17–19 Because the optical diffraction limit restricts resolving any feature on the scale of wavelength, ~300 nm, traditional optical microscopy cannot resolve such nanoparticles packed within the diffraction limited region. The PULSAR microscopy alternated a short 0.03-s UV pulse and a regular 532-nm excitation pulse: the former photoswitched on a limited number of spiropyran molecules into the emitting merocyanine bright state and the latter recorded the single-molecule fluorescence image at 2-s exposure. The setup is similar to what published elsewhere.20,21 The isolated single molecules were photobleached after the first exposure or after several subsequent exposures. Recording 300-image frames registered thousand locations of single-molecule emitters; their precise locations were determined using the centroid of the experimental single-molecule image peak fitted by a Gaussian mask.15
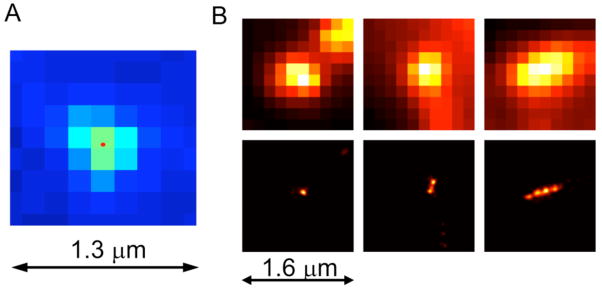
Figure 2a illustrates a single molecule image and its centroid position determined by Gaussian mask. Because multiples photons were detected from a single molecule, the uncertainty of the centroid position is much smaller than the image spot size and also much smaller than the 160-nm image pixel size. Theoretical calculation pointed out that the more photons detected from a single molecule, the more precise this single molecule can be located without any limitation.15 If there were no background noise, detecting 105 photons would have provided an ultra-high 1-nm spatial resolution. But background noise does exist, and the practical resolution will deviate from the ideal 1-nm uncertainty. We experimentally tested the uncertainty of the Gaussian mask fitting, revealing 5-nm standard deviation and 12-nm FWHM (see supporting information). This uncertainty eventually determines the resolution of PULSAR. Under cell imaging conditions, the FWHM resolution is estimated about 10~40 nm based on the experimental data.
Figure 2.
(A) Conventional fluorescence image of a single merocyanine molecule confirms the typical diffraction limited size. The centroid, as marked by the red spot, was determined by Gaussian mask fitting. (B) Using 70-nm nanoparticles to compare conventional fluorescent microscopy (top) and PULSAR microscopy (bottom) reveals the resolution difference in the nanoparticle patterns. The conventional fluorescence microscope resolves micrometer and sub-micrometer features, whereas PULSAR microscope dramatically improves the resolution by ~25 fold, distinguishing features effectively at the nanoscale.
Side-by-side, Figure 2B compares the traditional fluorescence images to the corresponding high-resolution PULSAR images. Obviously, PULSAR microscope provides a dramatic resolution improvement. While the traditional fluorescence microscopy cannot resolve four 70-nm nanoparticles arranged in a row, PULSAR microscopy clearly resolves the nanostructure composed of four juxtaposed nanoparticles on glass. Figure 2B demonstrates that PULSAR microscopy has the ability to resolve nanostructures.
Secondly, the PULSAR microscopy was developed to image complex subcellular structures at the nanoscale. To demonstrate that the PULSAR microscope has the ability to image subcellular components, we decorated the nanoparticle surfaces with HMGA1 protein. Such modified nanoparticles effectively bind to the HMGA1 receptor on HeLa cells. The cells subsequently endocytoses the nanoparticle cargoes, delivering the photoswitchable spiropyran nanoparticles into early endosomes. When a cell binds to nanoparticles, the initial nanoparticles exist as discrete particles. The endocytosed spiropyran-nanoparticles are enclosed in endosomes and transported by motor proteins and eventually reach lysosomes, where their transportation stops. During this transportation, the cell has organized multiple particles into a single lysosome.
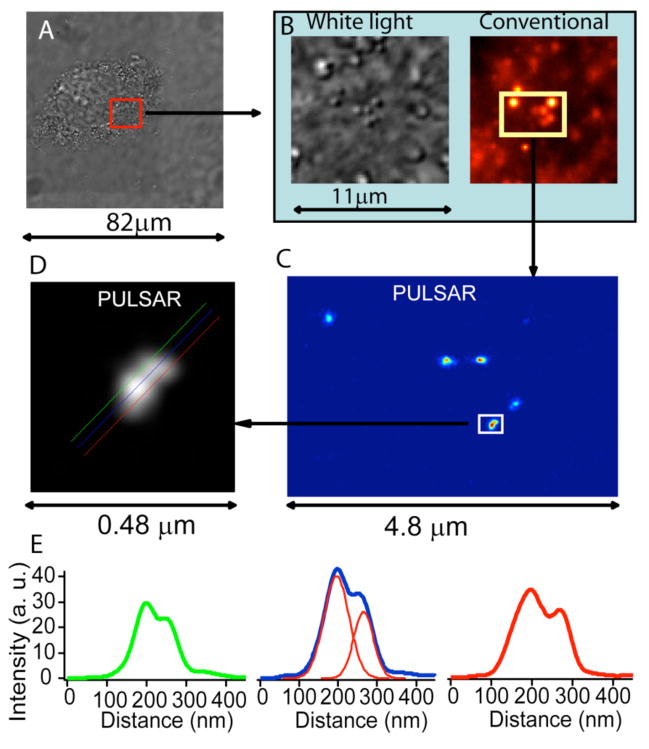
The important criteria of PULSAR microscopy utility are imaging cellular organelles at the nanoscale resolution. To demonstrate PULSAR microscope capability, we fixed HeLa cells, selected a sub-cellular area of interest (Figure 3a), zoomed into this region (Figure 3b), and collected both white light images and conventional fluorescence imaging. At this stage, most nanoparticles were transported into lysosomes and as a result, lysosome fluorescence intensified. Using 532-nm light to switch off the merocyanine emission and photobleach most interfering fluorophores prepared the sample for PULSAR measurement. PULSAR microscopy alternated a UV fluorescence on-switching pulse and a 532-nm probe pulse. This pulse and probe pattern repeated many cycles to accumulate hundreds of single-molecule emission events; these events were processed as described above to reconstruct the final high-resolution image as displayed in Figure 3c. The conventional image detects all single molecule fluorescence intensities. PULSAR image intensity, however, measures the number of photoswitching events. Thus, there is no proportional scaling factor to relate these two techniques; this explains why one bright spot becomes dim in the PULSAR image.
Figure 3.
PULSAR images detect spiropyran-nanoparticles in a fixed cellular organelle. Bright field image of a fixed HeLa cell (A) provides an area of interest (red box). (B) Zooming in the white light image indicates nanostructures scattering light and conventional wide-field fluorescence imaging reveals that most of these features comprise photoswitchable nanoparticles. (C) The PULSAR image of these spiropyran-nanoparticles produces much higher resolution, separating fuzzy clusters into distinct bright spots. Careful examination reveals that these bright spots are not circular, hinting possible multiple nanoparticles in a single spot. (D) Zooming-in on one bright area in (C) divulges resolved overlapping two spots, corresponding to at least two nanoparticles. Lines drew along the two overlapping spots reveal the fluorescence intensity profile and yield a center-to-center distance of ~69 nm (E).
Figure 3c and d display the PULSAR images of the nanoparticles in a lysosome of a fixed cell. Traditional wide field optical microscopy cannot resolve multiple nanoparticles residing in a lysosome when and because the organelle size is smaller than the diffraction limit. The PULSAR microscope, however, has resolved the nanoparticles inside a single organelle. The PULSAR images prove these bright spots are not spherical, suggesting multiple nanoparticles residing in a single lysosome. The non-regular feature of these PULSAR images matches and further confirms the typical heterogeneous nature of lysosomes. Figure 3d reveals that there are at leas two particles residing in this single lysosome. Three parallel lines drawn along the elongated direction of the spot reveal the profiles of fluorescence intensity of these two bright features. Figure 3e definitely resolves these two bright features and yields a measured peak-to-peak distance of 50, 55, and 70 nm, respectively. Fitting the intensity profile (blue line) yields the projected nanoparticle center-to-center distance 69 nm between these two bright features, coincidentally matching the center-to-center distance of two tangent ~70-nm nanoparticles. Again, these data demonstrate that PULSAR microscopy can resolve subcellular organelles down to the nanoscale.
To conclude, we have demonstrated single-molecule spiropyran-to-merocyanine photoswitching imparts strong red-fluorescence and the resulting merocyanine offers good photophysical characteristics including high emission rate, long photobleaching time, and large total detected photon count for single-molecule imaging. Such fluorescence photoswitching enables nanometer spatial resolution PULSAR microscopy. Significantly, the nanoparticles containing photoswitchable spiropyran molecules were delivered into cells and multiple particles residing within a single cellular organelle were resolved. The PULSAR microscopy, thus, emerges as a new high-resolution methodology to study biological events and mechanisms at the nanoscale.
Supplementary Material
Experimental procedure regarding PULSAR microscope setup, and PULSAR data processing.
Acknowledgments
A portion of the work was performed in the Environmental Molecular Sciences Laboratory, a national scientific user facility sponsored by the Department of Energy’s Office of Biological and Environmental Research and located at Pacific Northwest National Laboratory. ADQL acknowledges the support of National Institute of General Medicine Sciences (GM065306) and National Science Foundation (CHE-0805547).
References
- 1.Betzig E, Patterson GH, Sougrat R, Lindwasser OW, Olenych S, Bonifacino JS, Davidson MW, Lippincott-Schwartz J, Hess HF. Science. 2006;313:1642–1645. doi: 10.1126/science.1127344. [DOI] [PubMed] [Google Scholar]
- 2.Egner A, Geisler C, von Middendorff C, Bock H, Wenzel D, Medda R, Andresen M, Stiel AC, Jakobs S, Eggeling C, Schonle A, Hell SW. Biophys J. 2007;93:3285–3290. doi: 10.1529/biophysj.107.112201. [DOI] [PMC free article] [PubMed] [Google Scholar]
- 3.Hess ST, Girirajan TPK, Mason MD. Biophys J. 2006;91:4258–4272. doi: 10.1529/biophysj.106.091116. [DOI] [PMC free article] [PubMed] [Google Scholar]
- 4.Rust MJ, Bates M, Zhuang X. Nat Meth. 2006;3:793. doi: 10.1038/nmeth929. [DOI] [PMC free article] [PubMed] [Google Scholar]
- 5.Lord SJ, Conley NR, Lee H-lD, Samuel R, Liu N, Twieg RJ, Moerner WE. J Am Chem Soc. 2008;130:9204–9205. doi: 10.1021/ja802883k. [DOI] [PMC free article] [PubMed] [Google Scholar]
- 6.Zhu MQ, Zhu LY, Han JJ, Wu WW, Hurst JK, Li ADQ. J Amer Chem Soc. 2006;128:4303–4309. doi: 10.1021/ja0567642. [DOI] [PMC free article] [PubMed] [Google Scholar]
- 7.Menju A, Hayashi K, Irie M. Macromolecules. 1981;14:755–758. [Google Scholar]
- 8.Dürr H, Bouas-Laurent H. Photochromism: molecules and systems. Rev. Elsevier; Amsterdam; Boston: 2003. [Google Scholar]
- 9.Berkovic G, Krongauz V, Weiss V. Chem Rev. 2000;100:1741–1753. doi: 10.1021/cr9800715. [DOI] [PubMed] [Google Scholar]
- 10.Kawata S, Kawata Y. Chem Rev. 2000;100:1777–1788. doi: 10.1021/cr980073p. [DOI] [PubMed] [Google Scholar]
- 11.Crano JC, Guglielmetti RJ. Organic photochromic and thermochromic compounds. Kluwer Academic/Plenum Publishers; New York: 1999. [Google Scholar]
- 12.Brown GH. Photochromism. Wiley-Interscience; New York: 1971. [Google Scholar]
- 13.Yip WT, Hu D, Yu J, VandenBout DA, Barbara PFJ. Phys Chem A. 1998;102:7564–7575. [Google Scholar]
- 14.Deschenes LA, Vanden Bout DA. Chem Phys Lett. 2002;365:387–395. [Google Scholar]
- 15.Thompson RE, Larson DR, Webb WW. Biophys J. 2002;82:2775–2783. doi: 10.1016/S0006-3495(02)75618-X. [DOI] [PMC free article] [PubMed] [Google Scholar]
- 16.Yildiz A, Selvin PR. Acc Chem Res. 2005;38:574–582. doi: 10.1021/ar040136s. [DOI] [PubMed] [Google Scholar]
- 17.Tomasulo M, Kaanumal SL, Sortino S, Raymo FM. J Org Chem. 2007;72:595–605. doi: 10.1021/jo062004d. [DOI] [PubMed] [Google Scholar]
- 18.Ishizu K, Yamashita M, Ichimura A. Polymer. 1997;38:5471–5474. [Google Scholar]
- 19.Chen MQ, Kishida A, Akashi M. J Polym Sci Part A-Polym Chem. 1996;34:2213–2220. [Google Scholar]
- 20.Hu D, Lu HP. J Phys Chem B. 2003;107:618–626. [Google Scholar]
- 21.Orr G, Hu D, Özçelik S, Opresko LK, Wiley HS, Colson SD. Biophys J. 2005;89:1362–1373. doi: 10.1529/biophysj.104.056192. [DOI] [PMC free article] [PubMed] [Google Scholar]
Associated Data
This section collects any data citations, data availability statements, or supplementary materials included in this article.
Supplementary Materials
Experimental procedure regarding PULSAR microscope setup, and PULSAR data processing.


