Abstract
Cancers are clonal expansions, but how a single, transformed human cell grows into a billion-cell tumor is uncertain because serial observations are impractical. Potentially, this history is surreptitiously recorded within genomes that become increasingly numerous, polymorphic, and physically separated after transformation. To correlate physical with epigenetic pairwise distances, small 2,000- to 10,000-cell gland fragments were sampled from left and right sides of 12 primary colorectal cancers, and passenger methylation at 2 CpG-rich regions was measured by bisulfite sequencing. Methylation patterns were polymorphic but differences were similar between different parts of the same tumor, consistent with relatively isotropic or “flat” clonal expansions that could be simulated by rapid initial population expansions. Methylation patterns were too diverse to be consistent with very rare cancer stem cells but were more consistent with multiple (≈4 to 1,000) long-lived cancer stem cell lineages per cancer gland. Our study illustrates the potential to reconstruct the unperturbed biology of human cancers from epigenetic passenger variations in their present-day genomes.
Keywords: progression, invasion, growth
Human cancer dynamics are poorly characterized because serial observations are impractical. Cancers are thought initially to grow exponentially followed by a decline in growth rates (1). Progression is also thought to occur through clonal evolution (2), with the succession of increasingly more-fit tumor populations. Although this is conceptually attractive, it has been difficult to document human cancer evolution directly, and clonal evolution may be rare in visible cancers because the full malignant potential may often be present at the time of transformation (3, 4).
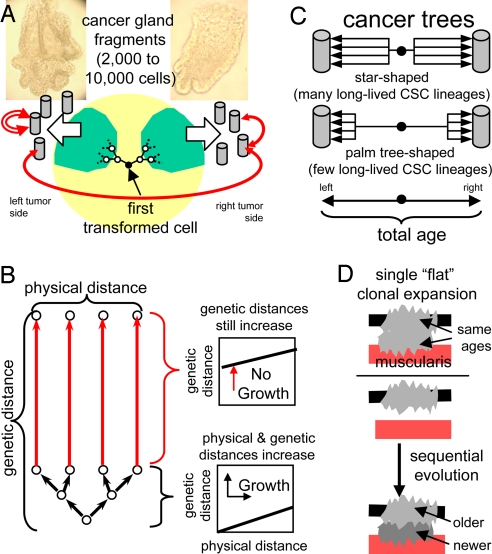
In lieu of direct observations, statistical methods are commonly used to infer the past from variation in present-day genomes. Cancers are large cell populations that originate from single transformed cells. Both genetic and physical distances potentially encode ancestry because cancer genomes become increasingly numerous, polymorphic, and physically separated after transformation (Fig. 1A). Because daughter cells are initially adjacent, physical distances can be used to calibrate genetic distances, particularly when tumor cells are divided into distinct subpopulations by glands that deter mixing. During tumor growth, both physical and genetic distances increase. However, when growth ceases and cell division is balanced by cell death, physical distances are relatively static but genetic distances still increase, potentially reducing correlations between physical and genetic differences (Fig. 1B). Adjacent cells within a gland may or may not be closely related, whereas cells from different sides of a cancer likely shared a common ancestor near the time of transformation (Fig. 1C).
Fig. 1.
Outline of the approach. (A) Small (2,000–10,000 cell) cancer-gland fragments isolated from different parts of the same cancer allow correlations between genome variation and physical location (between cancer sides, within sides, and within fragments). Cells from opposite sides of the cancer should be least related and likely shared a common ancestor around the time of transformation. (B) During tumor growth, physical and genetic distances increase. When growth slows and cell division is balanced by cell death, genetic distances increase, although physical distances are static. (C) Cancer-gland diversity depends on mitotic age and numbers of long-lived cancer stem cells (CSCs) per gland. More diversity will accumulate with frequent CSCs (star-shaped trees) than with rare CSCs (palm tree-shaped trees). Branch lengths within glands can be compared relative to the total mitotic age of the cancer. (D) With a simple rapid, flat-clonal expansion, all parts of a tumor have similar ages because they were created in a short time period. With clonal evolution, different tumor parts may have different ages because new capabilities are acquired sequentially. For example, invasive portions may be younger and less diverse because invasion may occur after an in situ phase.
A rapid, initial clonal expansion produces relatively uniform tumor populations because different parts of the tumor are essentially created at the same time. We call such uniformity isotropic or “flat,” because one cannot readily distinguish between different parts of the same tumor. Many primary tumors are physically symmetric (ball-like or donut-shaped), and their underlying ancestral trees may also be similar in different tumor regions if most long-lived stem cell lineages and their glands are created during the initial clonal expansion. Alternatively, clonal evolution could produce population heterogeneity because different parts of a tumor are created at different times (Fig. 1D).
Somatic mutation frequencies are too low [<1 mutation per 100,000 bases (5, 6)] in most cancer genomes to readily compare sequence variations between cells within individual cancers. However, epigenetic patterns, like cytosine methylation on CpG dinucleotides, are also copied during genome replication (7). The 5′ to 3′ order of DNA methylation can be measured by bisulfite sequencing and can be used, like sequences, as a measure of population diversity (8). Methyl-cytosine has a relatively higher mutation rate than other DNA bases, but such mutations are still rare in cancer genomes (6). Starting from the first transformed cell, the 5′ to 3′ order of methylation at certain neutral or passenger regions may drift during the multiple genome replications needed to form a visible cancer. If a single cancer progresses through a series of expansions, older portions will be more heterogeneous relative to newer subpopulations. However, with flat clonal expansions, methylation pattern heterogeneity would be similar throughout the tumor because ancestry (cell division and death) and mitotic age (total numbers of divisions since transformation) are similar in different parts of the cancer. Here we sample passenger methylation patterns from different parts of the same tumor and find evidence that many colorectal cancers are relatively flat clonal expansions.
Results
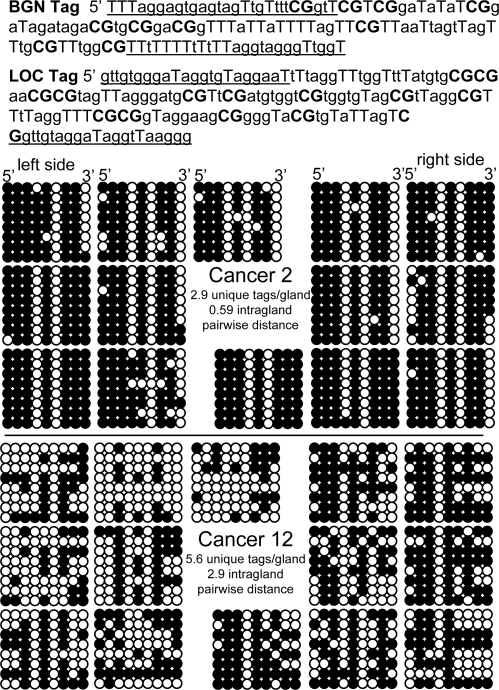
To simplify analysis, passenger methylation patterns were measured with bisulfite sequencing of 2 small CpG-rich regions or “tags” (BGN, 8 or 9 CpG sites; and LOC, 14 CpG sites) on the X-chromosome (Fig. 2) in 12 cancers from male patients (Table 1). It is likely that only a single allele or pattern is present in the first transformed cell because aneuploidy is relatively rare in adenomas (9, 10). Tag methylation is likely to represent neutral passenger changes because the LOC tag is in an intergenic region, and BGN is expressed in connective tissue and not epithelium (11). An implicit assumption is that methylation and demethylation errors behave in a similar way to point mutations in genomic DNA. Although this assumption has not been directly tested, DNA methylation appears to require cell division (12), and methylation patterns in the normal human colon are consistent with such replication errors (11).
Fig. 2.
The BGN tag contains 9 CpG sites and the LOC tag contains 14 CpG sites (CpG sites are bold, capital Ts represent converted C at non-CpG sites, and primers are underlined). BGN tag data (14 gland fragments: 7 left, 7 right) are illustrated from a relatively homogeneous tumor (Cancer 2) and a more heterogeneous tumor (Cancer 12). Eight BGN tags were sampled from each fragment (112 total tags) and arranged horizontally in a 5′ to 3′ order. Each group of 8 epialleles represents a single cancer gland.
Table 1.
Colorectal cancers: P values for right versus left cancer comparisons
| Cancer | Age | Size | Stage | MSI+ | BGN methylation | LOC methylation | BGN tag | LOC tag | BGN intradistance | LOC intradistance |
|---|---|---|---|---|---|---|---|---|---|---|
| 1 | 65 | 3 | A | N | 0.59 | 0.76 | 0.18 | 0.37 | 0.25 | 0.77 |
| 2 | 79 | 4 | A | N | 1.0 | 0.22 | 0.23 | 0.34 | 0.21 | 0.80 |
| 3 | 46 | 4.5 | B | Y | 0.72 | 0.14 | 0.06 | 0.32 | 0.006 | 0.55 |
| 4 | 50 | 4.5 | A | Y | 0.33 | 0.04 | 0.13 | 1.0 | 0.40 | 0.47 |
| 5 | 53 | 4.5 | C | N | 0.08 | 0.35 | 0.65 | 0.32 | 0.30 | 0.67 |
| 6 | 51 | 5.5 | C | N | 0.93 | 0.96 | 0.69 | 0.57 | 0.85 | 0.46 |
| 7 | 43 | 5.5 | C | Y | 0.29 | 0.02 | 0.64 | 0.50 | 0.78 | 0.44 |
| 8 | 98 | 6 | B | N | 0.25 | 0.87 | 0.42 | 0.24 | 0.16 | 0.56 |
| 9 | 85 | 7.5 | D | N | 0.91 | 0.66 | 0.87 | 0.49 | 0.98 | 0.69 |
| 10 | 61 | 7.5 | C | N | 0.48 | 0.50 | 0.15 | 0.07 | 0.0004* | 0.46 |
| 11 | 83 | 8 | B | N | 0.79 | 0.86 | 0.86 | 1.0 | 0.78 | 0.55 |
| 12 | 44 | 9 | C | N | 0.001* | 0.70 | 0.72 | 0.02 | 0.92 | 0.05 |
*After a Bonferroni correction for multiple comparisons for the 12 cancers, comparisons were not significantly different between cancer sides, except for BGN intradistance in Cancer 10 and BGN methylation in Cancer 12 (P < 0.0042, two sided t-test). See SI Appendix for gland tag data from each cancer.
For each cancer, 2 physically distinct regions (≈1 cm3) were obtained from different sides at least 2 cm apart. Five to 7 small cancer gland fragments (about 2,000–10,000 cells in size) were sampled from each side (see Fig. 1A), with bisulfite sequencing of 8 tags from each fragment. Multiple tag comparisons are possible within individual glands and between glands either from the same or different sides of the cancer.
Cancer Gland Methylation Patterns Are Spatially Symmetric.
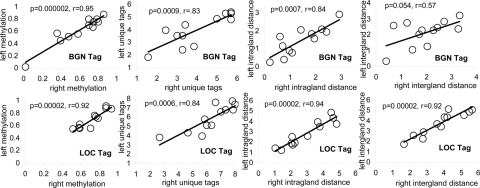
With flat clonal expansions, one side of a tumor should be as diverse as another side. Tag patterns were complex and heterogeneous within and between fragments of a single cancer [see Fig. 2 and supporting information (SI) Appendix], but average tag parameters from opposite sides of the same tumor were correlated (Fig. 3). There were no significant differences between sides in the numbers of unique tags per gland for any of the 12 cancers. There was a single cancer (Cancer 10) with a significant difference between sides for pairwise tag distances within a gland for BGN but not LOC tags, and for percent-tag methylation there was a single cancer (Cancer 12) with a significant difference between sides for BGN but not LOC tags (see Table 1). This uniform intragland tag-pattern heterogeneity is consistent with relatively flat clonal expansions and implies that cell ancestry within a gland is similar, regardless of where the gland is located.
Fig. 3.
Average tag values correlated between right and left tumor sides.
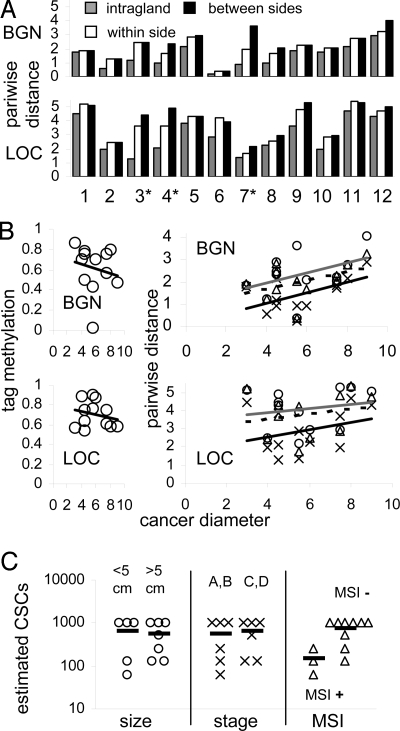
Consistent with the expectation that physical distance may be a surrogate for ancestry, average pairwise-tag distances were smaller within glands and greater between glands (Fig. 4A). Diversity is thought to arise from replication errors and more divisions are likely required to form larger cancers. While there was no trend for increasing percentage of-tag methylation with cancer size, there was a slight trend for greater tag diversity in larger cancers (Fig. 4B). This trend was not statistically significant and some smaller cancers were more diverse than some larger cancers, indicating diversity or mitiotic age is not a simple function of absolute cell number or physical distances.
Fig. 4.
Physical versus pairwise distances. (A) Average pairwise-tag distances generally increased with physical distance and were smallest within glands, intermediate between glands from the same tumor side, and greatest between glands from opposite sides. Microsatellite instability (MSI+) cancers are indicated by asterisks. (B) Average tag methylation did not increase with cancer diameter but there was a nonsignificant trend for greater average pairwise distances with increasing cancer diameter: intragland distances (“X” and black line); distances between glands on the same side (triangles and dotted line); distances between glands from opposite cancer sides (circles and gray line). Some smaller cancers were more diverse than larger cancers, indicating diversity is not simply a function of total cell number. The order of average diversity (intrafragment < within a side < between sides) is consistent with greater genome differences with physical distance within individual tumors. (C) Estimated number of CSCs per gland with stochastic survival did not correlate with cancer diameter or stage, but were smaller in cancers with MSI+.
Tag Distances Vary with Physical Distances but Not Phenotype.
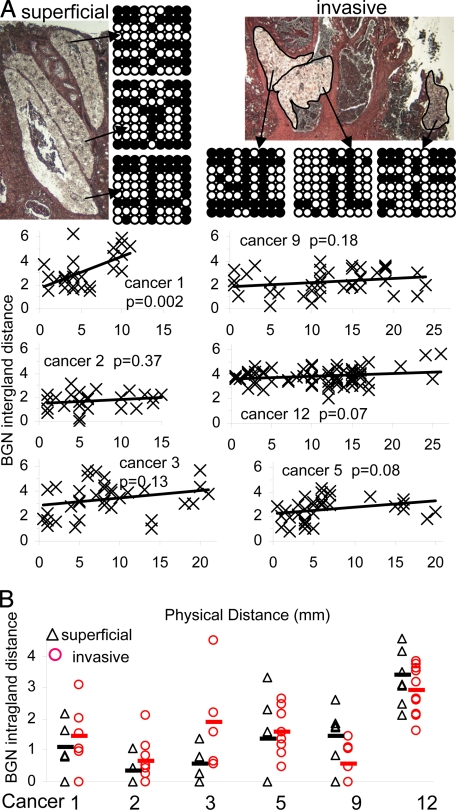
To correlate more precisely tag and physical distances, BGN tag patterns were sampled from glands microdissected by laser capture microscopy (LCM) for 6 cancers. If growth occurred continuously by gland fission, adjacent glands should be more related than more distant glands. If growth occurred by rapid clonal expansion, glands are essentially created at the same time and pairwise differences between glands would reflect in situ replication errors (see Fig. 1B); widely separated glands would be almost as related as adjacent glands. Within a single microscope slide, there was a trend for greater intergland tag distances with physical distance (Fig. 5A). This trend was slight and significant for only 1 of 6 cancers. Adjacent glands were almost as related as more distant glands.
Fig. 5.
LCM studies. (A) Small superficial or invasive fragments on microscope slides from Cancer 12 contained diverse BGN tag patterns. Images (after LCM) are illustrated. BGN pairwise-tag distances between LCM-isolated glands increased minimally with physical distance (only significant for Cancer 1), indicating adjacent glands are almost as closely related as more distant glands. (B) Average intragland BGN pairwise-tag distances were not significantly different (P > 0.05) between superficial and invasive LCM isolated glands.
LCM also provides the ability to compare invasive and superficial glands. If invasion occurs later in the progression (see Fig. 1D), invasive glands should be less diverse than older superficial glands. Intragland tag distances were not significantly different between invasive and superficial glands (Fig. 5B), suggesting that invasive and superficial portions of the same tumor have similar mitotic ages.
Simulations Consistent with Rapid Initial Growth and a Stem Cell Hierarchy.
The above data demonstrate relatively uniform methylation pattern heterogeneity throughout many colorectal cancers. To better understand how such uniform diversity may arise, we simulated tumorigenesis starting from a single transformed cell. To simulate local ancestry, cells were partitioned into glands that divide into 2 similar glands when the number of cells per gland exceeds a threshold. Glands from different parts of the tumor were sampled at the end of the simulation. With these simulations, it is possible to infer numbers of long-lived lineages or CSCs per cancer gland by comparing tag diversity between cancer sides with tag diversity within cancer glands. If there are many CSCs per gland, the diversity within a gland should be nearly as great as the diversity between cancer sides (see Fig. 1C and SI Appendix). With very rare CSCs, gland diversity would be much less than the diversity between cancer sides.
Parameters used in the model include the number of divisions, the number of CSCs per gland fragment, and the stem cell division process: asymmetric (1 daughter cell survives) or symmetric (both daughters survive or die). Methylation replication error rates were fixed in our simulations. Although the mitotic age of any individual cancer is uncertain, most cancers are likely to be removed within a few years after transformation. Assuming our cancers represent an average cohort, methylation error rates were set such that the average interval between transformation and removal of our 12 cancers was about 2 years (see SI Appendix for details). LOC and BGN pairwise-tag distances between cancer sides were used to calibrate the mitotic age of each cancer because these genomes likely last shared a common ancestor around the time of transformation.
Observed tag diversity could be simulated with initial exponential growth followed by divisions but no net increase in cell numbers. Estimated cancer mitotic ages ranged from 250 to 1,130 divisions (Table 2). Tag diversity was not consistent with very rare (1 per gland) or common (every cell is a “stem” cell) CSCs, but more consistent with a hierarchy of shorter-lived cells maintained by intermediate numbers of mitotic CSCs per cell gland (Table 3 and SI Appendix). No single scenario fit all cancers, and cancers had different numbers of estimated CSCs per gland (see Table 2). Simulations with deterministic (100% asymmetric) division required smaller numbers (4–16 per gland) of CSCs, whereas stochastic survival (50% asymmetric division) required larger CSC numbers (64–1,024 per gland). Both deterministic and stochastic stem cell hierarchies qualitatively fit the experimental data, but more experimental intragland values fell within the 95% simulation intervals for CSCs with stochastic survival (see Table 3).
Table 2.
Inferred cancer mitotic ages and numbers of CSCs
| Cancer | Estimated mitotic age | CSCs per gland* |
|---|---|---|
| 1 | 590 | 16, 1,024 |
| 2 | 250 | 8, 1,024 |
| 3 | 600 | 4, 64 |
| 4 | 660 | 4, 128 |
| 5 | 690 | 8, 1,024 |
| 6 | 420 | 8, 512 |
| 7 | 1,130 | 4, 256 |
| 8 | 400 | 4, 256 |
| 9 | 700 | 16, 1,024 |
| 10 | 380 | 8, 128 |
| 11 | 780 | 8, 1,024 |
| 12 | 1,100 | 8, 1,024 |
*Estimated numbers of CSCs per gland with either deterministic divisions (always asymmetric, lower number) or stochastic survival (asymmetric or symmetric divisions, higher number).
Table 3.
Proportion of intragland experimental values within 95% simulation intervals
| CSC scenario | BGN tags | LOC tags | Both |
|---|---|---|---|
| 1 CSC per glanda | 0.23 | 0.07 | 0.16 |
| All CSCsb | 0.74 | 0.61 | 0.68 |
| Multiple deterministic CSCsc | 0.92 | 0.74 | 0.84 |
| Multiple stochastic CSCsd | 0.95 | 0.92 | 0.93 |
| Total comparisons | 334 | 274 | 608 |
a1 CSC per 8,192 cell gland, 100% asymmetric division.
b4,096 CSCs per 8,192 cell gland, 50% asymmetric division.
cBetween 4 and 16 CSCs per 8,192 cell gland, 100% asymmetric division.
dBetween 64 and 1,024 CSCs per 8,192 cell gland, 50% asymmetric division.
CSC frequencies may have important biological consequences for tumor progression. There were no significant differences between tumor size or stage and estimated CSC numbers, but cancers with MSI+ tended to have lower estimated numbers of CSCs per gland (Fig. 4C).
Discussion
Little is known about how human cancers grow because their growth cannot be observed systematically. Although cancer progression may occur through clonal evolution (2), potentially the full malignant potential of a cancer is present at the time of transformation (3, 4). The observation that colorectal cancer-gland diversity is similar regardless of location or phenotype is consistent with relatively simple flat clonal expansions. Several known cancer characteristics may contribute to this uniformity. With rapid initial growth kinetics (1), the long-lived lineages that populate different parts of a tumor tend to be nearly identical because they are created early after transformation during exponential growth. Only about 30 cell doublings are required for a single cell to produce a visible tumor (≈1 cm3 or ∼1 billion cells), but many more divisions are possible during nonexponential tumor growth when cell division may be balanced by cell death. Therefore, rapid clonal expansion would tend to homogenize a tumor and most cancer-gland passenger diversity will accumulate later from in situ replication errors (see Fig. 1B).
A hallmark of cancer is uncontrolled proliferation from self-sufficiency in growth signals and insensitivity to antigrowth signals (13), and cancer cells will potentially have similar mitotic ages regardless of location or phenotype because they cannot regulate their divisions. Unregulated, monotonic cell division could therefore contribute to uniform cancer-gland mitotic ages and diversity. Consistent with the hypothesis that the ability to invade may be determined at the time of transformation (3, 4), observed similarities in diversity of superficial and invasive cancer glands (see Fig. 5B) suggests that physical invasion occurs early but commonly stalls. If the capability for invasion exists at the time of transformation, cells that express an invasive phenotype may do so simply because they are fortuitously next to the muscularis during the rapid, initial clonal expansion. Clonal evolution after transformation may occur infrequently in visible cancers because somatic mutations are relatively rare in cancer genomes. Cancer point-mutation rates appear comparable to normal cells, progression from a large adenoma to cancer was estimated to require about 17 years, and generally the same mutations are present in primary tumors and their metastases (5, 6, 14).
Recent transplantation studies have identified stem cell properties in CD133-expressing colorectal cancer cells, with estimates of about 1 CSC per ≈60,000 cancer cells (15, 16). However, stem cells are also ancestors in an ancestral tree (17), and cancer-tag diversity was more consistent with multiple long-lived, actively dividing CSC lineages in each gland fragment. This inferred CSC gland hierarchy is similar to normal crypts (18), with short-lived progeny maintained by multiple niche stem cells. Further studies are needed to reconcile possible differences between CSCs prospectively identified by xenotransplantation versus ancestors retrospectively identified from genome variation. Although quiescent CSCs may be resistant to therapies that target dividing cells (19), it would be difficult to generate and accumulate diversity within single cancer glands if CSCs were quiescent and rare. Frequent and mitotic CSC lineages could more effectively generate greater heterogeneity, thereby contributing to chemotherapeutic failures from preexisting resistant subclones (20). Interestingly, MSI+ colorectal cancers are associated with better clinical outcomes (21) and appear to have less frequent CSCs.
Our conclusions are limited by the relatively small numbers of tags per cancer and the inherent uncertainties and imprecision of reconstructing the past from stochastic replication errors, which could mask local differences in mitotic ages. The current approach may not be optimal, but the general strategy of reconstructing the past by comparing genomes within spatially defined cell populations can have broad applications to human biology because prior experimental interventions are unnecessary. A future analysis would sample CpG sites at more loci because error rates are likely to vary along a chromosome. Cancer ancestral histories inferred from passenger variations may improve the understanding of how rarer driver changes reprogram a single transformed cell to grow, invade, or metastasize.
Methods
Cancer Gland Isolation.
Excess fresh colorectal cancer tissues were obtained after surgery from the Norris Cancer Center, with approval by its Institutional Review Board. Two, ≈1 cm3 regions at least 2 cm apart were sampled from each cancer, and individual cancer glands were isolated from each region with an EDTA-washout as with normal colon crypts (11). The glands appeared to contain greater than 95% epithelial cells and varied in size from 2,000 to 10,000 cells. DNA in each gland was isolated and bisulfite treated using an agar bead method (11). Microsatellite instability was defined by somatic deletions in two polyA repeat loci [BAT-25 and BAT-26 (22)]. LCM was performed with an Arcturus PixCell II system.
Cancer Tag Analysis.
Approximately one-third of each bead was amplified by PCR for the BGN (11) or LOC tags (see Fig. 2). Both tags are on the X-chromosome and the cancers were all from male patients. The LOC tag is located in an intergenic region ≈7 Kb upstream of BGN at Xq28. PCR products were cloned and 8 tags per gland were sequenced. For each cancer, 10 to 12 glands were analyzed for LOC, and 13 to 14 glands for BGN.
Simulations of Cancer Crypt Ancestry.
The simulations started from a single transformed cell containing a single tag with a percent methylation closest to the average observed value for the cancer (see SI Appendix for more details). Initial growth was exponential (1 cell produces 2 daughter cells) such that after 32 divisions, there were approximately 4 billion cells. Subsequently, cell division was balanced by cell death. To maintain local ancestry, cells were clustered within 8,192 cell glands, which divided into 2 glands during exponential growth when this threshold was exceeded. Simulations were designed so that only representative portions of the entire history were sampled. Afterward, methylation replication errors were superimposed upon the simulated ancestry.
Parameters used in the simulation include total cancer mitotic ages, methylation error rates, stem cell numbers per gland, and whether stem cell division after exponential growth was deterministic (100% asymmetric with 1 stem and 1 non-stem cell daughter) or stochastic (defined here as a 50% probability of asymmetric division). With stochastic stem cell division, similar to a stem cell niche (11), stem cell lineage extinction was balanced by stem cell lineage expansion such that total stem cell numbers per gland were constant. To mimic a stem cell hierarchy, non-stem cell progeny were allowed to divide and die in such a way that glands contained 8,192 cells.
Mitotic ages were estimated for each cancer by simulating the number of divisions required to generate observed pairwise tag distances between sides. Methylation error rates (methylation or demethylation) were estimated to be 0.0003 or 0.0005 changes per CpG site per division, respectively, for BGN and LOC tags. The mitotic age of the tumor was taken as the average of ages estimated with BGN or LOC tags. These estimated mitotic ages were similar between LOC and BGN tags, except for Cancer 6 and Cancer 7 (see SI Appendix). Each cancer was simulated with different numbers (i.e., 1, 2, 4, … 4,096) of stem cells per gland. For unique tags per gland and intragland-pairwise distances, 95% simulation intervals were used to judge which stem scenarios best fit the experimental data (see Tables 2 and 3).
Supplementary Material
Acknowledgments.
This work was supported by grants from the National Institutes of Health. S.T. was supported in part by the University of Cambridge, Cancer Research U.K., and Hutchison Whampoa Limited.
Footnotes
The authors declare no conflict of interest.
This article is a PNAS Direct Submission.
This article contains supporting information online at www.pnas.org/cgi/content/full/0810276106/DCSupplemental.
References
- 1.Norton LA. Gompertzian model of human breast cancer growth. Cancer Res. 1988;48:7067–7071. [PubMed] [Google Scholar]
- 2.Nowell PC. The clonal evolution of tumor cell populations. Science. 1976;194:23–28. doi: 10.1126/science.959840. [DOI] [PubMed] [Google Scholar]
- 3.Bernards R, Weinberg RA. A progression puzzle. Nature. 2002;418:823. doi: 10.1038/418823a. [DOI] [PubMed] [Google Scholar]
- 4.Weinberg RA. Mechanisms of malignant progression. Carcinogenesis. 2008;29:1092–1095. doi: 10.1093/carcin/bgn104. [DOI] [PMC free article] [PubMed] [Google Scholar]
- 5.Wang TL, et al. Prevalence of somatic alterations in the colorectal cancer cell genome. Proc Natl Acad Sci USA. 2002;99:3076–3080. doi: 10.1073/pnas.261714699. [DOI] [PMC free article] [PubMed] [Google Scholar]
- 6.Wood LD, et al. The genomic landscapes of human breast and colorectal cancers. Science. 2007;318:1108–1113. doi: 10.1126/science.1145720. [DOI] [PubMed] [Google Scholar]
- 7.Holliday R, Pugh JE. DNA modification mechanisms and gene activity during development. Science. 1975;187:226–232. [PubMed] [Google Scholar]
- 8.Shibata D, Tavaré S. Counting divisions in a human somatic cell tree: how, what and why? Cell Cycle. 2006;5:610–614. doi: 10.4161/cc.5.6.2570. [DOI] [PubMed] [Google Scholar]
- 9.Shih IM, et al. Evidence that genetic instability occurs at an early stage of colorectal tumorigenesis. Cancer Res. 2001;61:818–822. [PubMed] [Google Scholar]
- 10.Jones AM, et al. Analysis of copy number changes suggests chromosomal instability in a minority of large colorectal adenomas. J Pathol. 2007;213:249–256. doi: 10.1002/path.2234. [DOI] [PubMed] [Google Scholar]
- 11.Yatabe Y, Tavaré S, Shibata D. Investigating stem cells in human colon by using methylation patterns. Proc Natl Acad Sci USA. 2001;98:10839–10844. doi: 10.1073/pnas.191225998. [DOI] [PMC free article] [PubMed] [Google Scholar]
- 12.Velicescu M, et al. Cell division is required for de novo methylation of CpG islands in bladder cancer cells. Cancer Res. 2002;62:2378–2384. [PubMed] [Google Scholar]
- 13.Hanahan D, Weinberg RA. The hallmarks of cancer. Cell. 2000;100:57–70. doi: 10.1016/s0092-8674(00)81683-9. [DOI] [PubMed] [Google Scholar]
- 14.Jones S, et al. Comparative lesion sequencing provides insights into tumor evolution. Proc Natl Acad Sci USA. 2008;105:4283–4288. doi: 10.1073/pnas.0712345105. [DOI] [PMC free article] [PubMed] [Google Scholar]
- 15.O'Brien CA, Pollett A, Gallinger S, Dick JE. A human colon cancer cell capable of initiating tumour growth in immunodeficient mice. Nature. 2007;445:106–110. doi: 10.1038/nature05372. [DOI] [PubMed] [Google Scholar]
- 16.Ricci-Vitiani L, et al. Identification and expansion of human colon-cancer-initiating cells. Nature. 2007;445:111–115. doi: 10.1038/nature05384. [DOI] [PubMed] [Google Scholar]
- 17.Shibata D. Stem cells as common ancestors in a colorectal cancer ancestral tree. Curr Opin Gastroenterol. 2008;24:59–63. doi: 10.1097/MOG.0b013e3282f2a2e9. [DOI] [PubMed] [Google Scholar]
- 18.Potten CS, Loeffler M. Stem cells: attributes, cycles, spirals, pitfalls and uncertainties. Lessons for and from the crypt. Development. 1990;110:1001–1020. doi: 10.1242/dev.110.4.1001. [DOI] [PubMed] [Google Scholar]
- 19.Polyak K, Hahn WC. Roots and stems: stem cells in cancer. Nat Med. 2006;12:296–300. doi: 10.1038/nm1379. [DOI] [PubMed] [Google Scholar]
- 20.Goldie JH, Coldman AJ. The genetic origin of drug resistance in neoplasms: implications for systemic therapy. Cancer Res. 1984;44:3643–3653. [PubMed] [Google Scholar]
- 21.Sinicrope FA, et al. Microsatellite instability accounts for tumor site-related differences in clinicopathologic variables and prognosis in human colon cancers. Am J Gastroenterol. 2006;101:2818–2825. doi: 10.1111/j.1572-0241.2006.00845.x. [DOI] [PubMed] [Google Scholar]
- 22.Zhou XP, et al. Determination of the replication error phenotype in human tumors without the requirement for matching normal DNA by analysis of mononucleotide repeat microsatellites. Genes Chromosomes Cancer. 1998;21:101–107. doi: 10.1002/(sici)1098-2264(199802)21:2<101::aid-gcc4>3.0.co;2-4. [DOI] [PubMed] [Google Scholar]
Associated Data
This section collects any data citations, data availability statements, or supplementary materials included in this article.


