

Abstract
Objectives
This study determined whether increased levels of inflammatory blood markers, D-dimer, and homocysteine were associated with smaller calf skeletal muscle area, increased calf muscle percent fat, reduced calf muscle density, and poorer calf strength in persons with lower extremity peripheral arterial disease (PAD).
Background
Elevated levels of inflammatory markers and D-dimer are associated with greater functional impairment and functional decline in persons with PAD. Mechanisms of these associations are unknown.
Methods
Participants were 423 persons with PAD. Calf muscle area, percent fat, and density were measured with computed tomography. Physical activity levels were measured objectively over 7 days with the Caltrac (Muscle Dynamics Fitness Network, Inc., Rocklin, California) vertical accelerometer. Isometric plantarflexion strength was measured. Analyses were adjusted for age, gender, race, comorbidities, the ankle-brachial index, and other potential confounders.
Results
Higher levels of D-dimer (p = 0.014), C-reactive protein (CRP) (p = 0.002), interleukin (IL)-6 (p < 0.001), and soluble vascular cellular adhesion molecule (sVCAM)-1 (p = 0.008) were associated with smaller calf muscle area. Higher sVCAM-1 (p = 0.004) and IL-6 (p = 0.017) were associated with higher calf muscle percent fat. Higher D-dimer (p < 0.001), sVCAM-1 (p < 0.001), and homocysteine (p = 0.014) were associated with lower calf muscle density. These associations were generally unchanged after additional adjustment for physical activity. Higher sVCAM-1 (p = 0.013) was associated with lower calf strength.
Conclusions
These data show, for the first time, that higher levels of inflammation, D-dimer, and homocysteine are associated with more adverse calf muscle characteristics in persons with PAD. These associations may contribute to previously established associations between elevated biomarkers and functional impairment and functional decline in PAD.
Chronic inflammation has been proposed as a biologic mechanism underlying aging-related functional decline. An inflammatory state characterized by increased levels of inflammatory cytokines and markers may contribute to sarcopenia, an age-related reduction in muscle strength and mass (1–5). Persons with peripheral arterial disease (PAD) have increased levels of inflammatory blood markers and increased functional impairment compared with persons without PAD (6–8). We previously reported (9) that increased levels of D-dimer and C-reactive protein (CRP) are associated with poorer lower extremity functional performance in persons with PAD, independent of confounders. Elevated levels of inflammation and D-dimer are associated with faster rates of functional decline in persons with PAD (10). Mechanisms of these associations are unclear. Therefore, we studied associations of elevated levels of inflammatory blood markers with calf skeletal muscle characteristics and leg strength in persons with PAD. D-dimer and homocysteine were also studied. We studied D-dimer because it is an end product of fibrinolysis and may promote the inflammatory cascade by activating neutrophils and monocytes, inducing secretion of inflammatory cytokines (including interleukin [IL]-6), and promoting hepatic synthesis of acute-phase proteins (11–14). We studied homocysteine because it may contribute to skeletal muscle weakness and atrophy by affecting the ability of cells to regenerate and respond to trophic stimuli (15,16). Calf muscle characteristics studied were calf muscle area, calf muscle percent fat, and calf muscle density. Calf muscle density is a measure of muscle fiber number per unit area and may be a measure of muscle quality. We hypothesized that higher levels of each blood marker would be associated with smaller muscle area, higher calf muscle percent fat, lower calf muscle density, and lower calf muscle strength in persons with PAD. To determine whether significant associations of blood markers with strength were specific to the calf muscle, we also studied associations between blood markers with grip strength.
Methods
Participant identification
The protocol was approved by the Institutional Review Boards of Northwestern University Feinberg School of Medicine and Catholic Health Partners Hospitals. Participants gave informed consent. Participants included persons with PAD attending their fourth annual follow-up visit in the WALCS (Walking and Leg Circulation Study) (8,17) and newly identified PAD participants for the present study (WALCS II). In both WALCS and WALCS II, PAD participants were identified consecutively from among patients diagnosed with PAD in 3 Chicago-area noninvasive vascular laboratories. Data were collected between November 2002 and May 2004. Because participants in the original WALCS cohort were age 59 and older at the time of this data collection, an inclusion criterion for newly identified participants was age 59 or older.
Of 238 PAD participants returning for their fourth annual follow-up visit for the WALCS, 214 underwent computed tomography (CT) scanning and were included in the present analyses. An additional 240 participants with PAD were newly identified for WALCS II and underwent CT scanning. Of these, 202 (85%) from WALCS and 221 (92%) of those newly identified underwent blood draw at their visit and were eligible for the present study.
Exclusion criteria
Peripheral arterial disease was defined as ankle-brachial index (ABI) <0.90 (17–20). Patients with recent major surgery were excluded. At the time of enrollment for both WALCS and WALCS II, the following exclusion criteria were applied. Patients with dementia were excluded because of their inability to answer questions accurately. Nursing home residents, wheelchair-bound patients, and patients with foot or leg amputations were excluded because they had severely impaired functioning. Non–English-speaking patients were excluded because investigators were not fluent in non-English languages.
ABI measurement
The ABI was measured using established methods (8,17–20). After participants rested supine for 5 min, a hand-held Doppler probe (Nicolet Vascular Pocket Dop II, Golden, Colorado) was used to measure systolic pressures in the right brachial artery, right dorsalis pedis and posterior tibial arteries, left dorsalis pedis and posterior tibial arteries, and left brachial artery. Each pressure was measured twice: in the order listed and then in reverse order. The ABI was calculated in each leg by dividing average pressures in each leg by the average of the 4 brachial pressures (17,20). Average brachial pressures in the arm with highest pressure were used when 1 brachial pressure was higher than the opposite brachial pressure in both measurement sets and the 2 brachial pressures differed by 10 or more mm Hg in at least 1 measurement set, because in such cases subclavian stenosis was possible (21). Lowest leg ABI was used in analyses.
Measuring calf muscle characteristics
Using a CT scanner (LightSpeed, General Electric Medical Systems, Waukesha, Wisconsin), we obtained a 2.5-mm cross-sectional image of the calves at 66.7% of the distance from the distal to the proximal tibia (22). BonAlyse software (BonAlyse Ltd., Jyvaskyla, Finland) was used to measure characteristics of muscle, as follows. The muscle outline was traced manually and excluded subcutaneous fat and bone. When measuring muscle area, the BonAlyse software quantifies voxels within a range corresponding to muscle density (9 to 271 mg/cm3) and excludes voxels corresponding to fat density (−270 to 8 mg/cm3). Intramuscular fat is quantified by summing voxels corresponding to fat within muscle tissue. Muscle density measures the amount of muscle per volume, within the range corresponding to muscle (9 to 271 mg/cm3), and is a measure of muscle quality. Previous cadaver studies (23) demonstrate that these methods provide an estimate of muscle area that is highly correlated with direct anatomic measures.
Isometric leg strength
Leg strength was measured using a computer-linked strength chair (Good Strength Chair, Metitur Oy, Jyvasklya, Finland) (24). This strength chair was developed for measurement of isometric strength. Transducers were placed for measurement of hand grip and ankle extension. Data are collected over 6 s, and results are electronically collected by the computer. Strength measurements using the Good Strength Chair have high test-retest reliability (0.88 to 0.96) (24). Maximum strength was used in analyses.
Blood marker levels
Blood specimens were collected at the same study visit at which leg strength and muscle characteristics were measured. Blood specimens were stored at −70°C until the time of measurement. Interleukin-6 was measured by an ultrasensitive enzyme-linked immunosorbent assay from R & D Systems (Minneapolis, Minnesota). The assay has a sensitivity of 0.094 pg/ml. Enzyme-linked immunosorbent assays (ELISA) from R & D Systems were used to measure soluble intracellular adhesion molecule (sICAM)-1 and soluble vascular cellular adhesion molecule (sVCAM)-l. An Asserachrom D-Di kit (Diagnostica Stago, Parsippany, New Jersey) was used to measure fibrin D-dimer using an ELISA procedure. The Asserachrom D-Di kit has a lower detection limit of 5 ng/ml. Concentrations of high-sensitivity C-reactive protein were determined using an immunoturbidimetric assay on the Hitachi 917 analyzer (Roche Diagnostics, Indianapolis, Indiana), using reagents and calibrators from Denka Seiken (Niigata, Japan). This assay has a sensitivity of 0.003 mg/dl. The concentration of homocysteine was determined using an enzymatic assay on the Hitachi 917 analyzer (Roche Diagnostics), using reagents and calibrators from Catch Inc. (Seattle, Washington).
Total cholesterol and high-density lipoprotein levels
Total cholesterol levels were measured using enzymatic reaction with peroxidase/phenol-4-aminoiphenazone indicator reaction (25). High-density lipoprotein (HDL) cholesterol was measured using a direct enzymatic colorimetric assay (26).
Accelerometer-measured physical activity
Physical activity was measured objectively and continuously over seven days using a vertical accelerometer (Caltrac, Muscle Dynamics Fitness Network, Inc., Rocklin, California) (27–31). After 7 days, participants reported the number of activity units displayed on the accelerometer by telephone to investigators and returned their accelerometer by mail. We programmed the accelerometer identically for all participants, allowing us to compare physical activity levels between participants, irrespective of individual variation in age, weight, height, and gender (27–31). Programmed in this way, the accelerometers measured “activity units” (27–31). The validity of the Caltrac accelerometer for measuring physical activity in patients with PAD has been demonstrated (27–31). In one study, there were no differences in accelerometer scores between persons with and without PAD over a fixed distance of 800 ft. However, over 7 days PAD participants had substantially lower Caltrac-assessed activity than non-PAD participants (28).
Fifty-nine percent of participants with PAD who were eligible for this study wore a Caltrac monitor for 7 days. Systematic data on reasons that some participants did not wear monitors were not collected. Some participants refused to wear monitors, others wore monitors but did not return them and could not be reached at 7-day follow-up, some participants' monitors malfunctioned, and, in some instances, no monitors were available.
Leg symptoms
Leg symptoms were classified into 1 of 5 groups using the San Diego Claudication Questionnaire (17,32): 1) intermittent claudication; 2) leg pain on exertion and rest; 3) atypical exertional leg pain/carry on; 4) atypical exertional leg pain/stop; or 5) asymptomatic.
Comorbidities
Algorithms developed for the Women's Health and Aging Study and the Cardiovascular Health Study were used to document comorbidities, combining data from patient report, physical examination, medical record review, medications, laboratory values, and a primary care physician questionnaire (33). Comorbidities assessed were angina, diabetes mellitus, myocardial infarction, stroke, heart failure, pulmonary disease, cancer, spinal stenosis, and disk disease. American College of Rheumatology criteria were used to adjudicate knee and hip osteoarthritis (34,35). History of hypertension was based on patient report of physician-diagnosed hypertension or a physician's indication of hypertension on the primary care physician questionnaire.
Other measures
Height and weight were measured at the study visit. Body mass index (BMI) was calculated as weight (kg)/(height [m])2. Cigarette smoking history was based on sell-report.
Statistical analyses
Associations between quartiles of each blood factor and calf muscle characteristics (muscle area, muscle percent fat, and muscle density) as well as strength outcomes were evaluated using analyses of covariance and statistical tests for trend, adjusting for age, gender, race, cigarette smoking, BMI, leg symptoms, recruitment cohort (original WALCS vs. newly identified), hypertension, total cholesterol, HDL cholesterol, and comorbidities. Tibia length was included as a covariate for analyses of calf muscle area because a previous study (36) shows that greater tibia length is associated with greater calf muscle area. Statin use was included as a covariate for analyses of CRP because statin use can lower CRP values. These analyses were next repeated within the subset of participants with Caltrac physical activity data, with and without adjustment for physical activity. Significant associations between blood markers and plantarflexion strength were repeated with additional adjustment for muscle characteristics. This allowed us to determine whether muscle characteristics might be in the causal pathway of associations between elevated blood markers and lower plantarflexion strength. We considered p < 0.05 as the threshold for statistical significance. All statistical analyses were performed using SAS Statistical Software version 9.0 (SAS Inc., Cary, North Carolina).
Results
The average age of the 423 PAD participants was 74.9 ± 8.2 years. Forty-six percent were women and 16.6% were African American. The average ABI was 0.63 ± 0.01. Among participants, 32.1% had diabetes, 16.1% were current smokers, and 57.4% had other clinically evident cardiovascular disease.
There were no significant differences in age, gender, race, ABI, BMI, prevalence of diabetes mellitus, strength measures, or muscle characteristics between participants with (n = 256) and without (n = 167) Caltrac accelerometer data. Accelerometer wearers were average age 74.45 ± 8.25 years versus 75.57 ± 8.10 years for nonwearers (p = 0.170). Among accelerometer wearers versus nonwearers, average prevalences of men were 52.2% versus 56.3% (p = 0.405), and average ABIs were 0.63 ± 0.15 versus 0.62 ± 0.17 (p = 0.585), respectively. Average muscle area was 5,540.1 ± 1,360 cm2 versus 5,297.53 ± 1,445 cm2 (p = 0.09), average muscle percent fat was 10.34 ± 11.42% versus 12.04 ± 13.54% (p = 0.177), and average muscle density was 32.69 ± 4.01 mg/cm3 versus 32.34 ± 4.16 mg/cm3 (p = 0.392) among wearers and nonwearers, respectively.
Figure 1 shows associations between quartiles of each blood marker and calf muscle area, adjusting for age, gender, race, smoking, BMI, tibia length, recruitment cohort, leg symptoms, ABI, statin use (CRP only), total and HDL cholesterol, and comorbidities. Higher levels of D-dimer, CRP, IL-6, and sVCAM-1 were associated with lower calf muscle area (Fig. 1).
Figure 1. Associations Between Blood Marker Quartiles and Calf Muscle Area in Participants With PAD.
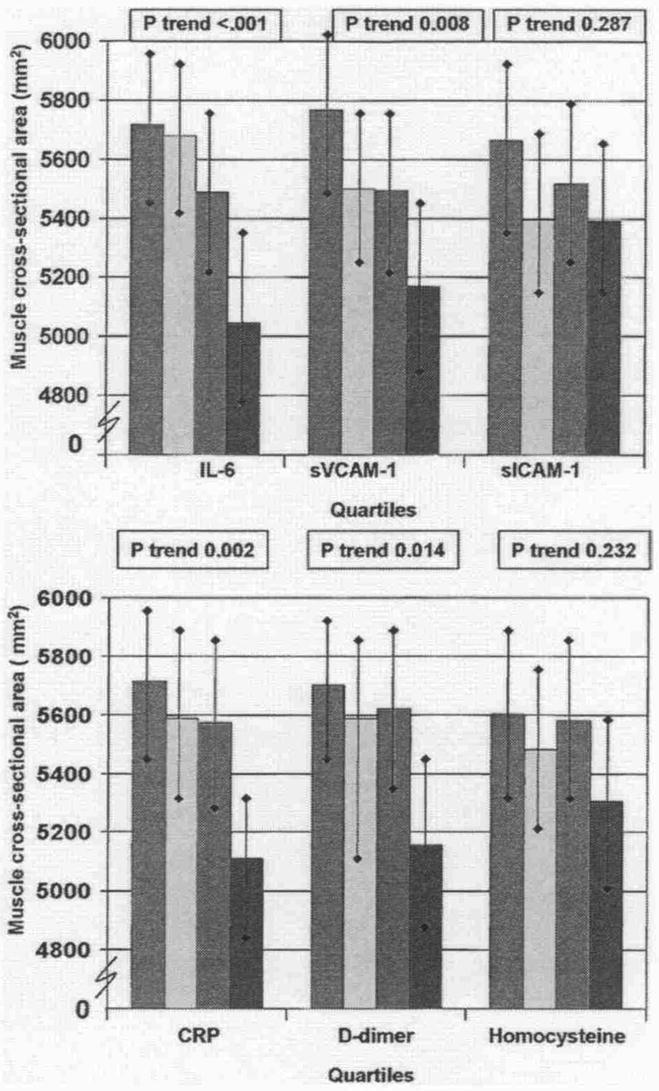
Data are adjusted for age, gender, race, cigarette smoking, body mass index, ankle-brachial index, leg symptoms, recruitment cohort, comorbidities, statin use (C-reactive protein [CRP] only), total cholesterol, high-density lipoprotein cholesterol, hypertension, and tibia length (n = 423). Red bars = first quartile; yellow bars = second quartile; green bars = third quartile; blue bars = fourth quartile. IL = interleukin; PAD = peripheral arterial disease; sICAM-1 = soluble intracellular adhesion molecule; sVCAM-1 = soluble vascular cellular adhesion molecule.
Figure 2 shows associations between each blood marker and calf muscle percent fat, adjusting for confounders. Higher levels of sVCAM-1 and IL-6 were associated significantly with higher calf muscle percent fat. Associations of D-dimer with calf muscle percent fat were nearly statistically significant.
Figure 2. Associations Between Blood Markers and Calf Muscle Percent Fat in Participants With PAD.
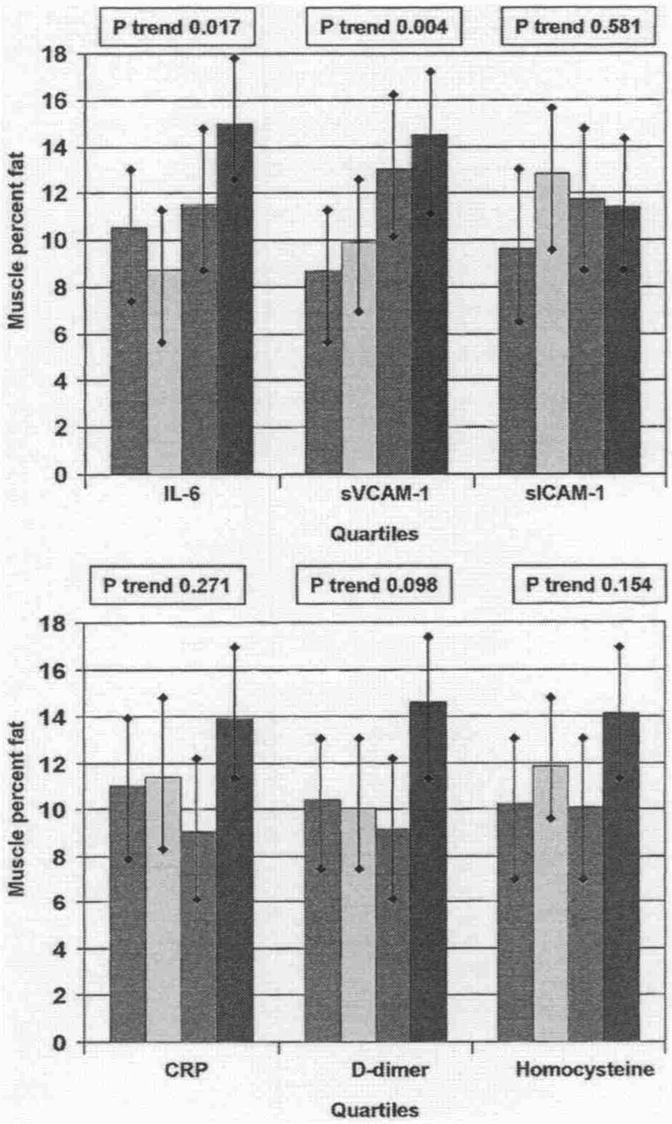
Data are adjusted for age, gender, race, cigarette smoking, body mass index, leg symptoms, ankle-brachial index, recruitment cohort, comorbidities, total cholesterol, high-density lipoprotein cholesterol, hypertension, and statin use (C-reactive protein only) (n = 423). Red bars = first quartile; yellow bars = second quartile; green bars = third quartile; blue bars = fourth quartile. Abbreviations as in Figure 1.
Figure 3 shows associations between each blood marker and calf muscle density, adjusting for confounders. Significant associations were observed between higher levels of D-dimer, sVCAM-1, and homocysteine with lower muscle density, adjusting for confounders.
Figure 3. Associations Between Blood Markers and Calf Muscle Density in Participants With PAD.
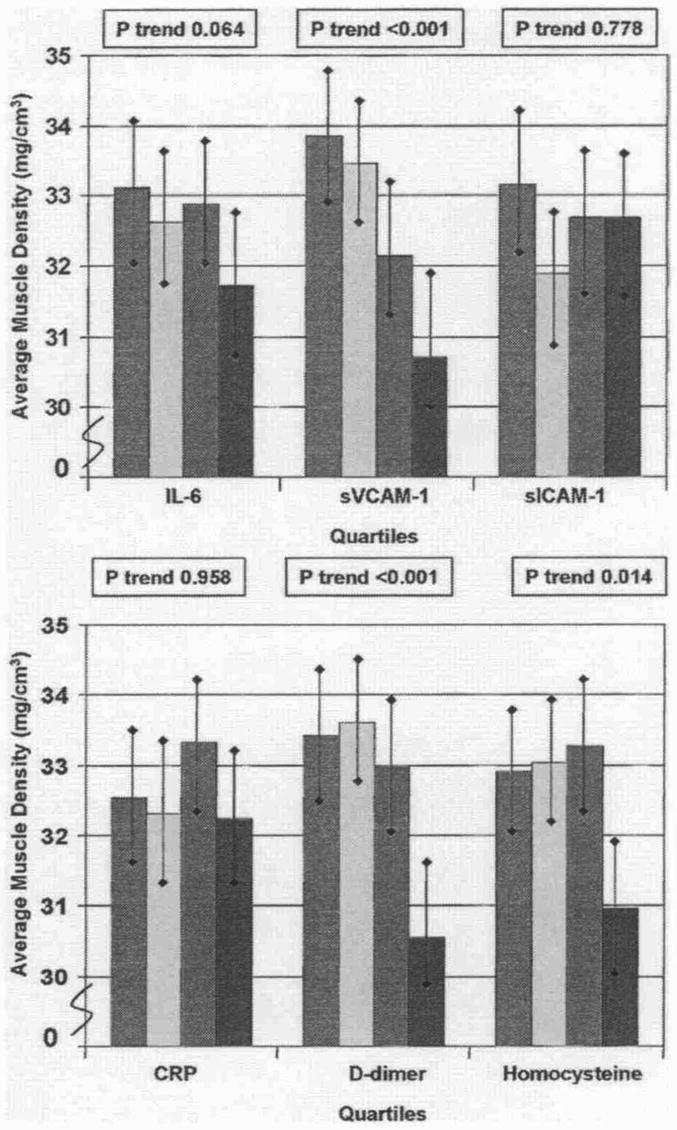
Data are adjusted for age, gender, race, cigarette smoking, body mass index, leg symptoms, ankle-brachial index, recruitment cohort, comorbidities, total cholesterol, high-density lipoprotein cholesterol, hypertension, and statin use (C-reactive protein only) (n = 423). Red bars = first quartile; yellow bars = second quartile; green bars = third quartile; blue bars = fourth quartile. Abbreviations as in Figure 1.
Significant associations were observed between higher levels of sVCAM-1 (p trend = 0.013) with poorer plantarflexion strength, adjusting for age, gender, race, BMI, smoking, comorbidities, ABI, recruitment cohort, total and HDL cholesterol, and leg symptoms (Fig. 4). Associations of higher homocysteine levels with poorer plantarflexion strength were nearly statistically significant (Fig. 4). No significant associations were observed between elevated blood marker levels and grip strength (data not shown).
Figure 4. Associations Between Blood Markers and Plantarflexion Strength in Participants With PAD.
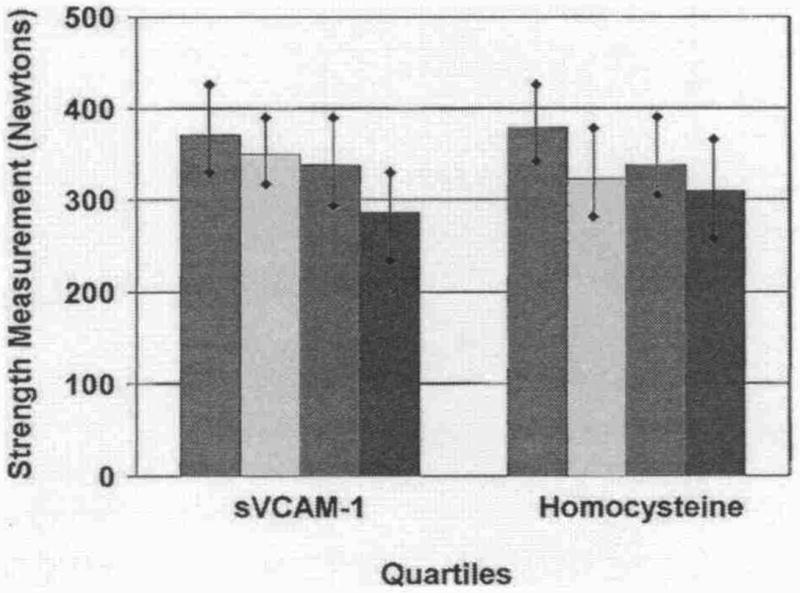
Data are adjusted for age, gender, race, cigarette smoking, body mass index, leg symptoms, ankle-brachial index, recruitment cohort, comorbidities, total cholesterol, high-density lipoprotein cholesterol, and statin use (C-reactive protein only) (n = 403). Red bars = first quartile; yellow bars = second quartile; green bars = third quartile; blue bars = fourth quartile. Abbreviations as in Figure 1.
Table 1 shows results of associations between blood markers levels and calf muscle characteristics in the subset of participants with 7-day physical activity data, adjusting for age, gender, race, BMI, smoking, comorbidities, ABI, recruitment cohort, total and HDL cholesterol, and leg symptoms. Results are presented with and without additional adjustment for physical activity. Most associations between blood markers and calf muscle characteristics remained statistically significant after additional adjustment for physical activity (Table 1).
Table 1. Physical Activity Adjusted Associations of Blood Markers With Muscle Characteristics in Patients With Peripheral Arterial Disease (n = 251).
| Quartile 1 | Quartile 2 | Quartile 3 | Quartile 4 | Trend p Value | |
|---|---|---|---|---|---|
| Calf muscle cross-sectional area | |||||
| CRP (mg/l) | ≤0.89 | 0.89-1.86 | 1.86-3.82 | >3.82 | |
| Without adjustment for physical activity | 5,796 (174) | 5,848 (171) | 5,666 (181) | 5,108 (165) | 0.004 |
| With adjustment for physical activity | 5,767 (171) | 5,846 (168) | 5,684 (177) | 5,121 (162) | 0.005 |
| D-dimer (μg/ml) | ≤0.47 | 0.47-0.66 | 0.66-1.03 | >1.03 | |
| Without adjustment for physical activity | 5,787 (174) | 5,814 (176) | 5,460 (176) | 5,265 (189) | 0.028 |
| With adjustment for physical activity | 5,766 (171) | 5,759 (175) | 5,485 (174) | 5,324 (188) | 0.066 |
| sVCAM-1 (ng/ml) | <843 | 843-1,041 | 1,041-1,331 | > 1,331 | |
| Without adjustment for physical activity | 5,905 (180) | 5,539 (164) | 5,642 (189) | 5,295 (173) | 0.035 |
| With adjustment for physical activity | 5,849 (178) | 5,519 (161) | 5,644 (186) | 5,368 (173) | 0.110 |
| sICAM-1 (ng/ml) | ≤247 | 247-292 | 292-349 | >349 | |
| Without adjustment for physical activity | 5,642 (188) | 5,366 (178) | 5,821 (180) | 5,552 (177) | 0.924 |
| With adjustment for physical activity | 5,624 (185) | 5,403 (176) | 5,743 (179) | 5,608 (175) | 0.780 |
| Interleukin-6 (pg/ml) | ≤1.78 | 1.78-2.60 | 2.60-4.54 | >4.54 | |
| Without adjustment for physical activity | 5,938 (166) | 5,626 (171) | 5,878 (166) | 4,885 (168) | <0.001 |
| With adjustment for physical activity | 5,915 (165) | 5,640 (169) | 5,837 (166) | 4,940 (168) | 0.001 |
| Homocysteine (μmol/l) | <0.843 | 0.843-10.76 | 10.76-13.51 | >13.51 | |
| Without adjustment for physical activity | 5,797 (174) | 5,556 (188) | 5,713 (175) | 5,272 (183) | 0.098 |
| With adjustment for physical activity | 5,792 (171) | 5,536 (185) | 5.688 (172) | 5,320 (181) | 0.131 |
| Calf muscle percent fat | |||||
| CRP (mg/l) | ≤0.89 | 0.89-1.86 | 1.86-3.82 | >3.82 | |
| Without adjustment for physical activity | 9.97% (1.75) | 8.88% (1.72) | 9.11% (1.82) | 14.55% (1.66) | 0.056 |
| With adjustment for physical activity | 10.26% (1.72) | 8.88% (1.68) | 8.95% (1.78) | 14.55% (1.63) | 0.078 |
| D-dimer (μg/ml) | ≤0.47 | 0.47-0.66 | 0.66-1.03 | >1.03 | |
| Without adjustment for physical activity | 10.22% (1.70) | 8.38% (1.72) | 10.73% (1.72) | 12.60% (1.86) | 0.278 |
| With adjustment for physical activity | 10.43% (1.68) | 8.88% (1.71) | 10.50% (1.70) | 12.04% (1.85) | 0.474 |
| sVCAM-1 (ng/ml) | <843 | 843-1,041 | 1,041-1,331 | >1,331 | |
| Without adjustment for physical activity | 8.57% (1.79) | 9.81% (1.63) | 11.11% (1.88) | 13.78% (1.72) | 0.034 |
| With adjustment for physical activity | 9.10% (1.78) | 10.00% (1.61) | 11.09% (1.86) | 13.08% (1.72) | 0.106 |
| sICAM-1 (ng/ml) | ≤247 | 247-292 | 292-349 | >349 | |
| Without adjustment for physical activity | 10.17% (1.86) | 12.01% (1.76) | 9.20% (1.79) | 11.76% (1.76) | 0.748 |
| With adjustment for physical activity | 10.35% (1.83) | 11.64% (1.74) | 9.94% (1.79) | 11.24% (1.75) | 0.876 |
| Interleukin-6 (pg/ml) | ≤1.78 | 1.78-2.60 | 2.60-4.54 | >4.54 | |
| Without adjustment for physical activity | 9.22% (1.70) | 9.80% (1.74) | 7.91% (1.70) | 16.43% (1.71) | 0.013 |
| With adjustment for physical activity | 9.46% (1.68) | 9.65% (1.73) | 8.34% (1.69) | 15.87% (1.71) | 0.025 |
| Homocysteine (μmol/l) | <0.843 | 0.843-10.76 | 10.76-13.51 | >13.51 | |
| Without adjustment for physical activity | 8.61% (1.69) | 11.62% (1.86) | 9.03% (1.73) | 14.54% (1.79) | 0.065 |
| With adjustment for physical activity | 8.67% (1.67) | 11.80% (1.83) | 9.26% (1.70) | 14.07% (1.77) | 0.091 |
| Calf muscle density (gm/cm3) | |||||
| CRP (mg/l) | ≤0.89 | 0.89-1.86 | 1.86-3.82 | >3.82 | |
| Without adjustment for physical activity | 32.75 (0.62) | 33.24 (0.61) | 32.60 (0.64) | 32.26 (0.59) | 0.437 |
| With adjustment for physical activity | 32.65 (0.61) | 33.24 (0.60) | 32.66 (0.63) | 32.31 (0.58) | 0.536 |
| D-dimer (μg/ml) | ≤0.47 | 0.47-0.66 | 0.66-1.03 | >1.03 | |
| Without adjustment for physical activity | 33.51 (0.58) | 34.05 (0.59) | 32.55 (0.59) | 30.63 (0.63) | 0.001 |
| With adjustment for physical activity | 33.46 (0.58) | 33.92 (0.59) | 32.61 (0.59) | 30.77 (0.64) | 0.002 |
| sVCAM-1 (ng/ml) | <843 | 843-1,041 | 1,041-1,331 | >1,331 | |
| Without adjustment for physical activity | 33.95 (0.59) | 33.73 (0.54) | 32.71 (0.62) | 30.40 (0.57) | <0.001 |
| With adjustment for physical activity | 33.81 (0.59) | 32.68 (0.54) | 32.72 (0.62) | 30.58 (0.57) | <0.001 |
| sICAM-1 (ng/ml) | ≤247 | 247-292 | 292-349 | >349 | |
| Without adjustment for physical activity | 32.70 (0.65) | 32.28 (0.61) | 33.18 (0.62) | 32.67 (0.61) | 0.844 |
| With adjustment for physical activity | 32.64 (0.64) | 32.40 (0.60) | 32.94 (0.62) | 32.84 (0.61) | 0.720 |
| Interleukin-6 (pg/ml) | ≤1.78 | 1.78-2.60 | 2.60-4.54 | >4.54 | |
| Without adjustment for physical activity | 33.74 (0.60) | 31.87 (0.62) | 33.38 (0.60) | 31.68 (0.61) | 0.085 |
| With adjustment for physical activity | 33.66 (0.60) | 31.92 (0.61) | 33.22 (0.60) | 31.88 (0.61) | 0.143 |
| Homocysteine (μmol/l) | <0.843 | 0.843-10.76 | 10.76-13.51 | >13.51 | |
| Without adjustment for physical activity | 33.16 (0.57) | 33.26 (0.63) | 33.72 (0.59) | 30.59 (0.61) | 0.015 |
| With adjustment for physical activity | 33.14 (0.57) | 33.21 (0.62) | 33.66 (0.58) | 30.73 (0.60) | 0.021 |
Data shown are means and standard errors. Data are adjusted for age, gender, race, cigarette smoking, body mass index, leg symptoms, recruitment cohort (original WALCS vs. newly Identified), ankle-brachial Index, total cholesterol, high-density lipoprotein cholesterol, and comorbidities. Data shown are only for participants with Caltrac (Muscle Dynamics Rtness Network, Inc., Rocklin, California) physical activity data.
CRP = C reactive protein: sICAM-1 = soluble intracellular adhesion molecule; sVCAM-1 = soluble vascular cellular adhesion molecule; WALCS = Walking and Leg Circulation Study.
Table 2 shows associations of sVCAM-1 and homocysteine with plantarflexion strength after additional adjustment for calf muscle area, calf muscle percent fat, and calf muscle density. These analyses help elucidate whether calf muscle characteristics may be in the causal pathway for associations of blood marker levels with isometric strength. The significant association of sVCAM-1 and the nearly statistically significant association of homocysteine with plantarflexion strength were attenuated after additional combined adjustment for muscle area, muscle density, and muscle fat percent (Table 2). Results suggest that calf muscle characteristics may be in the causal pathway from elevated blood marker levels to lower plantarflexion strength.
Table 2. Associations of Vascular Cellular Adhesion Molecule-1 and Homocysteine With Plantarflexion Strength in Persons With Peripheral Arterial Disease, With and Without Adjustment for Calf Muscle Characteristics (n = 403)*.
| Quartile 1 | Quartile 2 | Quartile 3 | Quartile 4 | Trend p Value | |
|---|---|---|---|---|---|
| sVCAM-1 (ng/ml) | ≤857 | 857-1,075 | 1,075-1,361 | >1,361 | |
| Associations with plantarflexion strength (Model I) (newtons) | 372.00 (21.89) | 349.89 (20.19) | 338.61 (21.95) | 286.38 (23.75) | 0.013 |
| Model I with additional adjustment for calf muscle area (newtons) | 364.59 (22.52) | 347.64 (20.04) | 329.42 (22.30) | 294.94 (24.25) | 0.036 |
| Model I with additional adjustment for calf muscle percent fat (newtons) | 366.77 (22.84) | 347.75 (20.31) | 333.85 (22.63) | 287.11 (24.42) | 0.022 |
| Model I with additional adjustment for calf muscle density (newtons) | 365.33 (22.88) | 342.86 (20.53) | 335.81 (22.68) | 293.31 (24.84) | 0.049 |
| Model I with additional adjustment for all calf muscle characteristics (newtons) | 363.74 (22.65) | 345.42 (20.43) | 329.41 (22.55) | 299.04 (24.81) | 0.06 |
| Homocysteine (μmol/l) | ≤8.58 | 8.58-10.83 | 10.83-13.66 | >13.66 | |
| Associations with plantarflexion strength (Model I) (newtons) | 379.12 (20.80) | 323.62 (23.34) | 337.82 (20.73) | 309.76 (22.81) | 0.05 |
| Model I with additional adjustment for calf muscle area (newtons) | 365.91 (21.47) | 318.61 (23.14) | 342.60 (21.05) | 312.17 (23.46) | 0.186 |
| Model I with additional adjustment for calf muscle percent fat (newtons) | 373.97 (21.59) | 319.54 (23.55) | 338.93 (21.35) | 305.70 (23.72) | 0.074 |
| Model I with additional adjustment for calf muscle density (newtons) | 373.64 (21.51) | 315.97 (23.61) | 337.39 (21.26) | 311.63 (24.01) | 0.107 |
| Model I with additional adjustment for all calf muscle characteristics (newtons) | 365.14 (21.51) | 316.72 (23.34) | 341.82 (21.10) | 316.01 (23.82) | 0.235 |
Data shown are means and standard errors. Model I adjusts for age, gender, race, body mass index, smoking, comorbidities, total cholesterol, high-density lipoprotein cholesterol, the ankle-brachial index, leg symptoms, and the recruitment cohort.
sVCAM-1 = soluble vascular cellular adhesion molecule 1.
Discussion
Mechanisms of functional impairment and decline in patients with PAD are not well understood. Although elevated levels of inflammation and D-dimer are associated with greater functional impairment and faster functional decline in persons with PAD (9,10), mechanisms of these associations are unknown.
Among 423 men and women with PAD, results reported here show, for the first time, that higher levels of inflammatory markers and D-dimer are associated with smaller calf muscle area and lower calf muscle density. Higher levels of homocysteine were associated with reduced calf muscle density, and elevated sVCAM-1 and IL-6 were associated with higher calf muscle percent fat. Most of these associations remained statistically significant after additional adjustment for physical activity levels. These associations may contribute to previously established associations of elevated biomarkers and functional impairment and functional decline in PAD.
Prior animal studies and studies in persons without PAD suggest that inflammatory cytokines directly alter muscle homeostasis by inhibiting repair after muscle tissue injury and by promoting muscle proteolysis (2–5). These associations may explain associations of elevated CRP, IL-6, and sVCAM-1 with more adverse calf muscle characteristics. Further, both D-dimer and homocysteine can induce inflammatory responses, and this may account for associations of elevated D-dimer and homocysteine with more adverse muscle characteristics (11–14,37). D-dimer promotes neutrophil and monocyte activation, including secretion of IL-6 (11–14). Anhydrous thiolactone, derived from homocysteine, is a potent inducer of inflammation (37). Alternatively, results reported here may result from associations of higher biomarker levels with greater atherosclerosis in the superficial femoral artery. In support of this latter hypothesis, previous study demonstrates that lower ABI values are associated independently with more adverse calf muscle characteristics (38), and higher levels of inflammation, D-dimer, and homocysteine are associated with more severe atherosclerosis (6,39). Although our analyses adjusted for the ABI, the ABI is an imperfect measure of the degree of lower extremity atherosclerosis.
Although associations of sVCAM-1, sICAM-1, D-dimer, and IL-6 with the 3 calf skeletal muscle characteristic were generally consistent for each of these biomarkers, not all associations for the remaining biomarkers were consistent across the 3 calf measurements. Reasons for this latter phenomenon are unclear. However, determinants of each calf muscle characteristic may be variable. Further study is needed to continue to identify biologic characteristics associated with calf muscle outcome in PAD.
This study is limited by its cross-sectional design. Associations reported here may not be causal and should not be taken as definitive evidence that muscle characteristics are in the causal pathway between elevated blood markers and lower plantarflexion strength. Second, our measures did not include CT assessment of skeletal muscle characteristics in the upper extremities. We cannot rule out the possibility that elevated biomarker levels are also associated with more adverse CT-assessed upper extremity muscle characteristics, which would suggest a systemic association of elevated biomarkers with adverse skeletal muscle characteristics. Finally, we considered a p value <0.05 indicative of statistical significance because this study is the first to assess associations of blood markers with calf muscle characteristics in persons with PAD, and we aimed to ensure that we did not miss meaningful associations of blood markers with calf muscle characteristics. However, a more conservative approach employing Bonferroni adjustment and a corresponding p value <0.005 criterion for statistical significance would have resulted in slightly fewer statistically significant findings.
Conclusions
Among persons with PAD, increased levels of inflammatory markers, D-dimer, and homocysteine are associated with adverse calf muscle characteristics in persons with PAD. Elevated levels of inflammation and homocysteine are associated with lower isometric plantar flexion strength. Prospective study is needed to identify mechanisms of functional decline in persons with PAD and to determine whether blood marker-associated adverse calf muscle characteristics are in the causal pathway of functional impairment and decline in persons with PAD.
Acknowledgments
Supported by grants R01-HL58099, R01-HL64739, R01-HL71223, and R01-HL076298 from the National Heart, Lung, and Blood Institute and by grant #RR-00048 from the National Center for Research Resources, National Institutes of Health (NIH). Supported in part by the Intramural Research Program, National Institute on Aging, NIH. Dr. Ridker is a co-inventor of the assay used for analyzing C-reactive protein. R. Wayne Alexander served as Guest Editor for this article.
Abbreviations and Acronyms
- ABI
ankle-brachial index
- BMI
body mass index
- CRP
C-reactive protein
- CT
computed tomography
- ELISA
enzyme-linked immunosorbent assay
- HDL
high-density lipoprotein
- IL
interleukin
- PAD
peripheral arterial disease
- slCAM-1
soluble intracellular adhesion molecule
- sVCAM-1
soluble vascular cellular adhesion molecule
References
- 1.Mitch WE, Goldberg AL. Mechanism of muscle wasting: the role of ubiquitin-proteasome pathway. N Engl J Med. 1996;335:1897–905. doi: 10.1056/NEJM199612193352507. [DOI] [PubMed] [Google Scholar]
- 2.Charters Y, Grimble RF. Effect of recombinant human tumor necrosis factor alpha on protein synthesis in liver, skeletal muscle and skin of rats. Biochem J. 1989;258:493–7. doi: 10.1042/bj2580493. [DOI] [PMC free article] [PubMed] [Google Scholar]
- 3.Goodman MN. Tumor necrosis factor induces skeletal muscle protein breakdown in rats. Am J Physiol. 1991;260:E727–30. doi: 10.1152/ajpendo.1991.260.5.E727. [DOI] [PubMed] [Google Scholar]
- 4.Goodman MN. Interleukin-6 induces skeletal muscle protein breakdown in rats. Proc Soc Exp Biol Med. 1994;205:182–5. doi: 10.3181/00379727-205-43695. [DOI] [PubMed] [Google Scholar]
- 5.Visser M, Pahor M, Taaffe DR, et al. Relationship of interleukin-6 and rumor necrosis factor-α with muscle mass and muscle strength in elderly men and women: the health ABC study. J Gerontol A Biol Sci Med Sci. 2002;57:M326–32. doi: 10.1093/gerona/57.5.m326. [DOI] [PubMed] [Google Scholar]
- 6.McDermott MM, Green D, Greenland P, et al. Relation of levels of hemostatic factors and inflammatory markers to the ankle brachial index. Am J Cardiol. 2003;92:194–9. doi: 10.1016/s0002-9149(03)00537-x. [DOI] [PubMed] [Google Scholar]
- 7.McDermott MM, Guralnik JM, Corsi A, et al. Patterns of inflammation associated with peripheral arterial disease: the InCHIANTI study. Am Heart J. 2005;150:276–81. doi: 10.1016/j.ahj.2004.09.032. [DOI] [PubMed] [Google Scholar]
- 8.McDermott MM, Greenland P, Liu K, et al. The ankle brachial index is associated with leg function and physical activity: the Walking and Leg Circulation Study. Ann Intern Med. 2002;136:873–83. doi: 10.7326/0003-4819-136-12-200206180-00008. [DOI] [PubMed] [Google Scholar]
- 9.McDermott MM, Greenland P, Green D, et al. D-dimer, inflammatory markers, and lower extremity functioning in patients with and without peripheral arterial disease. Circulation. 2003;107:191–8. doi: 10.1161/01.CIR.0000074227.53616.CC. [DOI] [PubMed] [Google Scholar]
- 10.McDermott MM, Ferrucci L, Liu K, et al. D-dimer and inflammatory markers as predictors of functional decline in men and women with and without peripheral arterial disease. J Am Geriatr Soc. 2005;53:1688–96. doi: 10.1111/j.1532-5415.2005.53510.x. [DOI] [PubMed] [Google Scholar]
- 11.Robson SC, Shephard EG, Kirsch RE. Fibrin degradation product D-dimer induces the synthesis and release of biologically active IL-1 beta, IL-6 and plasminogen activator inhibitors from monocytes in vitro. Br J Haematol. 1994;86:322–6. doi: 10.1111/j.1365-2141.1994.tb04733.x. [DOI] [PubMed] [Google Scholar]
- 12.Rao KMK, Pieper CS, Currie MS, Cohen HJ. Variability of plasma IL-6 and crosslinked fibrin D-dimer over time in community dwelling elderly subjects. Am J Clin Pathol. 1994;102:802–5. doi: 10.1093/ajcp/102.6.802. [DOI] [PubMed] [Google Scholar]
- 13.Shorr AF, Thomas SJ, Alkins SA, Fitzpatrick TM, Ling GS. D-dimer correlates with proinflammatory cytokine levels and outcomes in critically ill patients. Chest. 2002;121:1262–8. doi: 10.1378/chest.121.4.1262. [DOI] [PubMed] [Google Scholar]
- 14.Edgington TS, Curtiss LK, Plow EF. A linkage between the haemostatic and immune systems embodied in the fibrinolytic release of lymphocytic suppressive peptides. J Immunol. 1985;134:471–7. [PubMed] [Google Scholar]
- 15.Xu D, Neville R, Finkel T. Homocysteine accelerates endothelial cell senescence. FEBS Lett. 2000;470:20–4. doi: 10.1016/s0014-5793(00)01278-3. [DOI] [PubMed] [Google Scholar]
- 16.Kado DM, Bucur A, Selhub J, Rowe JW, Seeman T. Homocysteine levels and decline in physical function: MacArthur Studies of Successful Aging. Am J Med. 2002;113:537–42. doi: 10.1016/s0002-9343(02)01269-x. [DOI] [PubMed] [Google Scholar]
- 17.McDermott MM, Liu K, Greenland P, et al. Functional decline in peripheral arterial disease: associations with the ankle brachial index and leg symptoms. JAMA. 2004;292:453–61. doi: 10.1001/jama.292.4.453. [DOI] [PubMed] [Google Scholar]
- 18.Newman AB, Siscovick DS, Manolio TA, et al. Ankle-arm index as a marker of atherosclerosis in the Cardiovascular Health Study. Circulation. 1993;88:837–45. doi: 10.1161/01.cir.88.3.837. [DOI] [PubMed] [Google Scholar]
- 19.McDermott MM, Liu K, Criqui MH, et al. Ankle-brachial index and subclinical cardiac and carotid disease: the Multi-Ethnic Study of Atherosclerosis. Am J Epidemiol. 2005;162:33–41. doi: 10.1093/aje/kwi167. [DOI] [PubMed] [Google Scholar]
- 20.McDermott MM, Criqui MH, Guralnik JM, et al. Lower ankle brachial index, as calculated by averaging the dorsalis pedis and posterior tibial arterial pressures, and associations with functioning in peripheral arterial disease. J Vasc Surg. 2000;32:1164–71. doi: 10.1067/mva.2000.108640. [DOI] [PubMed] [Google Scholar]
- 21.Shadman R, Criqui MH, Bundens WP, et al. Subclavian artery stenosis: prevalence, risk factors, and association with cardiovascular diseases. J Am Coll Cardiol. 2004;44:618–23. doi: 10.1016/j.jacc.2004.04.044. [DOI] [PubMed] [Google Scholar]
- 22.McDermott MM, Guralnik JM, Albay M, et al. Impairments of muscles and nerves associated with peripheral arterial disease and their relationship with lower extremity functioning: the InCHIANTI Study. J Am Geriatr Soc. 2004;52:405–10. doi: 10.1111/j.1532-5415.2004.52113.x. [DOI] [PubMed] [Google Scholar]
- 23.Mitsiopoulos N, Baumgartner RN, Heymsfield SB, et al. Cadaver validation of skeletal muscle measurement by magnetic resonance imaging and computerized tomography. J Appl Physiol. 1999;86:1097–8. doi: 10.1152/jappl.1998.85.1.115. [DOI] [PubMed] [Google Scholar]
- 24.Curb JD, Ceria-Ulep CD, Rodriguez BL, et al. Performance-based measures of physical function for high-function populations. J Am Geriatr Soc. 2006;54:737–42. doi: 10.1111/j.1532-5415.2006.00700.x. [DOI] [PubMed] [Google Scholar]
- 25.Allain CC, Poon LS, Chan CSG, et al. Enzymatic determination of total serum cholesterol. Clin Chem. 1974;20:470–5. [PubMed] [Google Scholar]
- 26.Sugiuchi H, Ugi Y, Okabe H, et al. Direct measurement of high-density lipoprotein cholesterol in serum with polyethylene glycol-modified enzymes and sulfated a-cyclodextrin. Clin Chem. 1995;41:717–23. [PubMed] [Google Scholar]
- 27.McDermott MM, Liu K, O'Brien E, et al. Measuring physical activity in peripheral arterial disease: a comparison of two physical activity questionnaires with an accelerometer. Angiology. 2000;51:91–100. doi: 10.1177/000331970005100201. [DOI] [PubMed] [Google Scholar]
- 28.McDermott MM, Ohlmiller SM, Liu K, et al. Gait alterations associated with walking impairment in people with peripheral arterial disease with and without intermittent claudication. J Am Geriatr Soc. 2001;49:747–54. doi: 10.1046/j.1532-5415.2001.49151.x. [DOI] [PubMed] [Google Scholar]
- 29.Garg PK, Tian L, Criqui MH, et al. Physical activity during daily life and mortality in patients with peripheral arterial disease. Circulation. 2006;114:242–8. doi: 10.1161/CIRCULATIONAHA.105.605246. [DOI] [PMC free article] [PubMed] [Google Scholar]
- 30.Richardson MT, Leon AS, Jacobs DR, Jr, Ainsworth BE, Serfass R. Ability of the Caltrac accelerometer to assess daily physical activity levels. J Cardiopulm Rehabil. 1995;15:107–13. doi: 10.1097/00008483-199503000-00003. [DOI] [PubMed] [Google Scholar]
- 31.Miller DJ, Freedson PS, Kline GM. Comparison of activity levels using the Caltrac accelerometer and five questionnaires. Med Sci Sports Exerc. 1994;26:376–82. [PubMed] [Google Scholar]
- 32.Criqui MH, Denenberg JO, Bird CE, et al. The correlation between symptoms and non-invasive test results in patients referred for peripheral arterial disease testing. Vasc Med. 1996;1:65–71. doi: 10.1177/1358863X9600100112. [DOI] [PubMed] [Google Scholar]
- 33.Guralnik JM, Fried LP, Simonsick EM, Kasper JD, Lafferty ME. The Women's Health and Aging Study: Health and Social Characteristics of Older Women With Disability. Bethesda, MD: National Institute on Aging; 1995. NIH publication No. 95-4009, appendix E. [Google Scholar]
- 34.Altman R, Alarcon G, Appelrouth D, et al. The American College of Rheumatology criteria for the classification and reporting of osteoarthritis of the hip. Arthritis Rheum. 1991;34:505–14. doi: 10.1002/art.1780340502. [DOI] [PubMed] [Google Scholar]
- 35.Altman R, Asch E, Bloch D, et al. Development of criteria for the classification and reporting of osteoarthritis. Arthritis Rheum. 1986;29:1039–49. doi: 10.1002/art.1780290816. [DOI] [PubMed] [Google Scholar]
- 36.Ruff C. Allometry between length and cross-sectional dimensions of the femur and tibia in homo sapiens. Am J Phys Anthropol. 1984;65:347–58. doi: 10.1002/ajpa.1330650403. [DOI] [PubMed] [Google Scholar]
- 37.Hofmann MA, Lalla E, Gleason MR, et al. Hyperhomocysteinemia enhances vascular inflammation and accelerates atherosclerosis in a murine model. J Clin Invest. 2001;107:675–83. doi: 10.1172/JCI10588. [DOI] [PMC free article] [PubMed] [Google Scholar]
- 38.McDermott MM, Hoff F, Ferrucci L, et al. Lower extremity ischemia, calf skeletal muscle characteristics, and functional impairment in peripheral arterial disease. J Am Geriatr Soc. 2007;55:400–6. doi: 10.1111/j.1532-5415.2007.01092.x. [DOI] [PMC free article] [PubMed] [Google Scholar]
- 39.Welch GN, Loscalzo J. Homocysteine and atherothrombosis. N Engl J Med. 1998;338:1042–50. doi: 10.1056/NEJM199804093381507. [DOI] [PubMed] [Google Scholar]