Abstract
We have investigated the intervesicular transfer of galactosylceramide between unilamellar bilayer vesicles composed of differing sphingomyelin and phosphatidylcholine molar ratios. To monitor glycolipid transfer from donor to acceptor vesicles, we used a fluorescence resonance energy transfer assay involving anthrylvinyl-labeled galactosylceramide (AV-GalCer) and perylenoyl-labeled triglyceride. The transfer was mediated by glycolipid transfer protein (GLTP), purified from bovine brain and specific for glycolipids. The initial transfer rate and the total accessible pool of glycolipid in the donor vesicles were both measured. An increase in the sphingomyelin content of 1-palmitoyl-2-oleoyl phosphatidylcholine (POPC) vesicles decreased the transfer rate in a nonlinear fashion. Decreased transfer rates were clearly evident at sphingomyelin mole fractions of 0.22 or higher. The pool of AV-GalCer available for GLTP-mediated transfer also was smaller in vesicles containing high sphingomyelin content. In contrast, AV-GalCer was more readily transferred from vesicles composed of POPC and different disaturated phosphatidylcholines. Our results show that GLTP acts as a sensitive probe for detecting interactions of glycosphingolipids with neighboring lipids and that the lateral mixing of glycolipids is probably affected by the matrix lipid composition. The compositionally driven changes in lipid interactions, sensed by GLTP, occur in membranes that are either macroscopically fluid-phase or gel/fluid-phase mixtures. Gaining insights into how changes in membrane sphingolipid composition alter accessibility to soluble proteins with affinity for membrane glycolipids is likely to help increase our understanding of how sphingolipid-enriched microdomains (i.e., “rafts” and caveolae) are formed and maintained in cells.
Sphingolipids constitute an important class of membrane lipids among eukaryotes. Recognition events between complex glycosphingolipids (GSLs) 1 and glycoproteins are thought to be required for tissue differentiation in higher eukaryotes and for other specific cell interactions (1). Certain stimuli, like stress or receptor activation, give rise to a wide variety of sphingolipid second messengers which affect the cell cycle (2). GSLs act as cell surface receptors for hormones, bacterial toxins, and viruses (3). They are also enriched in plasma membrane caveolae (4) and are thought to be components of segregated lateral lipid microdomains called rafts (5).
GSLs contain a hydrophobic region composed of sphingosine with an amide-linked acyl chain (i.e., ceramide) and a hydrophilic sugar moiety. The variations in GSL head-groups are great, ranging from single monohexoses such as glucose or galactose to complex multiple sugar moieties such as those found in the ganglioside family. Naturally occurring cerebrosides, like bovine brain galactosylceramide (GalCer), 2 contain mostly long-chain fatty acids (C24:0, C24:1, and C18:0) and undergo chain-melting transitions at relatively high temperatures (70–80 °C). The order-to-disorder transition temperatures (Tm) of cerebrosides are not dominated by the length of the amide-linked-acyl chains. In contrast, phosphatidylcholines (PC) show thermal behavior that depends highly on acyl chain length. The Tm of sphingomyelins (SPMs) also depends on acyl chain length, although the dependence appears to be weaker than that of PCs (6–8). This may be due to sphingolipids containing both hydroxy and amide functional groups that can act as hydrogen-bond acceptors and donors to help stabilize lipid-lipid interactions (9). In contrast, glycerol-based phospholipids such as PCs contain two ester-linked fatty acids that can act only as hydrogen-bond acceptor sites. The preceding structural features significantly influence sphingolipid physical behavior in model membranes and have led to the idea that sphingolipid-enriched microdomains arise because of differential miscibility within the bilayer matrix (10, 11). Recent elaboration and extensions of these ideas, involving an essential role for cholesterol, are illustrated by “sphingolipid-sterol rafts” or microdomains (12–16).
Resistance to detergent solubilization is an investigative approach that has been used to isolate putative raft lipids and proteins (17, 18). On the basis of this criteria, GSLs appear to localize to cellular rafts (19) and have been used as microdomain markers in model and cell membranes (10, 20). Inherent in the GSL “marker” approach is the assumption that lipids near marker GSLs preferentially interact to form a microdomain. Yet, localization of GSL markers generally relies on reporter derivatives (e.g., fluorescent) with inherent optical limitations or on reporter proteins which are 2 orders of magnitude larger than the GSL itself. Given such limitations, current semiquantitative estimates depict rafts as relatively small groupings of only a few hundred lipids. Because of their putative small size under physiological conditions, proving the existence of these lipid-derived micro- and nanodomains is extremely challenging, as is evidenced by the controversy surrounding raft existence in cell membranes (21–23). Adding to the challenge is a rich history of glycolipid “crypticity” characterized by the limited accessibility of antibodies to glycolipids in biomembranes (24–28). Thus, there is a need for new approaches that can provide insights into sphingolipid-lipid interactions in membranes.
Here, we use a small soluble protein that can selectively transfer glycolipids to other membranes (i.e., glycolipid transfer protein (GLTP)) to investigate the molecular interactions of a representative monohexosylceramide, GalCer, within different surrounding lipids. The ability of GLTPs to catalyze the in vitro transfer of GSLs and glycoglycerolipids between donor and acceptor membranes is well-established (29–32). This kinetic-based approach is advantageous because GLTP’s interaction with the membrane is transient and is thought to involve a single glycolipid binding site on the protein (33). Thus, the drawbacks of using high-affinity marker proteins to bind GSLs in the membranes associated can be avoided. Such proteins include GSL-specific lectins, toxins, or antibodies. Their tight association with glycolipids in membranes often shields or occludes nearby GSL binding sites (10, 11) and, along with multivalency and protein–protein interactions, causes complex binding behavior as the amount of adsorbed protein increases.
To gain insights into GSL mixing behavior at nanoscale dimensions, we studied GalCer accessibility to GLTP upon mixing with either PC or SPM or with different mole fractions of these lipids. These matrix lipids were chosen because of reports suggesting differences in their mixing behavior with GSLs (34–36). Here, we show that GLTP-mediated GalCer intermembrane transfer is substantially diminished as the bilayer matrix content of SPM increases in SPM/PC mixtures. The results suggest stronger lipid-lipid interactions between the glycolipid and SPM. Aside from showing the usefulness of GLTP as an in vitro tool to evaluate glycolipid–lipid interactions, gaining insights into how GLTP responds to GSL lateral mixing with various membrane lipids may help identify potential ways in which the assembly of sphingoid-based microdomains occurs in biomembranes. Although GLTPs are widely distributed among various organisms and tissues (37), their in vivo function remains enigmatic.
EXPERIMENTAL PROCEDURES
Lipids
1-Palmitoyl-2-oleoylphosphatidylcholine (C18:0/C18:1cΔ9; POPC), bovine brain sphingomyelin (46% C18: 0, 7% C22:0, and 47% other; bovine brain SPM), milk sphingomyelin (20% C24:0, 18% C20:0, 16% C16:0, and 46% other; milk SPM), palmitoyl sphingomyelin (100% C16:0 and 16:0 SPM), and myristoyl sphingomyelin (100% C14:0 and 14:0 SPM) were all from Avanti Polar Lipids (Alabaster, AL). The fluorescent probes, N-[(11E)-12-(9-anthryl)-11-dodecenoyl]-1-O-β-galactosylsphingosine [AV-GalCer] and rac-1,2-dioleoyl-3-[9-(3-perylenoyl) nonanoyl]-glycerol [Per-TG] were prepared as described earlier (38, 39). The concentration of the different phospholipids was determined by the Bartlett method (40), and the probes were determined gravimetrically, which we found to agree well with determinations based on the molar extinction coefficient.
GLTP
GLTP from bovine brain was purified to homogeneity, as described earlier (29).
Preparation of Phospholipid Vesicles
Donor vesicles consisting of SPM or PC and the fluorescent probes AV-GalCer and Per-TG, were prepared by the rapid ethanol injection technique (41, 42). The effectiveness of this approach for generating donor vesicles with different PC compositions in conjunction with fluorescent studies of lipid intervesicular transfer has been previously demonstrated (43). Phospholipids were mixed with 1% AV-GalCer and 1.5% Per-TG from stock solutions in 95:5 hexane/ethanol (Burdick & Jackson Lab., Muskegon, MI) and dried under nitrogen. The mixtures were stored at −20 °C and redissolved immediately before use in absolute ethanol that had been previously double-distilled over KOH. The mixture (5 µL, 40 nmol) was rapidly injected with a 25 µL Hamilton syringe into a 10 mM sodium phosphate buffer (pH 7.4, containing 1mM dithiothreitol, 1 mM EDTA, and 0.02% NaN3) under rapid stirring at 37 °C. The final concentration of the donor vesicles per assay was 13 µM, and the ethanol concentration was less than 0.2%. The final concentration of AV-GalCer in each assay was 0.13 µM. Previous studies have shown that monohexosylceramides are accommodated within PC vesicles up to about 25 mol % (11) and triolein up to 3 mol % (44) without affecting vesicle integrity. In our case, only 1 mol % AV-GalCer and 1.5 mol % Per-TG were used in the donor vesicles.
The acceptor vesicles were prepared by sonication (45). POPC, dissolved in chloroform or 3:2 hexane/2-propanol (v/v), was dried under vacuum and suspended by vortexing in the same sodium phosphate buffer to a concentration of 50 mM. The suspension was sonicated with a Heat Systems-Ultrasonics W-225 sonifier on ice and then centrifuged for 90 min at 100 000g to remove titanium probe particles, multilamellar vesicles, and undispersed lipid. The radii of the vesicle populations reportedly averaged 110–125 Å (41).
Fluorescence Resonance Energy Transfer (FRET) Assay for Monitoring Protein-Mediated Glycolipid Intermembrane Transfer
The FRET method used for measuring the transfer of glycolipid between two bilayer vesicle populations has been thoroughly described previously (31). All fluorescence measurements were carried out using a SPEX Fluoromax instrument (Instruments SA, Inc., Edina, NJ). The excitation and emission band-pass were 5 nm and the sample cuvette holder was temperature controlled to 37 ± 0.1 °C (Neslab, RTE-111, Neslab Instruments, Portsmouth, NH). Briefly, the excitation spectra of AV-GalCer in POPC occurs between 330 and 410 nm with peaks near 370 and 390 nm, whereas the emission spectrum occurs between 390 and 485 nm with peaks near 415 and 430 nm. The excitation spectra of Per-TG in POPC overlaps the emission of AV-GalCer with a broad maximum peak near 450 nm, whereas the emission spectrum occurs between 470 and 590 nm with a broad maximum peak near 515 nm (31). As a result, when excited at 370 nm, nearly complete quenching of AV-GalCer occurs in donor vesicles containing nontransferable Per-TG. Addition of POPC acceptor vesicles in a 10-fold excess and GLTP results in increasing AV-GalCer fluorescence and diminishing Per-TG fluorescence as quenching relief occurs because of the separation of the FRET pair as of AV-GalCer is transferred to the acceptor vesicles. Because of this spectral response, the kinetics of AV-GalCer intermembrane transfer could be determined continuously by monitoring the increase in AV fluorescence at 425 nm (31, 32).
Calculations of the Transfer Rates
Our calculations of AV-GalCer transfer rates are based on the following considerations. We assume that, at donor-to-acceptor vesicle ratios of 1:10, GLTP can access 90.9% of the AV-GalCer in the outer leaflet and transfer it to the acceptor vesicle population but that AV-GalCer in the inner leaflet is not accessible to GLTP (32). The flip-flop, or the transmembrane movement of GalCer from one leaflet of the bilayer to the other, is very slow and close to undetectable (46). The spontaneous transfer of GalCer monomers through the aqueous phase also is very slow (>20 h) (47).
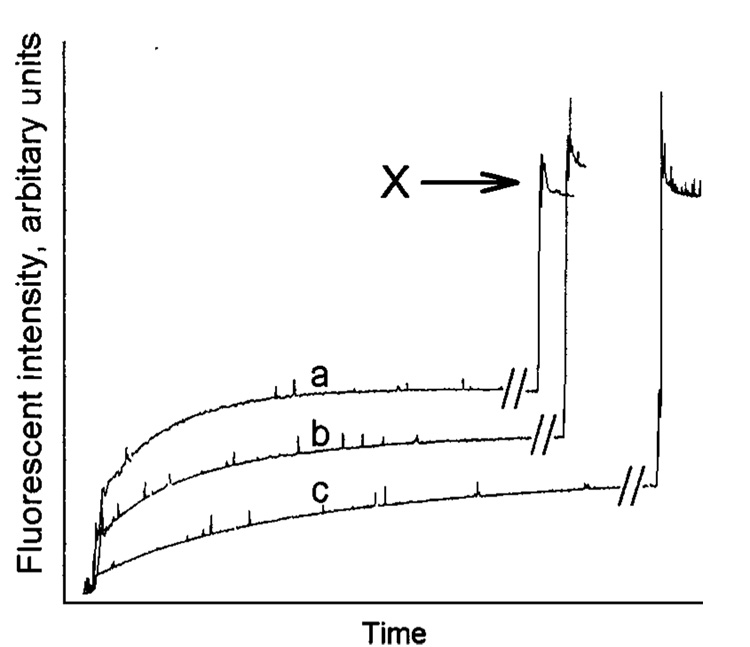
The AV-GalCer transfer was calculated as a rate (pmol transferred/sec) by adding Triton X-100 (final concentration of 1%) to the transfer reaction mixture after the AV-GalCer transfer reached transfer equilibrium. Addition of Triton X-100 caused the two fluorescently labeled lipids to become dispersed into lipid–Triton X-100 micelles considerably beyond their Förster distances (48). The dilution of the FRET probe pair in the preceding manner permitted the total AV-GalCer fluorescence intensity to be obtained for each transfer reaction mixture. The total fluorescence intensity after Triton X-100 addition, minus a Triton X-100 blank, corresponds to the total amount (400 nmol) of AV-GalCer used in each transfer reaction, which was 1 mol % or 4 nmol. By comparing the levels of the fluorescence intensity at the transfer equilibrium and after addition of detergent, we calculated the amount of available AV-GalCer transferred by GLTP. In POPC small unilamellar vesicles (SUVs), transfer equilibrium represents about 60–65% of the total AV-GalCer emission intensity achieved following detergent solubilization (32). This value is consistent with AV-GalCer being mass-distributed in the outer and inner leaflets of the donor vesicles.
Light-Scattering Measurements
To determine the impact of changing lipid composition on the size of vesicles produced by ethanol injection, light scattering was measured at 90° relative to incident light using a Fluoromax spectrofluorimeter. Temperature in the cuvette was maintained at 37 °C using a circulating water bath (Neslab RTE-111). The intensity at 320 nm was measured as a function of time as described previously (31).
RESULTS
AV-GalCer Transfer from DPPC-POPC or SPM-POPC Vesicles
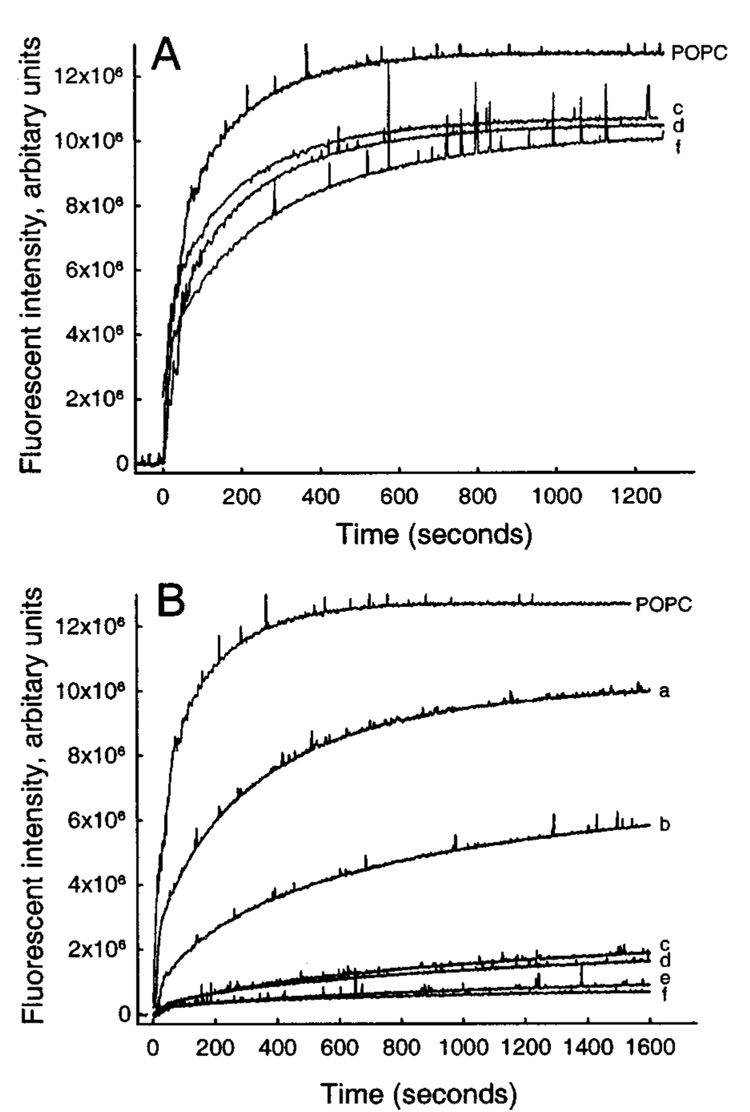
Initially, we investigated the effects of increasing mole fractions of DPPC in POPC on the AV-GalCer inter-vesicular transfer mediated by GLTP at 37 °C. DPPC was chosen because it has been used as a SPM “analogue” in studies of sphingolipid-sterol rafts (18, 49, 50). An increase in the DPPC content of the POPC donor vesicles resulted in a clear decrease in the GLTP-mediated AV-GalCer transfer (Figure 1A). An increase in the bovine brain SPM content of POPC donor vesicles also decreased the AV-GalCer transfer between donor and acceptor vesicles but much more dramatically than DPPC (Figure 1B). A complication of using natural SPMs such as bovine brain SPM is the broad temperature range of their gel-to-liquid-phase transitions that extend from about 30–50 °C (51). The phase transition of DPPC (41 °C) is higher and more cooperative than that of bovine brain SPM (~37 °C), while the main phase transition of pure POPC is around −2 °C. It, therefore, is possible that the AV-GalCer kinetic data obtained could be influenced by the lipid phase behavior encountered at 37 °C.
FIGURE 1.
Effect of increasing amounts of DPPC or bovine brain SPM in POPC donor vesicles on the GLTP-mediated (1 µg) transfer of AV-GalCer to POPC acceptor vesicles: (A) DPPC-POPC donor vesicles, (B) bovine brain SPM-POPC donor vesicles. Traces (a) 22.5%, (b) 47.5%, (c) 72.5%, (d) 82.5%, (e) 92.5%, and (f) 97.5% represent increasing amounts of DPPC or bovine brain SPM in mol %.
AV-GalCer Transfer from DMPC-POPC or 14:0 SPM-POPC Vesicles
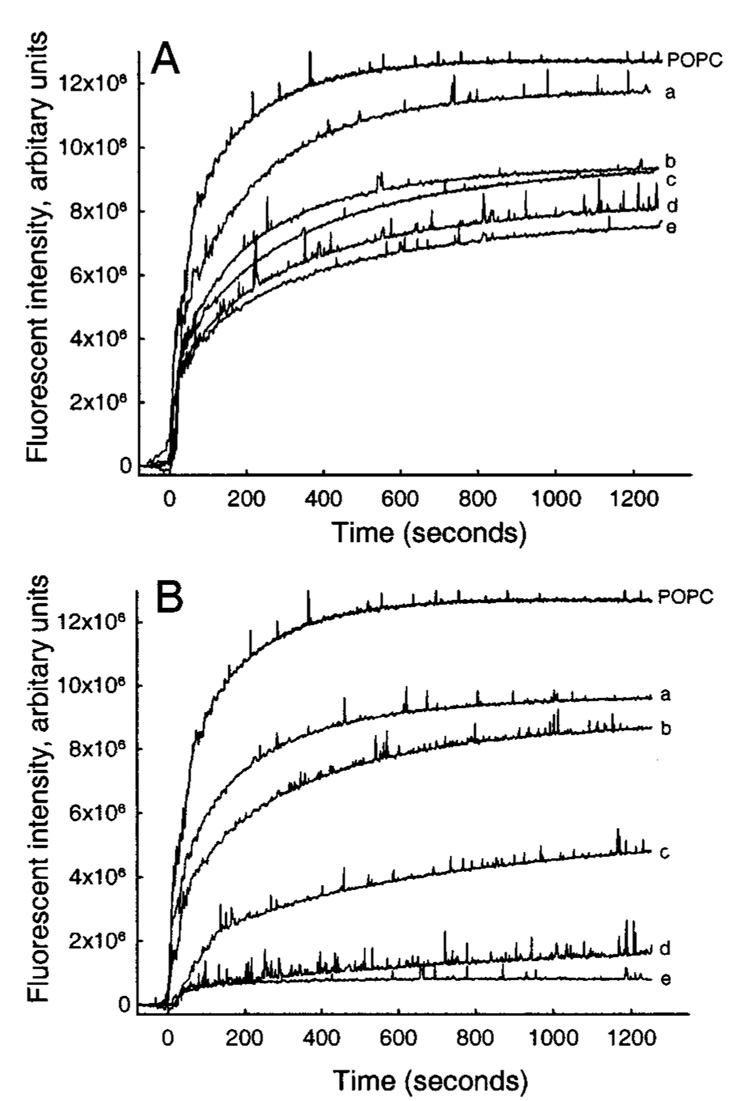
To address the possibility that gel–fluid phase coexistence in bovine SPM-POPC donors or the lack thereof in DPPC-POPC donors might be affecting the AV-GalCer transfer rates, we investigated the effect of increasing mole fractions of DMPC or 14:0 SPM in POPC on the GLTP-mediated transfer of AV-GalCer. Both DMPC and 14:0 SPM have gel-to-liquid-phase transitions (Tm) well below 37 °C, eliminating the complications of gel-fluid phase coexistence. DMPC has a Tm (gel → Lα) of ~23 °C and 14:0 SPM a Tm (gel → Lα) of ~30 °C. Figure 2A shows that similar decreases were observed in the AV-GalCer transfer when DMPC replaced DPPC (Figure 2A). Again, more dramatic decreases in the GLTP-mediated AV-GalCer transfer were observed (Figure 2B) if semisynthetic 14:0 SPM replaced the natural bovine brain SPM. Because much larger decreases in the transfer were evident for both bovine brain SPM and for 14:0 SPM, as compared to DPPC and DMPC, we exclude the possibility that the observed decrease in the transfer was caused by phase-transition-related lipid reorganization within the donor mixtures. Addition of more GLTP or more POPC acceptor vesicles to the mixtures with high SPM content did not result in any further increase in the transfer, suggesting that GLTP or acceptor vesicle concentration were not the limiting factors in the transfer (data not shown).
FIGURE 2.
Effect of increasing amounts of DMPC or 14:0 SPM in POPC donor vesicles on the GLTP-mediated (1 µg) transfer of AV-GalCer to POPC acceptor vesicles: (A) DMPC-POPC donor vesicles, (B) 14:0 SPM-POPC donor vesicles. Traces (a) 22.5%, (b) 47.5%, (c) 72.5%, (d) 82.5%, (e) 92.5%, and (f) 97.5% represent increasing amounts of DMPC or 14:0 SPM in mol %.
AV-GalCer Transfer Rates and Equilibrium Pool Sizes
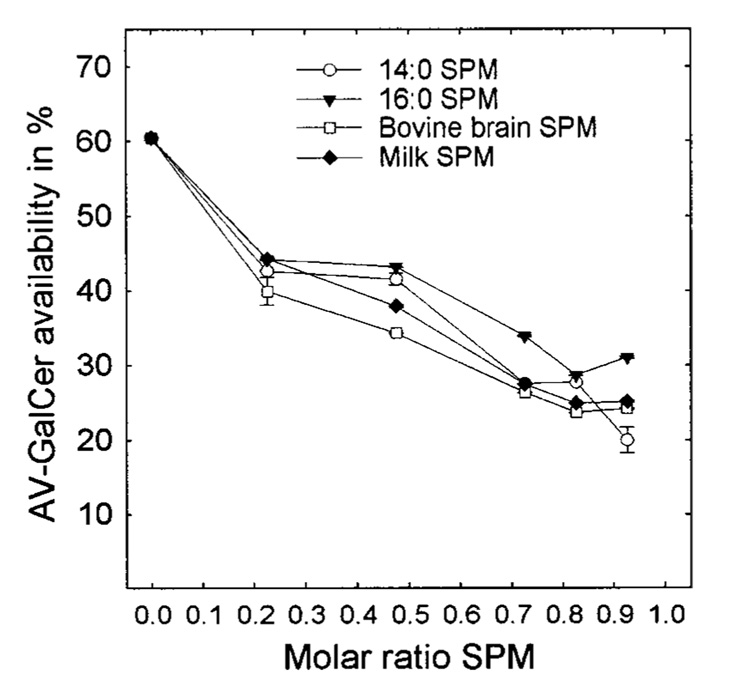
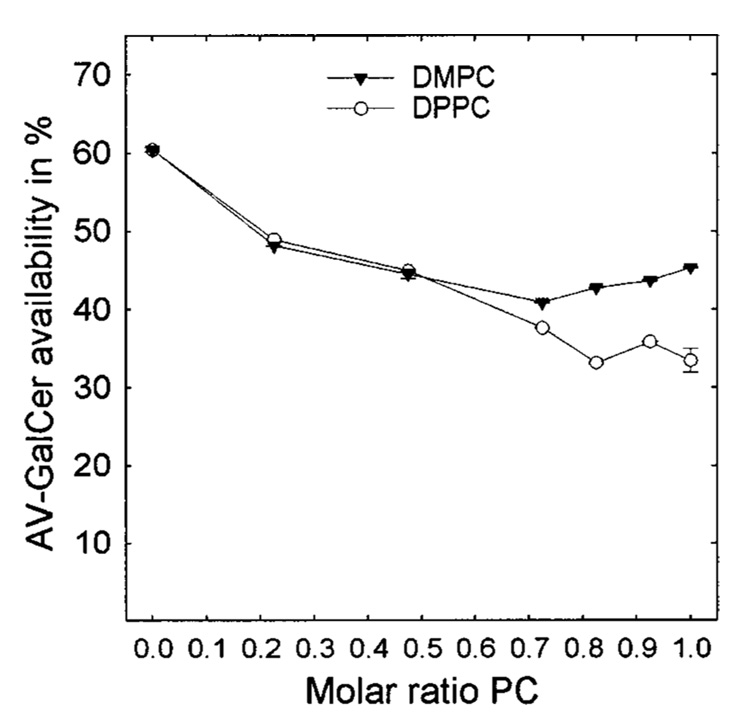
In a previous study in which we examined the effects of both negatively and positively charged lipids on the GLTP-mediated AV-GalCer transfer between POPC vesicles, the transfer reactions always reached the same equilibrium levels of fluorescence intensity, despite the increasing content of charged lipid (32). The data in Figure 1 and Figure 2 clearly show that this is not the case when the donor vesicle matrix consists of a saturated PC-POPC or SPM-POPC mixture. The data indicate that the pool size of the AV-GalCer that is accessible to GLTP diminishes as the saturated PC or SPM content of the vesicles increases with SPM producing the more dramatic effect. To quantitate the relative pool sizes, we added Triton X-100 (final concentration of 1%) to each transfer reaction mixture after reaching the AV-GalCer transfer equilibrium. The excess detergent solubilized the vesicles and allowed the total fluorescence intensity of all of the AV-GalCer in the system to be obtained (marked with an arrow in Figure 3; see Experimental Procedures). Using this approach, we determined the amounts of AV-GalCer accessible for GLTP in different SPM-POPC mixed donor vesicles using GLTP as a probe. The results are shown in Figure 4. SUVs composed of POPC with no SPM reached equilibrium transfer levels of just above 60% or 240 pmol of a total of 400 pmol (Figure 4, left symbols). This is consistent with the theoretical value of about 60–65% accessible AV-GalCer in the SUV outer leaflet. The theoretical value for the amount of AV-GalCer in the outer leaflet for highly curved vesicles with a radius of 110–125 Å can be calculated assuming that AV-GalCer is mass-distributed between the outer and inner bilayer leaflets, similar to the POPC matrix. Then, approximately one-third of the AV-GalCer originally present (400 pmol) would be expected to reside in the inner membrane leaflet, to be quenched by the Per-TG, and to be inaccessible to GLTP. At equilibrium transfer and with a donor-to-acceptor vesicle ratio of 1:10, the GLTP would transfer 10/11 (90.9%) of the AV-GalCer on the outer bilayer leaflet to the acceptor vesicles. Considering the previous, approximately 60–65% (or 218–236 pmol) recovery of the AV-GalCer emission signal would be expected when intervesicular transfer equilibrium is achieved. An increase in the molar fraction of SPM dramatically lowers the equilibrium transfer levels (Figure 4). For vesicles composed of 90 mol % SPM, only between 20% and 25% (80–100 pmol) of the total AV-GalCer was accessible to GLTP. Interestingly, substituting DMPC or DPPC for SPM did not lower the amount of accessible AV-GalCer as much as SPM (Figure 5). The accessible amount of AV-GalCer at high DMPC or DPPC mole fractions ranged between 35% and 45% (140–180 pmol).
FIGURE 3.
Determination of equilibrium transfer levels of AV-GalCer attained with bovine brain SPM-POPC mixed SUVs. Triton X-100 was added to the transfer reaction after the transfer reached equilibrium to establish the AV-GalCer fluorescence intensity expected at infinite dilution (31). The fluorescence levels after detergent addition, marked with an X (minus a Triton X-100 blank), correspond to the total fluorescence for the reaction containing 4 nmol (1 mol %) AV-GalCer. These fluorescence values were used to determine the transfer rates for the GLTP-mediated AV-GalCer transfer between donor and acceptor vesicles.
FIGURE 4.
Amount of AV-GalCer accessible to GLTP in SPM-POPC SUVs. The levels are expressed as percents of available AV-GalCer.
FIGURE 5.
Amount of AV-GalCer accessible to GLTP in DMPC-POPC and DPPC-POPC SUVs. The levels are expressed as percents of available AV-GalCer.
Effects of Other SPMs on the AV-GalCer Transfer
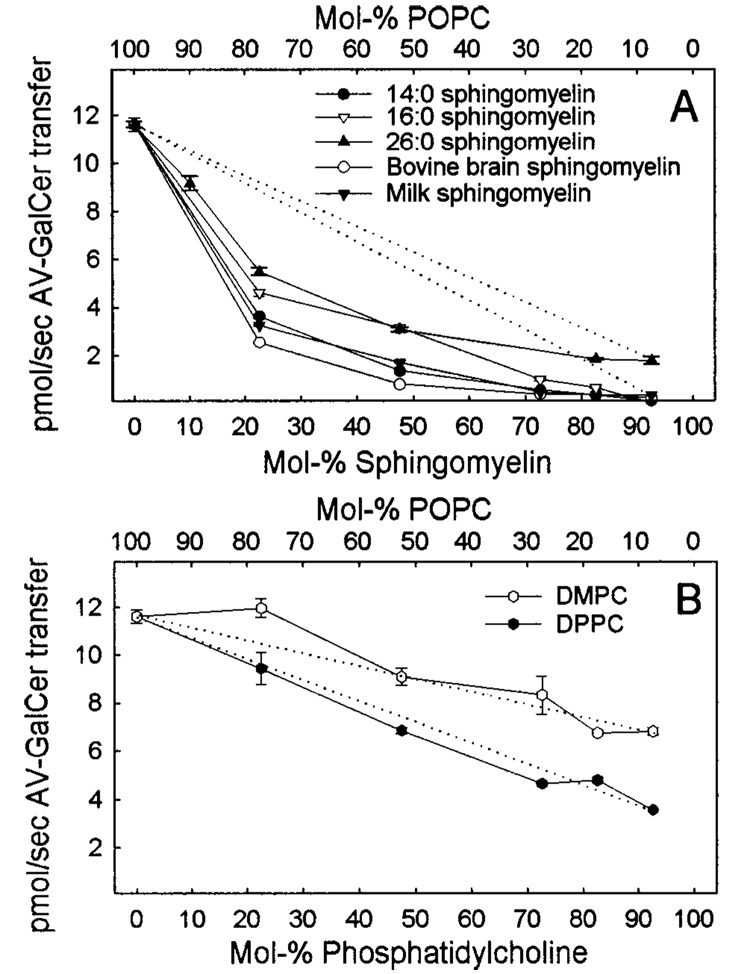
We further analyzed the GLTP-mediated AV-GalCer transfer from donor vesicles consisting of POPC mixed with milk SPM, 16:0 SPM, or 26:0 SPM. These other SPMs, which all have gel-to-liquid-phase transition temperatures above 37 °C, were chosen because of their postulated role in the formation of rafts and caveolae in cells (4, 5, 12, 16, 52–54). Figure 6A shows the AV-GalCer transfer in pmol/sec for 1 µg of GLTP as a function of a successive increase in the SPM content. In addition to the lower amount of accessible AV-GalCer upon increasing SPM content (Figure 4), the transfer rates also slow considerably. At about 30 mol % SPM, the transfer rate already reached its minimum, and further increases in SPM content did not significantly change the transfer rates. For the DMPC-POPC or DPPC-POPC system, the transfer rates slowed in a linear fashion as a result of an increase in either the DMPC or DPPC content in POPC SUVs (Figure 6B, dotted lines).
FIGURE 6.
AV-GalCer transfer rates from SPM-POPC or disaturated PC-POPC vesicles mediated by (1 µg) GLTP at 37 °C. (A) An increase in the SPM content of POPC SUVs resulted in nonlinear and nearly complete inhibition of the GLTP-mediated AV-GalCer transfer to acceptor vesicles. (B) An increase in the DPPC or DMPC content of POPC donor vesicles resulted in an almost linear decrease in the transfer rate. The dotted lines represent theoretical ideal behavior.
Light Scattering Evaluation of Vesicle Size
To determine whether increasing the SPM or saturated PC content of the POPC vesicles significantly affects vesicle size, we carried out 90° light scattering measurements (31). For SPM-POPC or saturated PC-POPC vesicles formed by rapid ethanol injection, the scattered signal at 320 nm was within 5–10% higher than POPC vesicles formed similarly or formed by sonication (data not shown). However, vesicles formed by slow ethanol injection showed a 1.8–2.1-fold increase in scattering, consistent with the expected increase in size to a 60–70 nm diameter or larger (42). Vesicles formed by extrusion through 200 nm filters showed a 3.7-fold increase in scattering relative to vesicles produced by rapid ethanol injection.
DISCUSSION
We have demonstrated that increasing the SPM content of POPC donor bilayers dramatically impedes the GLTP-mediated transfer of AV-GalCer to acceptor vesicles, regardless of the SPM acyl chain composition. An increase in the disaturated PC content of POPC donor bilayers also inhibits AV-GalCer transfer, but not nearly as much as SPM. The decrease in AV-GalCer transfer clearly reflects an inability of GLTP to access the glycolipid. To explain this diminished accessibility of AV-GalCer to GLTP, we have considered two fundamentally different scenarios involving changes in glycolipid transmembrane distributions and changes in glycolipid lateral mixing interactions with the PC and SPM matrix lipids.
Because GLTP cannot penetrate across the bilayer to access glycolipids on the inner leaflet of unilamellar vesicles or the internal lamellae of multilamellar liposomes, it could be argued that increasing the SPM content of the POPC SUVs causes the vesicles to increase in size and to become oligolamellar. Yet, our light scattering measurements reveal almost no difference in the average size of the SPM-POPC or saturated PC-POPC vesicles as compared to pure POPC SUVs (5–10% increase in scatter). The steep increase in light scattering expected when the vesicle diameter increases from SUV size (20–25 nm diameters) to LUV size (>60 nm diameter) is not evident in the SPM-POPC or saturated PC-POPC vesicles formed by rapid ethanol injection. Thus, these vesicles can be expected to have SUV-like transmembrane lipid distributions.
Because the vesicles used in our experiments appear to be SUV-like for all mixtures, another possibility is that increasing SPM content causes the transbilayer distribution of AV-GLTP to shift to the SUV inner leaflet. Yet, this explanation for limited GLTP accessibility also appears untenable. NMR studies of SPM transbilayer topology in PC SUVs indicates that SPM is nearly mass-distributed, with only a slight preference for the outer leaflet (58, 75). Our previous studies with AV-GalCer (31, 32) as well as those of Sharom and Grant with spin-labeled GalCer (46) indicate that the transbilayer topology of GalCer in POPC or egg PC SUVs is close to the expected 2:1 outside-to-inside lipid distribution (55). Other lipid transmembrane topology studies involving both egg-PE (<10 mol %) and DMPE (<30 mol %) show that these lipids have a tendency to localize to the outer leaflet when mixed with PC in SUVs (56). Only at higher mole fractions does PE localize to the inner leaflet (56). Lentz and co-workers examined the lipid distribution within di-15:0-phosphostiylglycerol (PG)-DMPC vesicles and also found that the PG preferentially localized to the outer leaflet below 50 mol % (57). Thus, much evidence indicating that lipid headgroup size, hydration, and charge exert major influences on the transbilayer distributions in phosphoglyceride SUVs, particularly when lipids are present in significant quantities. Yet, when present below 10 mol %, an outer leaflet preference is often observed. We, therefore, expect that the 1 mol % AV-GalCer used in our study results in this glycolipid preferentially localizing to the outer leaflet, not to the inner leaflet, and rendering at least 60–65% topologically available for interaction with GLTP.
Considering the preceding, it appears unlikely that SPM-induced changes in donor vesicle size/lamellarity or in AV-GalCer transmembrane topology in SUVs are responsible for GLTP’s limited accessibility to AV-GalCer. Rather, we propose that changes in the lateral mixing of the AV-GalCer with the matrix lipids within the donor vesicle outer leaflets, driven by increasing levels of SPM, limit the accessibility of GLTP to AV-GLTP. What is especially interesting is that the changes in AV-GalCer accessibility are clearly evident with SMs (e.g., 14:0 SM) or PCs (e.g., DMPC) that have phase transitions well below 37 °C. This indicates that the alterations to AV-GalCer that limit GLTP accessibility can occur within a macroscopically fluid-phase SPM-POPC or saturated PC/POPC matrix. It is also clear that increasing SPM more effectively mitigates the GLTP-mediated AV transfer than increasing levels of saturated PCs. This is illustrated in Figure 6. The negative deviation from linear ideal behavior (parts A and B of Figure 6, dotted lines) supports a stronger effect of SPM on AV-GalCer with SPM in the POPC donor vesicles. This finding suggests that factors other than chain saturation are influencing AV-GalCer accessibility to GLTP and could reflect the ability of sphingolipids to form both intramolecular and intermolecular hydrogen bonds. This possibility is discussed more extensively below.
From earlier studies, it is appears quite plausible that AV-GalCer mixing may be enhanced in SPM-POPC or disaturated PC-POPC vesicles relative to that occurring in pure POPC vesicles. Shipley and co-workers showed that N-palmitoyl GalCer, below 23 mol %, is completely miscible in DPPC fluid or gel-phase bilayers (35, 59), whereas Curatolo found that cerebroside-POPC mixtures exhibit gelphase immiscibility over the compositional range 0–70 mol % cerebroside (60). Fluorescence quenching studies by Silvius (61) support the idea that GalCer mixing becomes less favorable in PCs as the unsaturation level of the acyl chain increases. Johnston and Chapman showed that bovine brain GalCer is completely miscible with bovine brain SPM at mole fractions below 70 mol % in both the gel and liquid-crystalline states (36). Also, PCs and SPMs are known to be highly miscible in each other when their chain lengths are similar in length (e.g., refs 59 and 76). Together, these studies suggest that GalCers, at low concentrations, mix favorably in both liquid-crystalline and gel-phase SPMs, whereas GalCer mixing in PC becomes less favorable as the unsaturation of the fatty acyl chains increases in PC.
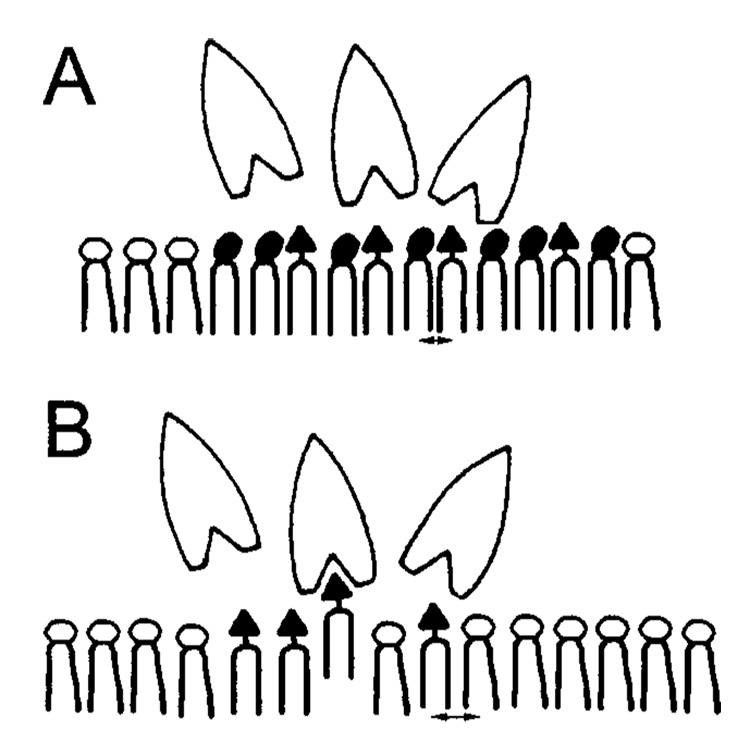
When viewed within the context of these earlier studies, one plausible scenario for explaining our observations is the following. Increased SPM levels may promote the mixing of AV-GalCer with SPM in SPM-POPC vesicles. This effect can be partially mimicked by disaturated PCs such as DMPC or DPPC, because of the structural similarity of their hydrocarbon region to SPM. However, a key feature of SPM that enhances interactions with GalCer as compared to disaturated PCs is SPM’s hydrogen-bonding capabilities (9, 13). These hydrogen-bonding capabilities of sphingolipids may impact both the headgroup conformations of SM and GalCer as well as their intermolecular interactions with each other. First, consider the headgroup differences of SPM and PC. The local environment of SPM’s headgroup in SUVs clearly differs from that of PC, as indicated by 31P NMR chemical shift data despite their chemically identical phophocholine moieties (58). Also, SPM experiences a larger downfield chemical shift by lanthanides than PC, consistent with differing headgroup conformations (58). The molecular basis of the behavior is likely to reside in the ability of SPM, but not of PC, to form intramolecular hydrogen bonds involving the 3-hydroxyl group of the sphingoid base and either the bridge oxygen or ester oxygen of phosphate (67–69). This ability to form intramolecular hydrogen bonds is also characteristic of GalCer (70, 71). In addition, SPM and GalCer have amide linkages and 3 OH groups in their interfacial regions which enable them to both donate and accept intermolecular hydrogen bonds (67–71). The combination of the preceding features enhances GalCer-SPM interactions as compared to GalCer-POPC interactions in ways that diminish GLTP’s access to the glycolipid headgroup. As depicted in Figure 7, a close juxtapositioning of SPM’s highly hydrated and zwitterionic phosphocholine headgroup and GalCer’s less-hydrated and uncharged galactose headgroup could limit access of GLTP to GalCer. Aside from simple steric crowding, a conformational change to the galactose headgroup itself might also play a role. The importance of glycolipid headgroup conformation in enabling GLTP to function is well-established (33, 62, 63). Thus, by altering the conformation of the GSL headgroup, the neighboring SPM may diminish GLTP’s access to the sugar headgroup and effectively hold in the GalCer in the bilayer membrane as compared to when the GSL is dispersed in a POPC membrane.
FIGURE 7.
Schematic representing GLTP-mediated transfer of GalCers: (A) SPM/POPC matrix containing GalCer, (B) POPC matrix containing GalCer. The scheme depicts a possible headgroup conformational difference in the sphingolipid-sphingolipid interaction compared to a sphingolipid-glycerolipid interaction: (○) = PC, (●) = SPM, (▲) = GalCer. The arrows near the ends of the hydrocarbon chains emphasize the smaller average molecular area of GalCer-SPM as compared to GalCer-POPC. The figure is not drawn to scale.
Soluble enzymes such as galactose oxidase also have been utilized to probe GalCer accessibility and their mixing with phospholipids in membranes (65, 66). Stewart and Boggs found that increasing the acyl chain length of GalCer enhances oxidation by galactose oxidase in mixed multilamellar liposomes. Also, the degree of oxidation was reduced 5-fold when GalCer’s acyl chain was 2-hydroxylated. In contrast, Yamada et al. (63) reported very little difference in the GLTP-mediated transfer of GalCers containing or lacking 2-hydroxylated acyl chains. Other galactose oxidase studies suggest that GalCer incorporated (10 mol %) into liposomes comprised of PCs with different acyl chain lengths together with cholesterol (up to 40 mol %) is oxidized less as the PC acyl chain length is increased, presumably because of increasing bilayer thickness. GalCer oxidation in liposomes containing bovine brain SPM and cholesterol also was reduced 5-fold as compared to its oxidation in PC membranes, regardless of the length of the GalCer acyl chain lengths. These findings suggest that, in the presence of cholesterol, there is a significant difference in the affinity of GalCer for PC and SPM.
As alluded to in the introduction, there is a rich history describing the crypticity of glycolipids in biomembranes based on limited accessibility to specific antibodies, lectins, and soluble enzymes. Because of crypticity, the chemical content of glycolipids within cellular membranes often does not correlate with the expected degree of antibody or lectin binding (24–28). This can have important consequences when attempting to identify glycolipid tumor markers and to develop associated immunotherapeutic treatments (64). Previous studies of glycolipid crypticity have generally focused on ceramide composition and the steric crowding produced by neighboring glycolipids and glycoproteins with extended and branched sugar headgroups (24–28). Studies assessing the impact of SPM on glycolipid accessibility in the absence of cholesterol have been lacking.
Here, we have provided evidence that the affinity of AV-GalCer for SPM as compared to PC (as probed by the GLTP) appears to be stronger, even in the absence of cholesterol. It is tempting to speculate that the association between AV-GalCer and SPM may reflect formation of dynamic lipid complexes dispersed in a PC/SPM matrix that limit glycolipid headgroup accessibility. The presence of dynamic lipid complexes within otherwise macroscopically fluidlike lipid mixtures is receiving increasing attention in various lipid systems (72–74) and warrants further study. Clearly, of novel and fundamental interest will be what effect cholesterol may have on GLTP-mediated intermembrane transfer and on the lateral organization of GSLs as seen by GLTP in different lipid matrixes. Questions such as these are presently under investigation.
ACKNOWLEDGMENT
We thank Dr. Xin-Min Li for providing the 26:0 SPM and Lisa Lovring and Bonnie Hummel for their help in producing other chain-pure SPMs.
Footnotes
We gratefully acknowledge the support of the Academy of Finland, Åbo Akademi Foundation, Magnus Ehrnrooth Foundation, NAS/NRC COBASE Grant, The Hormel Foundation, and USPHS Grant GM45928.
Abbreviations: AV-GalCer, N-[(11E)-12-(9-anthryl)-11-dodecenoyl]-1-O-β-galactosylsphingosine; GLTP, glycolipid transfer protein; POPC, 1-palmitoyl-2-oleoyl phosphatidylcholine; GSL, glycosphingolipid; GalCer, galactosylceramide; SPM, sphingomyelin; PC, phosphatidylcholine; Per-TG, rac-1,2-dioleoyl-3-[9-(3-perylenoyl)-nonanoyl]glycerol; FRET, fluorescence resonance energy transfer; SUV, small unilamellar vesicle; DPPC, dipalmitoyl phosphatidylcholine; DMPC, dimyristoyl phosphatidylcholine; 14:0 SPM, 16:0 SPM, or 26:0 SPM, sphingomyelin with myristoyl, palmitoyl, or hexacosanoyl acyl chains, respectively; PE, phosphatidylethanolamine; DMPE, dimyristoyl phosphatidylethanolamine; PG, phosphatidylglycerol.
To characterize GLTP’s potential for probing glycolipid–sphin-golipid and glycolipid–phosphoglyceride interactions, we used a glycolipid “substrate” that would be excellently transferred by GLTP to and from vesicles comprised of phosphatidylcholine (PC) with saturated sn-1 chains and unsaturated sn-2 chains, the naturally prevalent structural motif of PC. Earlier work indicated that monohexosylceramides such as GalCer and GlcCer are excellent substrates and are transferred almost equally well by GLTP, while literature data involving more complex sphingolipids (i.e., gangliosides) are more conflicting. Thus, using AV-GalCer provided a convenient and scientifically sound way to begin, especially because GalCer is likely to be a sphingolipid raft component in oligodendrocytes, Schwann cells, and enterocytes.
REFERENCES
- 1.Hakomori S, Igarashi Y. J. Biochem. 1995;118:1091–1103. doi: 10.1093/oxfordjournals.jbchem.a124992. [DOI] [PubMed] [Google Scholar]
- 2.Hannun YA, Luberto C. Trends Cell Biol. 2000;10:73–80. doi: 10.1016/s0962-8924(99)01694-3. [DOI] [PubMed] [Google Scholar]
- 3.Hakomori S, Handa K, Iwabuchi K, Yamamura S, Prinetti A. Glycobiology. 1998;8:XI–XIX. doi: 10.1093/oxfordjournals.glycob.a018822. [DOI] [PubMed] [Google Scholar]
- 4.Anderson RGW. Annu. Rev. Biochem. 1998;67:199–225. doi: 10.1146/annurev.biochem.67.1.199. [DOI] [PubMed] [Google Scholar]
- 5.Brown DA, London E. Annu. Rev. Biochem. 1998;14:136. doi: 10.1146/annurev.cellbio.14.1.111. [DOI] [PubMed] [Google Scholar]
- 6.Curatolo W, Jungalwala FB. Biochemistry. 1985;24:6608–6613. doi: 10.1021/bi00344a046. [DOI] [PubMed] [Google Scholar]
- 7.Cohen R, Barenholz Y, Gatt S, Dagan A. Chem. Phys. Lipids. 1984;35:371–384. doi: 10.1016/0009-3084(84)90079-3. [DOI] [PubMed] [Google Scholar]
- 8.Li XM, Smaby JM, Momsen MM, Brockman HL, Brown RE. Biophys. J. 2000;78:1921–1931. doi: 10.1016/S0006-3495(00)76740-3. [DOI] [PMC free article] [PubMed] [Google Scholar]
- 9.Boggs JM. Biochim. Biophys. Acta. 1987;906:353–404. doi: 10.1016/0304-4157(87)90017-7. [DOI] [PubMed] [Google Scholar]
- 10.Thompson TE, Barenholz Y, Brown RE, Correa-Freire MC, Young WW, Tillack TW. In: Enzymes Of Lipid Metabolism II. Freysz L, Dreyfus H, Massarelli R, Gatt S, editors. New York: Plenum Publishing Corporation; 1986. pp. 387–396. [Google Scholar]
- 11.Thompson TE, Tillack TW. Annu. Rev. Biophys. Biophys. Chem. 1985;14:361–386. doi: 10.1146/annurev.bb.14.060185.002045. [DOI] [PubMed] [Google Scholar]
- 12.Brown DA, London E. J. Biol. Chem. 2000;275:17221–17224. doi: 10.1074/jbc.R000005200. [DOI] [PubMed] [Google Scholar]
- 13.Brown RE. J. Cell Sci. 1998;111:1–9. doi: 10.1242/jcs.111.1.1. [DOI] [PMC free article] [PubMed] [Google Scholar]
- 14.Brown DA, London E. J. Membr. Biol. 1998;164:103–114. doi: 10.1007/s002329900397. [DOI] [PubMed] [Google Scholar]
- 15.Rietveld A, Simons K. Biochim. Biophys. Acta. 1998;1376:467–479. doi: 10.1016/s0304-4157(98)00019-7. [DOI] [PubMed] [Google Scholar]
- 16.Simons K, Ikonen E. Nature. 1997;387:569–572. doi: 10.1038/42408. [DOI] [PubMed] [Google Scholar]
- 17.Ahmed SN, Brown DA, London E. Biochemistry. 1997;36:10944–10953. doi: 10.1021/bi971167g. [DOI] [PubMed] [Google Scholar]
- 18.London E, Brown DA. Biochim. Biophys. Acta. 2000;1508:182–195. doi: 10.1016/s0304-4157(00)00007-1. [DOI] [PubMed] [Google Scholar]
- 19.Brown DA, Rose JK. Cell. 1992;68:533–544. doi: 10.1016/0092-8674(92)90189-j. [DOI] [PubMed] [Google Scholar]
- 20.Thompson TE. Curr. Opin. Struct. Biol. 1997;7:509–510. doi: 10.1016/s0959-440x(97)80114-5. [DOI] [PubMed] [Google Scholar]
- 21.Kenworthy AK, Edidin M. Methods Mol. Biol. 1999;116:37–49. doi: 10.1385/1-59259-264-3:37. [DOI] [PubMed] [Google Scholar]
- 22.Kenworthy AK, Petranova N, Edidin M. Mol. Biol. Cell. 2000;11:1645–1655. doi: 10.1091/mbc.11.5.1645. [DOI] [PMC free article] [PubMed] [Google Scholar]
- 23.Varma R, Mayor S. Nature. 1998;394:798–801. doi: 10.1038/29563. [DOI] [PubMed] [Google Scholar]
- 24.Kannagi R, Stroup R, Cochran NA, Urdal DL, Young WW, Jr, Hakomori S. Cancer Res. 1983;43:4997–5005. [PubMed] [Google Scholar]
- 25.Urdal DL, Hakomori S. J. Biol. Chem. 1983;258:6869–6874. [PubMed] [Google Scholar]
- 26.Wiels J, Holmes EH, Cochran N, Tursz T, Hakomori S. J. Biol. Chem. 1984;259:14783–14787. [PubMed] [Google Scholar]
- 27.Lloyd KO, Gordon CM, Thampoe IJ, DiBenedetto C. Cancer Res. 1992;52:4948–4953. [PubMed] [Google Scholar]
- 28.Kawashima I, Ozawa H, Kotani M, Suzuki M, Kawano T, Gomibuchi M, Tai T. J. Biochem. 1993;114:186–193. doi: 10.1093/oxfordjournals.jbchem.a124153. [DOI] [PubMed] [Google Scholar]
- 29.Brown RE, Jarvis KL, Hyland KJ. Biochim. Biophys. Acta. 1990;1044:77–83. doi: 10.1016/0005-2760(90)90221-i. [DOI] [PubMed] [Google Scholar]
- 30.Brown RE, Stephenson FA, Markello T, Barenholz Y, Thompson TE. Chem. Phys. Lipids. 1985;38:79–93. doi: 10.1016/0009-3084(85)90059-3. [DOI] [PubMed] [Google Scholar]
- 31.Mattjus P, Molotkovsky JG, Smaby JM, Brown RE. Anal. Biochem. 1999;268:297–304. doi: 10.1006/abio.1998.3065. [DOI] [PMC free article] [PubMed] [Google Scholar]
- 32.Mattjus P, Pike HM, Molotkovsky JG, Brown RE. Biochemistry. 2000;39:1067–1075. doi: 10.1021/bi991810u. [DOI] [PMC free article] [PubMed] [Google Scholar]
- 33.Sasaki T. Experientia. 1990;46:611–616. doi: 10.1007/BF01939700. [DOI] [PubMed] [Google Scholar]
- 34.Curatolo W, Small DM, Shipley GG. Biochim. Biophys. Acta. 1977;468:11–20. doi: 10.1016/0005-2736(77)90147-x. [DOI] [PubMed] [Google Scholar]
- 35.Ruocco MJ, Shipley GG, Oldfield E. Biophys. J. 1983;43:91–101. doi: 10.1016/S0006-3495(83)84327-6. [DOI] [PMC free article] [PubMed] [Google Scholar]
- 36.Johnston DS, Chapman D. Biochim. Biophys. Acta. 1988;939:603–614. doi: 10.1016/0005-2736(88)90108-3. [DOI] [PubMed] [Google Scholar]
- 37.Lin X, Mattjus P, Pike HM, Windebank AJ, Brown RE. J. Biol. Chem. 2000;275:5104–5110. doi: 10.1074/jbc.275.7.5104. [DOI] [PMC free article] [PubMed] [Google Scholar]
- 38.Molotkovsky JG, Mikhalyov II, Imbs AB, Bergelson LD. Chem. Phys. Lipids. 1991;58:199–212. [Google Scholar]
- 39.Molotkovsky JG, Bergelson LD. Bioorg. Khim. 1982;8:1256–1262. (Engl. Transl. 677–682) [Google Scholar]
- 40.Bartlett GR. J. Biol. Chem. 1959;234:466–468. [PubMed] [Google Scholar]
- 41.Batzri S, Korn ED. Biochim. Biophys. Acta. 1973;298:1015–1019. doi: 10.1016/0005-2736(73)90408-2. [DOI] [PubMed] [Google Scholar]
- 42.Kremer JMH, Esker MWJvd, Pathmamanoharan C, Wiersema PH. Biochemistry. 1977;16:3932–3935. doi: 10.1021/bi00636a033. [DOI] [PubMed] [Google Scholar]
- 43.Nichols JW, Pagano RE. Biochemistry. 1981;20:2783–2789. doi: 10.1021/bi00513a012. [DOI] [PubMed] [Google Scholar]
- 44.Hamilton JA, Small DM. Proc. Natl. Acad. Sci. U.S.A. 1981;78:6878–6882. doi: 10.1073/pnas.78.11.6878. [DOI] [PMC free article] [PubMed] [Google Scholar]
- 45.Barenholz Y, Gibbes D, Littman BJ, Goll J, Thompson TE, Carlson FD. Biochemistry. 1977;16:2806–2810. doi: 10.1021/bi00631a035. [DOI] [PubMed] [Google Scholar]
- 46.Sharom FJ, Grant CWM. J. Supramol. Struct. 1977;6:249–258. doi: 10.1002/jss.400060210. [DOI] [PubMed] [Google Scholar]
- 47.Jones JD, Almeida PFF, Thompson TE. Biochemistry. 1990;29:3892–3897. doi: 10.1021/bi00468a015. [DOI] [PubMed] [Google Scholar]
- 48.van der Meer BW, Coker GI, Chen S-YS. Resonace Energy Transfers–Theory and Data. New York: Wiley VCH; 1994. [Google Scholar]
- 49.Schroeder RJ, London E, Brown DA. Proc. Natl. Acad. Sci. U.S.A. 1994;91:12130–12134. doi: 10.1073/pnas.91.25.12130. [DOI] [PMC free article] [PubMed] [Google Scholar]
- 50.Xu X, London E. Biochemistry. 2000;39 doi: 10.1021/bi992543v. [DOI] [PubMed] [Google Scholar]
- 51.Döbereiner HG, Kas J, Noppl D, Sprenger I, Sackmann E. Biophys. J. 1993;65:1396–1403. doi: 10.1016/S0006-3495(93)81203-7. [DOI] [PMC free article] [PubMed] [Google Scholar]
- 52.Dobrowsky RT. Cell. Signalling. 2000;12:81–90. doi: 10.1016/s0898-6568(99)00072-8. [DOI] [PubMed] [Google Scholar]
- 53.Harder T, Simons K. Curr. Opin. Cell Biol. 1997;9:534–542. doi: 10.1016/s0955-0674(97)80030-0. [DOI] [PubMed] [Google Scholar]
- 54.Simons K, Toomre D. Nat. Rev. Mol. Cell Biol. 2000;1:31–39. doi: 10.1038/35036052. [DOI] [PubMed] [Google Scholar]
- 55.Huang C, Mason JT. Proc. Natl. Acad. Sci. U.S.A. 1978;75:308–310. doi: 10.1073/pnas.75.1.308. [DOI] [PMC free article] [PubMed] [Google Scholar]
- 56.Lentz BR, Litman BJ. Biochemistry. 1978;17:5537–5543. doi: 10.1021/bi00618a032. [DOI] [PubMed] [Google Scholar]
- 57.Lentz BR, Alford DR, Dombrose FA. Biochemistry. 1980;19:2555–2559. doi: 10.1021/bi00553a003. [DOI] [PubMed] [Google Scholar]
- 58.Schmidt CF, Barenholz Y, Thompson TE. Biochemistry. 1977;16:2649–2656. doi: 10.1021/bi00631a011. [DOI] [PubMed] [Google Scholar]
- 59.Untracht SH, Shipley GG. J. Biol. Chem. 1977;252:4449–4457. [PubMed] [Google Scholar]
- 60.Curatolo W. Biochim. Biophys. Acta. 1986;861:373–376. doi: 10.1016/0005-2736(86)90441-4. [DOI] [PubMed] [Google Scholar]
- 61.Silvius JR. Biochemistry. 1992;31:3398–3408. doi: 10.1021/bi00128a014. [DOI] [PubMed] [Google Scholar]
- 62.Yamada K, Abe A, Sasaki T. Biochim. Biophys. Acta. 1986;879:345–349. [PubMed] [Google Scholar]
- 63.Yamada K, Abe A, Sasaki T. J. Biol. Chem. 1985;260:4615–4621. [PubMed] [Google Scholar]
- 64.Hakomori S. Acta Anat. 1998;16:79–90. doi: 10.1159/000046451. [DOI] [PubMed] [Google Scholar]
- 65.Stewart RJ, Boggs JM. Biochemistry. 1993;32:5605–5614. doi: 10.1021/bi00072a016. [DOI] [PubMed] [Google Scholar]
- 66.Stewart RJ, Boggs JM. Biochemistry. 1993;32:1–9. doi: 10.1021/bi00072a016. [DOI] [PubMed] [Google Scholar]
- 67.Pascher I. Biochim. Biophys. Acta. 1976;455:433–451. doi: 10.1016/0005-2736(76)90316-3. [DOI] [PubMed] [Google Scholar]
- 68.Bruzik KS. Biochim. Biophys. Acta. 1988;939:315–326. doi: 10.1016/0005-2736(88)90076-4. [DOI] [PubMed] [Google Scholar]
- 69.Talbott CM, Vorobyvov I, Borchman D, Taylor DG, DuPree DB, Yappert MC. Biochim. Biophys. Acta. 2000;1467:326–337. doi: 10.1016/s0005-2736(00)00229-7. [DOI] [PubMed] [Google Scholar]
- 70.Pascher I, Sundell S. Chem. Phys. Lipids. 1977;20:175–191. [Google Scholar]
- 71.Bruzik KS, Nylholm P-G. Biochemistry. 1997;36:566–575. doi: 10.1021/bi962204r. [DOI] [PubMed] [Google Scholar]
- 72.Anderson TG, McConnell HM. Colloids Surf. 2000;171:13–23. [Google Scholar]
- 73.Radhakrishnan A, McConnell HM. Biophys. J. 1999;77:1507–1517. doi: 10.1016/S0006-3495(99)76998-5. [DOI] [PMC free article] [PubMed] [Google Scholar]
- 74.Radhakrishnan A, McConnell HM. J. Am. Chem. Soc. 1999;121:486–487. [Google Scholar]
- 75.Castellino FJ. Arch. Biochem. Biophys. 1977;189:465–470. doi: 10.1016/0003-9861(78)90235-7. [DOI] [PubMed] [Google Scholar]
- 76.Maulik PR, Shipley GG. Biophys. J. 1996;70:2256–2265. doi: 10.1016/S0006-3495(96)79791-6. [DOI] [PMC free article] [PubMed] [Google Scholar]


