

Abstract
We report here the results of testing the pairwise association of 12,747 transcriptional gene-expression values with more than two million single-nucleotide polymorphisms (SNPs) in samples of European (CEPH from Utah; CEU) and African (Yoruba from Ibadan; YRI) ancestry. We found 4,677 and 5,125 significant associations between expression quantitative nucleotides (eQTNs) and transcript clusters in the CEU and the YRI samples, respectively. The physical distance between an eQTN and its associated transcript cluster was referred to as the intrapair distance. An association with 4 Mb or less intrapair distance was defined as local; otherwise, it was defined as distant. The enrichment analysis of functional categories shows that genes harboring the local eQTNs are enriched in the categories related to nucleosome and chromatin assembly; the genes harboring the distant eQTNs are enriched in the categories related to transmembrane signal transduction, suggesting that these biological pathways are likely to play a significant role in regulation of gene expression. We highlight in the EPHX1 gene a deleterious nonsynonymous SNP that is distantly associated with gene expression of ORMDL3, a susceptibility gene for asthma.
Introduction
Genomic variation can provide molecular markers for the variation of many phenotypes.1,2 Moreover, transcriptional-expression differences can be mapped to one or more segments of DNA close to or distant from the genomic location of the gene.3 These segments of DNA, referred to as expression quantitative trait loci (eQTLs), or expression quantitative nucleotides (eQTNs) at the level of the individual polymorphism, can be local by regulating the expression of its target gene through at least four different modes, including neighboring gene regulation, allele-specific regulation, autoregulation, and feedback regulation.3 The first integrated study of DNA variation and gene expression was performed in budding yeast4 to dissect the genetic architecture of transcriptional regulation, an approach later termed genetical genomics.5 The identification of eQTLs (and eQTNs) is becoming a useful tool to bridge gene-expression results and genetic findings from the traditional QTL mapping studies in multiple species such as Arabidopsis,6 maize,7 Caenorhabditis elegans,8 mice,9–12 and humans.1,2,13 Microarray technology has allowed genome-wide association studies to evaluate heritability and global gene expression.14–18 In particular, three recent studies provide a comprehensive analysis of genetic alterations underlying regulation of gene expression.19–21 Our objective was to determine eQTL relationships with eQTNs in two HapMap22 populations (CEPH from Utah [CEU] and Yoruba from Ibadan [YRI]) through the integration of HapMap genotype information on more than two million common SNPs and gene expression of 12,747 transcript clusters (TCs), each of which contains a set of probesets representing all known exonic regions in the genome as well as the 5′- and 3′-untranslated regions.
Material and Methods
Lymphoblastoid Cell Lines
HapMap cell lines (30 CEU trios and 30 YRI trios) were purchased from Coriell Institute for Medical Research. Lymphoblastoid cell lines (LCLs) were maintained in RPMI 1640 containing 1% l-glutamine plus FBS (20% for 1st dilution, 15% for following dilutions) as previously described.2,23 Both sets of YRI and CEU lines were diluted to a concentration of 3.5–4.0 × 10⁵ cells/mL every 2–3 days and harvested after the 4th dilution from exponentially growing cells, only if viability was ≥ 85%. Cell suspensions were spun at 400 × g for 5 min to remove media. Cell pellets were washed twice with ice-cold PBS (Invitrogen) and stored at −80°C.
Gene-Expression Evaluation
Samples of CEU and YRI were run concomitantly in efforts to minimize potential batch effects. Baseline gene expression was evaluated in 176 HapMap LCLs (87 CEU and 89 YRI) with Affymetrix GeneChip Human Exon 1.0 ST array. Cell pellets were thawed and total RNA was extracted with QIAGEN Qiashredder and RNeasy Plus kits (QIAGEN) according to the manufacturer's protocol. RNA concentration and purity was determined through measurement of A260/A280 ratios with the Spectronic Genesys 6 UV/Vis Spectrophotometer (Thermo Electron) as described.23 For each cell line, ribosomal RNA was depleted from 1 μg of total RNA with the RiboMinus Human/Mouse Transcriptome Isolation kit (Invitrogen). cDNA was generated with the GeneChip WT cDNA Synthesis and Amplification Kit (Affymetrix) per the manufacturer's instructions. cDNA was fragmented and end labeled with the GeneChip WT Terminal Labeling Kit (Affymetrix). Approximately 5.5 μg of labeled DNA target was hybridized to the Affymetrix GeneChip Human Exon 1.0 ST Array at 45°C for 16 hr per the manufacturer's recommendation. Hybridized arrays were washed and stained on a GeneChip Fluidics Station 450 and scanned on a GCS3000 Scanner (Affymetrix). We used the Robust Multichip Average (RMA) approach for the summarization and the log2 transformation approach to normalize the expression data. Detailed descriptions can be found in our previous publications.2,23
SNP Selection Criteria
The SNP genotypes of CEU and YRI populations were downloaded from the online HapMap database (release 22, nonredundant and rs_strand version). Altogether, 2,098,437 (CEU) and 2,286,186 (YRI) SNPs with minor allele frequencies > 5% and with no Mendelian-inheritance transmission errors in the CEU or YRI trios were used for the present study.
Genome-wide Association for TC-eQTN Pairs
The integrated studies between 12,747 log2-transformed TC expression levels and more than two million SNPs in the CEU or YRI were performed with the QTDT software.24,25 To distinguish between local and distant eQTNs and their associated TCs, we chose to define a gene as locally associated if its gene expression was associated with eQTN(s) within 4 Mb on either side of the gene and on the same chromosome; others were defined as distant. All physical positions used in the present study were based on NCBI build 36.1.
Analysis of eQTLs that Might Perturb Sequence Conservation and Transcription-Factor Binding Sites
The physical locations of eQTLs were compared to the most conserved regions generated from the UCSC alignments of 17 vertebrate genomes and to the conserved vertebrate transcription-factor binding-site regions from the same browser. The locations were tested with Z score criteria of 1.66 or 2.33 corresponding to p values of 0.05 and 0.01, respectively.
eQTN_BLOCKs and eQTN_hotspots
The eQTN_BLOCK (see Figure S1 available online) was defined as a region of the genome containing one or more eQTNs associated with the same TC and having a between-eQTN interval of < 500 Kb. Detailed information on eQTN_BLOCKs in the CEU and YRI is available in Table S1. The eQTN_hotspot was defined as a region of the genome containing one or more eQTNs associated with the expression of multiple nonredundant TCs. In the present study, we used 500 Kb as the bin size and thus divided the human genome into 5,691 bins. Only the distantly associated TC-eQTN pairs were included in the analysis.
Enrichment Analysis of Functional-Annotation Categories
We used DAVID bioinformatics tools26 to identify enriched functional-annotation categories. NCBI gene identifiers were used for the upload format. The genes harboring the more than two million SNPs in the CEU were used as the background data set for the CEU-local and CEU-distant eQTN-GENEs. The genes harboring the > 2 million SNPs in the YRI were used as the background data set for the YRI-local and YRI-distant eQTN-GENEs; the genes annotated for a total of 12,747 core TCs were used as the background data set for the CEU-distant, YRI_Hs_30, and YRI_Hs_36 TC-GENEs. The expression levels of enriched genes were grouped by a hierarchical clustering algorithm27 using the average-linkage method, which was implemented in the MeV:MultiExperiment Viewer (TIGR).28
Results
Significant TC-eQTN Associations in the CEU and the YRI
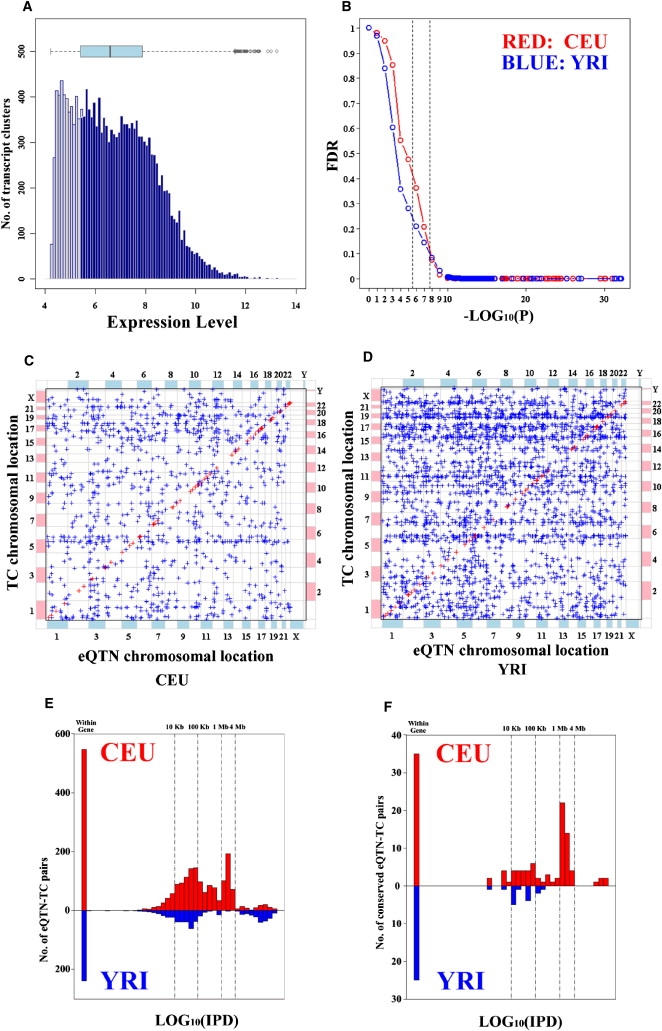
A total of 12,747 TCs, whose expression values were greater than the 25th percentile of average expression level of all TCs in the 176 HapMap samples, were selected for genome-wide association with more than two million common SNPs independently in CEU and YRI samples (Figure 1A). A p value of 2 × 10⁻⁸ corresponding to a false discovery rate (FDR)26 of approximately 10% for both CEU and YRI samples was set as the threshold for statistical significance (Figure 1B). With this stringent p value cutoff, 4,677 and 5,125 significant TC-eQTN associations were observed in the CEU and the YRI samples, respectively (Figures 1C and 1D and Table S2). We refer to the distance between an eQTN and its associated TC as the intrapair distance. The distribution of intrapair distances in 2,102 (CEU) and 761 (YRI) TC-eQTN pairs in the same chromosome is shown in Figure 1E and in conserved regions in Figure 1F. The intrapair distances in the CEU tend to be larger than in the YRI, and there are dramatically more TC-eQTN pairs with intrapair distances ranging from 1 to 4 Mb in the CEU than in the YRI (Figure 1E). Thus, to distinguish between close- and long-range associations in both populations, we chose to define a TC-eQTN pair with an intrapair distance of 4 Mb or less as local; all others were defined as distant. By this definition, the ratio of distant to local TC-eQTN pairs was greater in YRI samples (4,537/588) compared to CEU (2,667/2,010) (Table 1).
Figure 1.
Features of Significant Association in the CEU and the YRI LCLs
(A) Histogram of average expression levels of 16,997 TCs in human LCLs (176 individuals). The horizontal blue box-plot provides the mean and 95% confidence intervals of the expression levels of 16,997 TCs. The gray vertical bars represent TCs whose mean log2-transformed expression values in 176 LCLs are less than or equal to 5.405, the 25th quantile of mean TC expression values; the dark blue vertical bars represent the 12,747 TCs selected for the genome-wide association (GWA) study.
(B) Relationship between raw p value and false-discovery rate (FDR) of the GWA studies in the CEU and the YRI samples. The FDR values are estimated with Benjamini-Hochberg correction. There are two dashed vertical lines denoting p value of 3 × 10⁻⁶ (p value of 0.05 corrected by 12,747 tested TCs) and 2 × 10⁻⁸ (p value of 0.05 corrected by the approximately two million SNPs), respectively. p value of 2 × 10⁻⁸ corresponds to an FDR < 0.1 in the GWA studies of both CEU and YRI samples.
(C and D) The genomic distribution of 4,677 TC-eQTN associations in the CEU (C), and the genomic distribution of 5,125 TC-eQTN associations in the YRI (D). The blue crosses are the distant TC-eQTN associations; the red crosses along the diagonal lines are the local TC-eQTN associations.
(E and F) The intrapair distance distribution of 2,102 CEU (red) and 761 YRI (blue) same-chromosome TC-eQTN pairs (E). The intrapair distance distribution of 118 CEU (red) and 40 YRI (blue) same-chromosome TC-eQTN pairs having eQTNs in the conserved region (F). IPD on the x axis refers to intrapair distance.
Table 1.
Numbers of Significant Associations in the CEU and YRI Samples
|
CEU |
YRI |
|||||||
|---|---|---|---|---|---|---|---|---|
| Intrapair Distance | TCs | eQTNs | Pairs (TC-eQTN) | Pairs (TC-eQTN_BLOCKs) | TCs | eQTNs | Pairs (TC-eQTN) | Pairs (TC-eQTN_BLOCKs) |
| Same Chromosome | ||||||||
| 0 bp | 51 | 544 | 548 | 51 | 41 | 239 | 239 | 41 |
| > 0 bp | 99 | 1293 | 1554 | 102 | 157 | 518 | 522 | 169 |
| < 10 Kb | 57 | 681 | 706 | 57 | 46 | 333 | 333 | 46 |
| ≥ 10 Kb | 91 | 1146 | 1396 | 94 | 148 | 424 | 428 | 160 |
| < 100 Kb | 63 | 1224 | 1290 | 63 | 61 | 545 | 545 | 61 |
| ≥ 100 Kb | 70 | 591 | 812 | 72 | 117 | 212 | 216 | 129 |
| < 1 Mb | 66 | 1515 | 1644 | 66 | 63 | 586 | 586 | 63 |
| ≥ 1 Mb | 51 | 294 | 458 | 53 | 109 | 171 | 175 | 120 |
| < 4 Mb | 67 | 1720 | 2010 | 67 | 65 | 588 | 588 | 65 |
| ≥ 4 Mb | 48 | 88 | 92 | 50 | 107 | 169 | 173 | 118 |
| Subtotal | 114 | 1808 | 2102 | 117 | 171 | 757 | 761 | 183 |
| Different Chromosome | ||||||||
| NA | 662 | 2114 | 2575 | 1024 | 1608 | 3427 | 4364 | 2668 |
| Sum | ||||||||
| NA | 741 | 3902 | 4677 | 1141 | 1701 | 4148 | 5125 | 2851 |
“Same Chromosome” and “Different Chromosome” denote that the TCs and their eQTNs are located at the same chromosme or different chromosome, respectively. “0 bp” means that eQTNs are located within the annotated genes of TCs. “NA” means not applicable.
Associated TCs in the CEU and the YRI
A total of 741 (CEU) and 1,701 (YRI) unique TCs that are significantly associated with genetic variants were captured. Among them, there are 67 local and 691 distant TCs in CEU and 65 local and 1,665 distant TCs in YRI (Table 1). The genomic distribution of eQTNs and their associated TCs in CEU and YRI samples are shown in Figure 2. No chromosome was either overrepresented or underrepresented relative to the null distribution of the TCs in the analysis set (data not shown).
Figure 2.
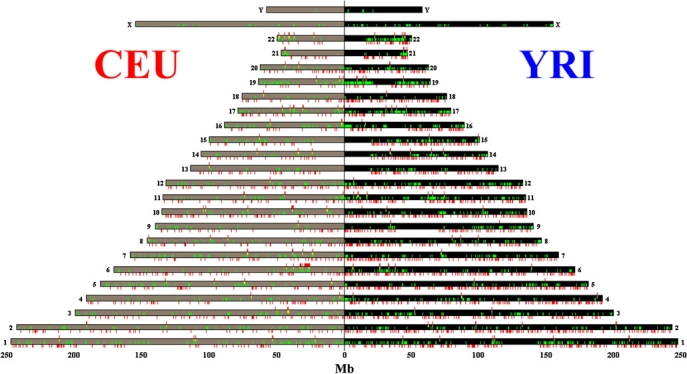
The genomic Distribution of eQTNs and TCs in the CEU and the YRI Populations
The tan and black boxes represent the chromosomes in the CEU (left) and the YRI (right) samples. The green tick marks denote the location of distant TCs. The yellow tick marks denote the location of local TCs. The red tick marks above the chromosome boxes denote the location of the distant eQTNs, and the red tick marks below the chromosome boxes denote the position of the local eQTNs.
Bioinformatic Properties of the eQTNs
There were 3,902 and 4,148 significant eQTNs in CEU and YRI (Table 1), respectively, with an overlap of 244 in both populations. A total of 184 (CEU) and 206 (YRI) eQTNs are located within the most conserved regions (based on UCSC vertebrate genome alignments, March 2006). Only 19 of these highly conserved eQTNs overlap between the two populations which is not significantly different from the expected number. The distribution of intrapair distances of the conserved TC-eQTN pairs showed that most of the conserved local eQTNs are located within their associated genes (Figure 1F). We also examined the location of the significant eQTNs with respect to transcription-factor binding sites. Only 20 local and 80 distant eQTNs are located in the motifs of transcription-factor binding sites. Among them, six and three transcription-factor binding-site eQTNs are located within or < 10 Kb away from their locally associated genes in CEU and YRI, respectively. One potential explanation for the distant associations of eQTNs with gene expression is that the eQTN may be located near a transcription factor, and therefore the SNP affects the target-gene expression indirectly through the regulation of a transcription factor. Using the known or predicted transcription-factor gene sets collected by Messina et al.,29 we found a small proportion of distant eQTNs are located within or < 10 Kb away from transcription-factor gene loci (57 out of 1,283 and 121 out of 3,561 distant eQTNs for the CEU and the YRI, respectively), which agrees with the previous findings in Saccharomyces cerevisiae that transcription factors showed no enrichment of the trans-regulatory variation.30
eQTN_BLOCKs
Because eQTNs in close physical proximity tend to be in high linkage disequilibrium (LD), we defined eQTN_BLOCKs as eQTN(s) in close proximity and associated with expression of the same TC. This step reduces LD-induced redundancy and identifies genetic regions with multiple independent alleles that affect expression of the same TC. An eQTN_BLOCK can harbor as many as 346 eQTNs and stretch from 0 bp (single eQTN) up to 3.8 Mb. The median size of local eQTN_BLOCKs (harboring ≥ two eQTNs) in the CEU is 60,160 bp, almost twice that in the YRI (32,947 bp); similarly, the median size of distant eQTN_BLOCKs in the CEU is 15,058 bp compared to 6,007 bp in the YRI.
A total of 67 local and 1,074 distant eQTN_BLOCKs are associated with 67 and 691 TCs in the CEU samples, respectively. In YRI, 65 local and 2,786 distant eQTN_BLOCKs are associated with 65 and 1,665 TCs, respectively. Among them, 175 TCs are found in both CEU and YRI, with the majority of them being in the same mode (local or distant), including 25 local TCs and 143 distant TCs in both populations. Strikingly, 23 of these 25 TCs share the same local eQTN_BLOCKs across populations (see Table S3); the local eQTN_BLOCKs of the remaining two TCs are associated with local eQTN_BLOCKs with positions within 10 Kb across the populations. In contrast, none of the 143 distant TCs share the same distant eQTN_BLOCKs. One possible explanation for this is that the same distant TC-eQTN association found in one population may exist in the other population but with lower significance. However, even when a more inclusive p value cutoff of 3 × 10⁻⁶ was applied, there were no overlapping distant TC-eQTN pairs in the CEU and the YRI samples. Four TCs are associated with overlapping distant eQTN_BLOCKs across the populations with p value cutoff of 2 × 10⁻⁸. In addition, 67 TCs were associated with eQTN_BLOCKs with positions within 100 Kb across the populations, and 479 TCs were associated with eQTN_BLOCKs with positions within 1 Mb across the populations (data not shown).
Hotspots of eQTNs and Gene-Ontology Analysis
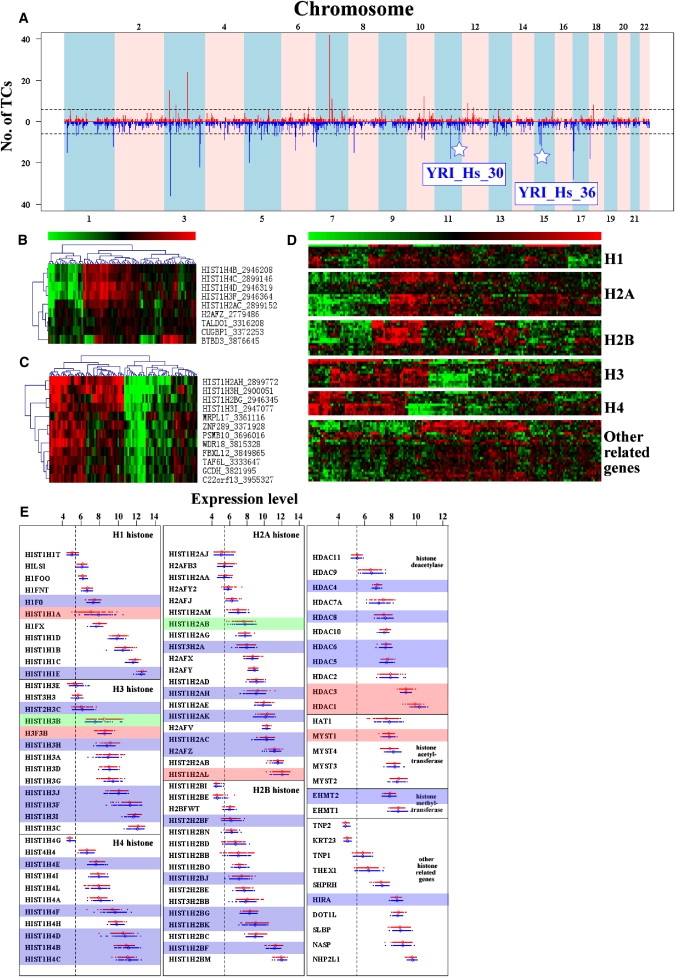
Some eQTNs are associated with multiple TCs. We found 14 and 38 of these distant eQTN_hotspots in the CEU and the YRI, respectively (Figure 3A). The number of distinct TCs linked to eQTNs in each bin is shown by bar height in Figure 3A, and the dashed lines show the maximum number of associated TCs that would be expected to fall into any one bin by chance with a probability equal to 0.001, corrected for the number of bins. Bins with bar heights at or above this line represent eQTN_hotspots. Hotspots were numbered sequentially according to their locations in the genome from chromosome 1 to 22. The hotspots harbor eQTNs associated with up to 42 and 36 distinct TCs in the CEU and the YRI samples, respectively (see Table S4).
Figure 3.
The Distantly Associated eQTN_hotspots
(A) The genomic distribution of eQTN_hotspots. The x axis represents location on the chromosome of distant eQTN_hotspots, and the y axis is the number of TCs associated with the eQTNs in each bin (bin size equals to 500 Kb). The dashed lines show the maximum number of six associated TCs that would be expected to fall into any one bin by chance with a probability of 0.001 (binomial test, corrected by the bin numbers). Bins with bar heights at or above this line represent eQTN_hotspots. There are 14 and 38 hotspots in CEU and YRI, respectively (see Table S4). Hotspots were numbered sequentially according to their locations in the genome from chromosome 1 to 22. The stars denote two distant eQTN_hotspots in the YRI associated with gene sets enriched in functional-annotation categories (details in Table 2).
(B and C) Heat maps of the expression of TCs associated with the eQTN hotspots of YRI_Hs_30 and YRI_Hs_36. The rows are TCs, and columns are the YRI samples. The green and red color in the heat map means expression below and above the average level, respectively.
(D) Heat map of the expression patterns of histone genes and their related genes in the CEU and the YRI samples. The rows are TCs, and columns are 176 samples. The green and red colors in the heat map indicate expression below and above the average level, respectively.
(E) The expression levels of histones and their related genes in the CEU (red) and YRI (blue) samples. The shading indicates an association between expression level with one or more eQTNs in CEU only (pink), in YRI only (blue), or in both (green).
The enrichment analysis in functional-annotation categories was carried out for both genes harboring eQTNs and the annotated genes of TCs (Table 2). The most highly enriched functional category is nucleosome assembly for the local eQTN-harboring genes in the CEU (14 hits, p = 1.0 × 10⁻¹⁴, Benjamini-Hochberg (B-H) corrected Pc = 3.4 × 10⁻¹¹) (see 26). The same category is also enriched in the local eQTN-harboring genes in the YRI, though with less significance (6 hits, p = 1.5 × 10⁻⁵, B-H corrected Pc = 5.0 × 10⁻²). Moreover, this category is again enriched in the TC-GENES associated with the eQTN_hotspot YRI_Hs_30 (4 hits, p = 2.3 × 10⁻⁶, B-H corrected Pc = 3.5 × 10⁻³, Figure 3B). Note that eQTN_hotspot YRI_Hs_36 is also associated with several histone genes that are important for nucleosome assembly (Figure 3C). As shown in Figures 3B and 3D, the expression patterns of the histone genes associated with the eQTNs in the hotspots are very similar to each others.
Table 2.
Enriched Functional Annotations of Genes Harboring eQTNs and TC-GENEs
| Inputa | Categoryb | Enrichment | Count | p Value | B-H Pc |
|---|---|---|---|---|---|
| eQTN-GENEs | |||||
| CEU-local | BP | nucleosome assembly | 14 | 1.0 × 10⁻¹⁴ | 3.4 × 10⁻¹¹ |
| BP | chromatin assembly | 14 | 6.6 × 10⁻¹⁴ | 1.1 × 10⁻¹⁰ | |
| BP | protein-complex assembly | 17 | 2.7 × 10⁻⁹ | 2.2 × 10⁻⁶ | |
| BP | DNA packaging | 15 | 1.4 × 10⁻⁸ | 7.8 × 10⁻⁶ | |
| InterPro | histone core | 9 | 4.0 × 10⁻¹⁰ | 2.0 × 10⁻⁶ | |
| InterPro | transcriptional regulator SCAN | 10 | 2.2 × 10⁻⁹ | 5.5 × 10⁻⁶ | |
| InterPro | histone-fold/TFIID-TAF/NF-Y | 9 | 7.1 × 10⁻⁹ | 1.2 × 10⁻⁵ | |
| InterPro | SPRY-associated | 9 | 2.0 × 10⁻⁸ | 2.4 × 10⁻⁵ | |
| InterPro | immunoglobulin V-type | 7 | 1.1 × 10⁻⁴ | 4.7 × 10⁻² | |
| SP_PIR | acetylation | 16 | 2.1 × 10⁻⁶ | 8.9 × 10⁻⁴ | |
| YRI-local | BP | chromatin assembly | 6 | 2.9 × 10⁻⁵ | 4.7 × 10⁻² |
| BP | nucleosome assembly | 6 | 1.5 × 10⁻⁵ | 5.0 × 10⁻² | |
| CC | nucleosome | 6 | 5.6 × 10⁻⁶ | 3.4 × 10⁻³ | |
| InterPro | histone core | 6 | 6.0 × 10⁻⁷ | 3.0 × 10⁻³ | |
| InterPro | histone-fold/TFIID-TAF/NF-Y | 6 | 3.8 × 10⁻⁶ | 9.5 × 10⁻³ | |
| SP_PIR | nucleosome core | 6 | 2.8 × 10⁻⁷ | 3.5 × 10⁻⁴ | |
| CEU-distant | BP | transmission of nerve impulse | 17 | 1.5 × 10⁻⁵ | 2.4 × 10⁻² |
| BP | synaptic transmission | 17 | 7.7 × 10⁻⁶ | 2.5 × 10⁻² | |
| CC | membrane | 119 | 3.6 × 10⁻⁵ | 2.2 × 10⁻² | |
| CC | plasma membrane | 51 | 1.2 × 10⁻⁴ | 3.5 × 10⁻² | |
| YRI-distant | CC | membrane | 257 | 3.1 × 10⁻⁵ | 1.9 × 10⁻² |
| InterPro | fibronectin, type III | 24 | 5.7 × 10⁻⁶ | 4.7 × 10⁻³ | |
| InterPro | EGF | 25 | 2.0 × 10⁻⁵ | 9.2 × 10⁻³ | |
| InterPro | pleckstrin homology-type | 32 | 1.5 × 10⁻⁴ | 5.0 × 10⁻² | |
| SP_PIR | glycoprotein | 176 | 1.1 × 10⁻⁵ | 4.5 × 10⁻³ | |
| SP_PIR | neurogenesis | 12 | 9.4 × 10⁻⁵ | 2.0 × 10⁻² | |
| SP_PIR | signal | 136 | 2.9 × 10⁻⁴ | 4.0 × 10⁻² | |
| TC-GENEs | |||||
| CEU-distant | MF | transmembrane-receptor activity | 52 | 2.5 × 10⁻⁵ | 5.6 × 10⁻² |
| YRI_Hs_30 | BP | chromatin assembly | 4 | 3.3 × 10⁻⁶ | 3.4 × 10⁻³ |
| BP | nucleosome assembly | 4 | 2.3 × 10⁻⁶ | 3.5 × 10⁻³ | |
| BP | DNA packaging | 4 | 8.8 × 10⁻⁵ | 4.4 × 10⁻² | |
| CC | nucleosome | 4 | 1.3 × 10⁻⁶ | 7.6 × 10⁻⁴ | |
| InterPro | histone core | 4 | 3.3 × 10⁻⁷ | 1.5 × 10⁻³ | |
| InterPro | histone-fold/TFIID-TAF/NF-Y | 4 | 1.0 × 10⁻⁶ | 2.4 × 10⁻³ | |
| YRI_Hs_36 | InterPro | histone-fold/TFIID-TAF/NF-Y | 4 | 4.3 × 10⁻⁶ | 1.9 × 10⁻² |
| CC | obsolete cellular component | 3 | 6.3 × 10⁻⁵ | 3.7 × 10⁻² | |
eQTN-GENEs: genes harboring eQTNs; TC-GENEs: annotated genes of the TCs.
BP, CC, and MF are the three categories of gene ontology (GO), meaning biological process, cellular component, and molecular function, respectively; SP_PIR and InterPro are two non-GO databases. SP_PIR is a database of protein super-family names. InterPro is a database of protein families, domains, and functional sites.
As a follow-up to the above findings, we evaluated the expression profiles of genes that are important in nucleosome assembly. Histones and their related genes are involved in the maintenance of the structure of nucleosome and chromatin and thus are critical for the transcriptional efficiency of DNA. Our microarray probes cover at least 71 histones and 28 histone-related genes. Because most of the histone genes are clustered in the genome, they tend to be expressed in a similar pattern (Figure 3D), although at different levels (Figure 3E). A total of eight and 28 of these genes are associated with one or more eQTN_BLOCKs in the CEU and YRI, respectively (Figure 3E, Table S5). We found that one and seven in the CEU and two and 28 in the YRI histones, or their related genes, are associated with local and distant eQTNs in their respective population (see Table S5). Two histone genes, HIST1H3B [MIM ∗602819] and HIST1H2AB [MIM ∗602795], are associated with eQTN_BLOCKs in both CEU and YRI samples. More specifically, the expression of HIST1H3B is associated with 13 distinct eQTN_BLOCKs in the YRI. Among them, one local eQTN_BLOCK is also associated with HIST1H3B expression in the CEU. The gene expression of HIST1H2AB is associated with two nonoverlapping eQTN_BLOCKs, one for each population sample (see Table S5). Using a general linear model (GLM), we found that HIST1H3B, HIST1H3G [MIM ∗602815], and HIST1H1C [MIM ∗142710] are differentially expressed in the CEU and the YRI samples (PGLM = 1.59 × 10⁻⁷, 4.46 × 10⁻⁷, 1.32 × 10⁻⁵, respectively).23
In addition, we note that the genes harboring distant eQTNs are enriched in the cellular component of “membrane” and the biological process of synaptic transmission in the CEU (Table 2), and distant TC-GENES are enriched in the molecular function of transmembrane-receptor activity in the CEU (Table 2). In the YRI, the genes harboring the distant eQTNs are also enriched in the gene-ontology cellular-component category of membrane and the InterPro category of several integral membrane-protein families including EGF. However, TC-GENES do not exhibit enrichment in any annotations (Table 2). Our data demonstrate that transmembrane signal transduction is the major biological process related to the distant TC-eQTN associations in both populations.
Deleterious Nonsynonymous eQTNs
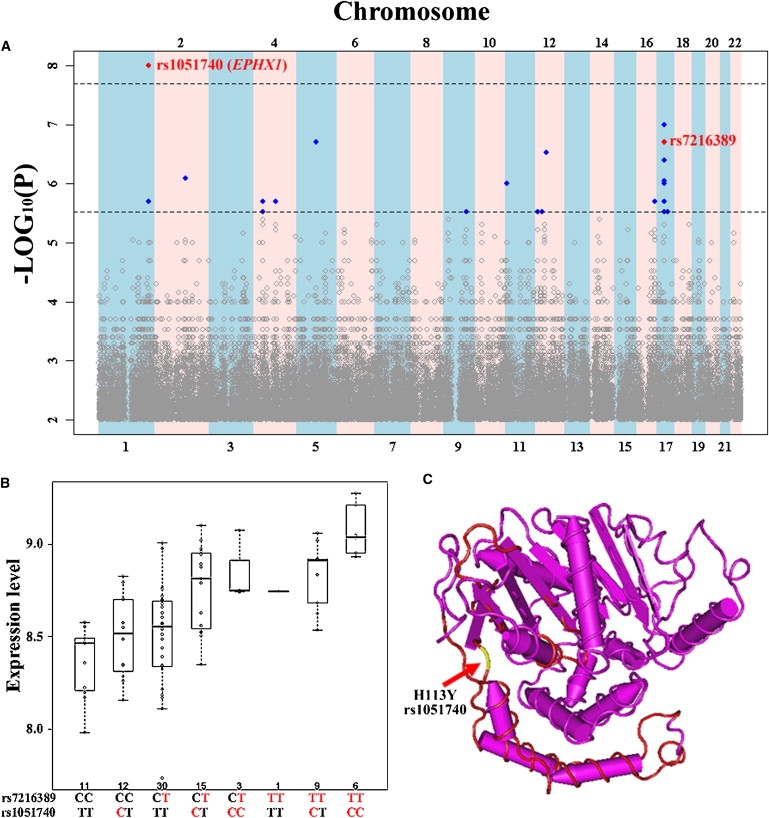
Three CEU eQTNs (rs724558 [T99I], rs1122326 [P2Q], rs1051740 [H113Y]) that result in deleterious nonsynonymous amino acid changes in SERPINB10 (MIM ∗602058), HSPB9 (MIM ∗608014), and EPHX1 (MIM +132810) genes, respectively, were identified with the SIFT program.31 These interesting eQTNs are associated with the gene expression of SERPINB10, LGP2 (MIM ∗608588) and ORMDL3 (MIM ∗610075) in the CEU samples, respectively. A significant association between rs7216389 and ORMDL3 gene expression was reported by Moffatt et al.32 In addition, we identified a more significant association of ORMDL3 gene expression with rs1051740 genotype (Figure 4A). We tested the association between SNP rs1051740 and gene expression of ORMDL3 in the CEU samples by using as a covariate the genotypes of SNP rs7216389, a SNP that was previously implicated in asthma (MIM 600807) susceptibility.32 The results show that SNP rs1051740 is significantly associated with its expression (p = 4 × 10⁻⁶), suggesting that SNP rs1051740 is contributing through an additive effect with SNP rs7216389 (Figure 4B) to expression of ORMDL3. A protein-domain search has shown that rs1051740 (amino acid connecting a β-sheet and α-helix in the conserved protein domain) is predicted to play an important role in maintaining the structure of EPHX1 (Epoxide hydrolase N terminus, CDD:69934) (Figure 4C).
Figure 4.
ORMDL3 Gene Expression Is Associated with SNP rs1051740 in the CEU
(A) The whole-genome association of ORMDL3 expression level in the CEU population.
(B) SNP rs1051740 and SNP rs7216389 have an additive effect on the expression of ORMDL3. The red allele denotes the allele corresponding to higher gene expression level of ORMDL3, which is implicated with higher risk of asthma susceptibility in the study of Moffatt et al.32
(C) The location of EPHX1_H113Y (rs1051740) in the conserved protein domain of EPHX1 (epoxide hydrolase N terminus, CDD:69934).
Discussion
We report 4,677 and 5,125 significant associations between eQTNs and TCs in the CEU and the YRI samples, respectively, by using a pairwise association of 12,747 transcriptional gene expression values with more than two million SNPs in samples of CEU and YRI ancestry. During the preparation of this paper, three other large-scale eQTL studies19–21 were reported. Goring et al.20 reported a genetical-genomics linkage study between 19,648 transcript-level expression phenotypes and 432 polymorphic microsatellites in 1,240 individuals. Dixon et al.21 carried out a global genetical-genomics association study between 15,084 transcript-level expression phenotypes and 408,273 SNPs in 400 children. Stranger et al.19 performed a local genetical-genomics association study between 14,456 transcript-level expression phenotypes and the local SNPs within 1 Mb physical distance, as well as a distant genetical-genomics association study between 14,456 transcript-level expression phenotypes and ∼25,000 selected SNPs in 270 HapMap samples. Although the present study has a smaller sample size (176 HapMap samples), we have performed a more extensive genetical-genomics association study with more than two million markers per expression phenotype, and thus provide enriched distant eQTN information for the expression phenotypes. By using the Affymetrix GeneChip Human Exon 1.0 ST array, our study has the advantage of determining expression levels of probes across the whole gene (5′-UTR, exons and 3′-UTR), which is considered a more accurate measure of gene expression.33 Previous studies utilizing earlier Affymetrix arrays (Affymetrix Focus array and U-133 series) are biased in that the oligonucleotides are designed at the 3′ end of the gene.14,21 Nonetheless, there are 54 (CEU: 30; YRI: 23) relationships between local genes and eQTNs common between our study and that of Stranger et al.19 Similarly, 45 (CEU: 39; YRI: 18) local genes overlap with the same eQTNs found in our study and the study of Dixon et al.21 (see Table S6).
Highlighted in the present study are eQTN_hotspot regions harboring pleiotropic eQTNs associated with expression phenotypes of multiple TCs. These hotspot regions are potentially important for the discovery of interactive gene-gene networks. The bin-based identification of eQTN_hotspot may be dependent on the LD pattern within the bin region. Among the hotspots found in our study, most hotspots harbor pleiotropic eQTNs associated with at least six TCs, and all hotspots harbor pleiotropic eQTNs associated with at least two TCs, even in the bin with low LD pattern. This suggests that the bin-based eQTN_hotspot approach is very efficient for highlighting the pleiotropic eQTNs among thousands of significant associations. We have identified TC-eQTN_BLOCK pairs to define independent genetic regions, each of which harbors a set of eQTNs associated with the expression of the same TC. Thus, we dramatically reduce the numbers of TC-eQTN pairs by taking into consideration the possibility that high LD may exist with eQTNs in close proximity associated with expression of the same TC.
Since genetically indistinguishable SNPs,34 which are in perfect LD (D' = 1, r2 = 1), may be associated with the same expression phenotypes of TCs, it is helpful to explore the biological significance of the identified eQTNs. We have evaluated whether the eQTNs are located in conserved regions, transcription-factor binding-site motifs, or transcription-factor genes. Despite the fact that we did not find significant enrichment in the above biologically important DNA segments for the eQTNs, we have identified in the CEU samples three eQTNs (rs724558 [SERPINB10_T99I], rs1122326 [HSPB9_P2Q], rs1051740 [EPHX1_H113Y]) that result in deleterious nonsynonymous amino acid changes in three genes, SERPINB10, HSPB9, and EPHX1, respectively. Moreover, the prediction using orthologs and homologs in the protein alignments suggests that the minor allele of these SNPs is potentially undermining protein function. These three eQTNs (rs724558, rs1122326, rs1051740) are associated with the expression level of SERPINB10, LGP2, and ORMDL3, respectively. SERPINB10 belongs to the superfamily of high-molecular-weight serine proteinase inhibitors (serpins), which are mainly clustered on human chromosome 18 and are key regulatory proteins in important biologic processes.35 A report has shown in the SERPINB10 gene two other missense variations (rs8097425 and rs963075) conferring important risks for prostate cancer.36 The LGP2 gene is 21 kb away from HSPB9 in the reverse direction. LGP2, a RNA helicase with multiple functionally important domains, is involved in the regulation of interferon production, and thus has potential therapeutic implications for immune regulation.37 The association between the local eQTN (rs1122326) and the transcript level of LGP2 provides a new clue for exploring the features of the LGP2 gene.
EPHX1 is one of the epoxide hydrolases, which play an important role in both the activation and detoxification of exogenous chemicals. This EPHX1 variation (H113Y, rs1051740) was reported to reduce EPHX activity by approximately 40%.38 It has been suggested to be responsible for genetic susceptibility to multiple diseases including lymphoproliferative disorder,39 preeclampsia,40 emphysema, and chronic obstructive pulmonary disease.41 In the present study, we found that this specific EPHX1 variation (rs1051740) is distantly associated with expression level of ORMDL3. The minor allele “C” of rs1051740 corresponds to a lower EPHX1 activity38 and higher expression of ORMDL3 (Figure 4B), a gene that has been shown to be associated with susceptibility to childhood asthma.32 In addition, our study also confirmed Moffatt et al.'s findings32 that the T allele at SNP rs7216389 is associated with higher expression of the ORMDL3 gene, though at a less significant level. A protein-domain search has shown that rs1051740 affects the amino acid connecting a β-sheet and α-helix in the conserved domain, thus playing an important role in maintaining the structure of the EPHX1 protein. Moreover, a test for interaction between SNP rs7216389 and rs1051740 revealed that these SNPs are additive with respect to expression of the ORMDL3 gene. Another independent study has shown that higher EPHX1 activity is associated with an increase risk for lifetime asthma,42 although it seems to be converse to our hypothesis that EPHX1 variation (rs1051740-C) leads to lower EPHX1 activity38 and distantly upregulates the expression of ORMDL3, thus contributing to an increased risk for asthma.32 Our results suggest that a stratified study using rs1051740 genotypes may help investigators clarify the effect of EPHX1 and other candidate genes on the complex disease of asthma.
There are 67 and 65 gene-expression phenotypes locally associated with one or more SNPs in the CEU or YRI population samples, respectively, and 691 and 1,665 gene-expression phenotypes distantly associated with one or more SNPs in the CEU or YRI population samples, respectively. There are several explanations that there are more distant TCs found in the YRI than in the CEU. One possibility is that there are 9% more SNPs evaluated in YRI compared to CEU (2.29 million versus 2.1 million) population. Another factor could be the larger size of the linkage disequilibrium blocks observed in the CEU compared to the YRI (16.3 Kb for CEU versus 7.3 Kb for YRI),43 implying that there are fewer genetically indistinguishable SNPs in the YRI than in the CEU. Thus, given the higher spectrum of SNP panels in the YRI samples, the SNPs in the YRI might have a higher possibility of being associated with the expression of one or more TCs than those in the CEU.
Although similar numbers of eQTNs have been identified in the CEU (3,902) and in the YRI (4,148), only a fraction of the eQTNs are associated with the same expression phenotypes in both population samples (243). To determine whether this is simply an effect of a stringent p value threshold (2 × 10⁻⁸), we chose the common SNPs (2,500 in CEU and 2,729 in YRI) that have a minor allele frequency > 5% to test for significance in their counterpart population samples. These 2,500 and 2,729 eQTNs are involved in 3,196 and 3,098 significant TC-eQTN associations in the YRI and CEU, respectively. We identified 384 (see Table S7) and 318 (see Table S8) significant TC-SNP pairs by using a less stringent p value cutoff of 1.6 × 10⁻⁵ in the CEU and YRI, respectively. All these TC-eQTN associations are local (p < 1.6 × 10⁻⁵), and the best p values for the distant TC-eQTN associations are only 0.0004 and 0.001 in the CEU and YRI population samples, respectively (data not shown), suggesting that the distant associations are highly population specific. In addition, given an arbitrary p value cutoff without taking into account the redundancy of SNPs in high LD in the current study, a more appropriate way to define a significant cutoff is to use a nonparametric simulation method. Therefore, we randomly selected 400 distant TC-eQTN associations from each population and performed a simulation (n = 10,000) to determine the empirical p values. We showed that almost all (>99.5%) of the randomly selected distant TC-SNP associations could be validated by simulation.
As a result of the high density of SNPs selected in this study, we expect to see a large degree of redundancy among the eQTNs. This was, in fact, observed between the TC-eQTN pairs through the topological demonstration of the relationships between eQTNs and their associated TCs (see Figure S1). Not surprisingly, TC-eQTN pairs in the CEU have higher redundancy than those in the YRI, because the average length of LD blocks in the CEU is more than twice that in the YRI (16.3 Kb versus 7.3 Kb).36 As shown in Figure S2, the redundancy mainly lies within the local TC-eQTN pairs. The replacement of the TC-eQTN pairs with TC-eQTN_BLOCK pairs efficiently reduces the redundancy without sacrificing the ability to detect interactive networks (see Figure S1). Our genetical-genomics association study revealed 4,677 and 5,125 significant TC-eQTN pairs in the CEU and the YRI samples, respectively. These TC-eQTN pairs can be further represented by 67 local TC-eQTN_BLOCK pairs, 50 distant same-chromosome TC-eQTN_BLOCK pairs, and 1,024 distant different-chromosome TC-eQTN_BLOCK pairs in the CEU and by 65 local TC-eQTN_BLOCK pairs, 118 distant same-chromosome TC-eQTN_BLOCK pairs, and 2,668 distant different-chromosome TC-eQTN_BLOCK pairs in the YRI (Table 1). A significantly higher proportion of distant TC-eQTN_BLOCK pairs are observed in the YRI compared to the CEU (X2 = 31.8, df = 1, p = 1.7 × 10⁻⁸).
The enrichment analysis in functional-annotation categories has suggested that the regulation of gene expression extensively involves histone genes, which are important for packaging the DNA into a higher-order chromatin structure and therefore fundamental for controlling gene expression. The expression patterns of histones and their related genes are similar within each subgroup, suggesting that regulation of expression of the genes in each subgroup may be closely related. The active involvement of histones and their related genes in the transcript-level regulation imply that a complex interactive network exists. The divergence in the expression levels of histones (HIST1H3B, HIST1H3G, and HIST1H1C) and the numbers and modes of histone-related TC-eQTN pairs leads us to hypothesize that there might be differential hierarchical regulation of transcript-level expression between the CEU and YRI. Further experimentation is required to test this hypothesis. Distant eQTNs tend to be associated with the expression phenotypes of genes involved with transmembrane signal transduction, implying that the distant regulation of transcript-level expression can be an indirect cascade mode.
This study presents a global view of the genetic background for the transcriptomic differences in populations. The data analysis can be applied in other QTL studies. The generated eQTN information can be integrated to provide further insight into the regulation of gene expression associated with genetic findings in QTL mapping studies. These data can serve as a rich resource to supplement findings from a wide variety of genetic studies including candidate gene, linkage, and genome-wide association studies.
Supplemental Data
Two figures and eight tables are available at http://www.ajhg.org/.
Supplemental Data
Web Resources
The URLs for data presented herein are as follows:
Affymetrix Exon Array manufacturer's recommendation: http://www.affymetrix.com/products/arrays/exon_application.affx
dbSNP database: http://www.ncbi.nlm.nih.gov/projects/SNP
Gene Expression Omnibus database (GEO): http://www.ncbi.nlm.nih.gov/geo
HapMap project: http://www.hapmap.org
MultiExperiment Viewer: http://www.tm4.org/mev.html
Online Mendelian Inheritance in Man (OMIM), http://www.ncbi.nlm.nih.gov/Omim
PAAR Group: http://pharmacogenetics.org
PharmGKB: http://www.pharmgkb.org
Technique support of the Affymetrix Human Exon Array: http://www.affymetrix.com/support/technical/whitepapers/exon_probeset_trans_clust_whitepaper.pdf
UCSC Genome Bioinformatics: http://genome.ucsc.edu
Acknowledgments
We thank the International HapMap Consortium for data availability and Jeong-Ah Kang for maintaining cell lines. This Pharmacogenetics of Anticancer Agents Research (PAAR) Group study was supported by National Institutes of Health/National Institute of General Medical Sciences grant U01GM61393. PAAR data have been deposited into PharmGKB, a knowledge base supported by U01GM61374. Gene-expression data are deposited in Gene Expression Omnibus: GSE7851. Four authors of this manuscript (T.A.C., T.X.C., A.C.S., and J.E.B.) are employees of Affymetrix Inc., Santa Clara, CA 95051. Their employment with Affymetrix could be construed as a conflict of interest because they may indirectly benefit from sales of Affymetrix GeneChip Human Exon 1.0 ST array.
References
- 1.Huang R.S., Duan S., Bleibel W.K., Kistner E.O., Zhang W., Clark T.A., Chen T.X., Schweitzer A.C., Blume J.E., Cox N.J., Dolan M.E. A genome-wide approach to identify genetic variants that contribute to etoposide-induced cytotoxicity. Proceedings of the National Academy of Sciences of the United States of America. 2007;104:9758–9763. doi: 10.1073/pnas.0703736104. [DOI] [PMC free article] [PubMed] [Google Scholar]
- 2.Huang R.S., Duan S., Shukla S.J., Kistner E.O., Clark T.A., Chen T.X., Schweitzer A.C., Blume J.E., Dolan M.E. Identification of genetic variants contributing to Cisplatin-induced cytotoxicity by use of a genomewide approach. Am. J. Hum. Genet. 2007;81:427–437. doi: 10.1086/519850. [DOI] [PMC free article] [PubMed] [Google Scholar]
- 3.Rockman M.V., Kruglyak L. Genetics of global gene expression. Nat. Rev. Genet. 2006;7:862–872. doi: 10.1038/nrg1964. [DOI] [PubMed] [Google Scholar]
- 4.Brem R.B., Yvert G., Clinton R., Kruglyak L. Genetic dissection of transcriptional regulation in budding yeast. Science. 2002;296:752–755. doi: 10.1126/science.1069516. [DOI] [PubMed] [Google Scholar]
- 5.Jansen R.C., Nap J.P. Genetical genomics: The added value from segregation. Trends Genet. 2001;17:388–391. doi: 10.1016/s0168-9525(01)02310-1. [DOI] [PubMed] [Google Scholar]
- 6.DeCook R., Lall S., Nettleton D., Howell S.H. Genetic regulation of gene expression during shoot development in Arabidopsis. Genetics. 2006;172:1155–1164. doi: 10.1534/genetics.105.042275. [DOI] [PMC free article] [PubMed] [Google Scholar]
- 7.Salvi S., Sponza G., Morgante M., Tomes D., Niu X., Fengler K.A., Meeley R., Ananiev E.V., Svitashev S., Bruggemann E. Conserved noncoding genomic sequences associated with a flowering-time quantitative trait locus in maize. Proc. Natl. Acad. Sci. USA. 2007;104:11376–11381. doi: 10.1073/pnas.0704145104. [DOI] [PMC free article] [PubMed] [Google Scholar]
- 8.Li Y., Alvarez O.A., Gutteling E.W., Tijsterman M., Fu J., Riksen J.A., Hazendonk E., Prins P., Plasterk R.H., Jansen R.C. Mapping determinants of gene expression plasticity by genetical genomics in C. elegans. PLoS Genet. 2006;2:e222. doi: 10.1371/journal.pgen.0020222. [DOI] [PMC free article] [PubMed] [Google Scholar]
- 9.Hubner N., Wallace C.A., Zimdahl H., Petretto E., Schulz H., Maciver F., Mueller M., Hummel O., Monti J., Zidek V. Integrated transcriptional profiling and linkage analysis for identification of genes underlying disease. Nat. Genet. 2005;37:243–253. doi: 10.1038/ng1522. [DOI] [PubMed] [Google Scholar]
- 10.Bystrykh L., Weersing E., Dontje B., Sutton S., Pletcher M.T., Wiltshire T., Su A.I., Vellenga E., Wang J., Manly K.F. Uncovering regulatory pathways that affect hematopoietic stem cell function using ‘genetical genomics.’. Nat. Genet. 2005;37:225–232. doi: 10.1038/ng1497. [DOI] [PubMed] [Google Scholar]
- 11.Schadt E.E., Lamb J., Yang X., Zhu J., Edwards S., Guhathakurta D., Sieberts S.K., Monks S., Reitman M., Zhang C. An integrative genomics approach to infer causal associations between gene expression and disease. Nat. Genet. 2005;37:710–717. doi: 10.1038/ng1589. [DOI] [PMC free article] [PubMed] [Google Scholar]
- 12.Chesler E.J., Lu L., Shou S., Qu Y., Gu J., Wang J., Hsu H.C., Mountz J.D., Baldwin N.E., Langston M.A. Complex trait analysis of gene expression uncovers polygenic and pleiotropic networks that modulate nervous system function. Nat. Genet. 2005;37:233–242. doi: 10.1038/ng1518. [DOI] [PubMed] [Google Scholar]
- 13.Wang X., Tomso D.J., Chorley B.N., Cho H.Y., Cheung V.G., Kleeberger S.R., Bell D.A. Identification of polymorphic antioxidant response elements in the human genome. Hum. Mol. Genet. 2007;16:1188–1200. doi: 10.1093/hmg/ddm066. [DOI] [PMC free article] [PubMed] [Google Scholar]
- 14.Cheung V.G., Spielman R.S., Ewens K.G., Weber T.M., Morley M., Burdick J.T. Mapping determinants of human gene expression by regional and genome-wide association. Nature. 2005;437:1365–1369. doi: 10.1038/nature04244. [DOI] [PMC free article] [PubMed] [Google Scholar]
- 15.Deutsch S., Lyle R., Dermitzakis E.T., Attar H., Subrahmanyan L., Gehrig C., Parand L., Gagnebin M., Rougemont J., Jongeneel C.V., Antonarakis S.E. Gene expression variation and expression quantitative trait mapping of human chromosome 21 genes. Hum. Mol. Genet. 2005;14:3741–3749. doi: 10.1093/hmg/ddi404. [DOI] [PubMed] [Google Scholar]
- 16.Monks S.A., Leonardson A., Zhu H., Cundiff P., Pietrusiak P., Edwards S., Phillips J.W., Sachs A., Schadt E.E. Genetic inheritance of gene expression in human cell lines. Am. J. Hum. Genet. 2004;75:1094–1105. doi: 10.1086/426461. [DOI] [PMC free article] [PubMed] [Google Scholar]
- 17.Morley M., Molony C.M., Weber T.M., Devlin J.L., Ewens K.G., Spielman R.S., Cheung V.G. Genetic analysis of genome-wide variation in human gene expression. Nature. 2004;430:743–747. doi: 10.1038/nature02797. [DOI] [PMC free article] [PubMed] [Google Scholar]
- 18.Stranger B.E., Forrest M.S., Clark A.G., Minichiello M.J., Deutsch S., Lyle R., Hunt S., Kahl B., Antonarakis S.E., Tavare S. Genome-wide associations of gene expression variation in humans. PLoS Genet. 2005;1:e78. doi: 10.1371/journal.pgen.0010078. [DOI] [PMC free article] [PubMed] [Google Scholar]
- 19.Stranger B.E., Nica A.C., Forrest M.S., Dimas A., Bird C.P., Beazley C., Ingle C.E., Dunning M., Flicek P., Koller D. Population genomics of human gene expression. Nat. Genet. 2007;39:1217–1224. doi: 10.1038/ng2142. [DOI] [PMC free article] [PubMed] [Google Scholar]
- 20.Goring H.H., Curran J.E., Johnson M.P., Dyer T.D., Charlesworth J., Cole S.A., Jowett J.B., Abraham L.J., Rainwater D.L., Comuzzie A.G. Discovery of expression QTLs using large-scale transcriptional profiling in human lymphocytes. Nat. Genet. 2007;39:1208–1216. doi: 10.1038/ng2119. [DOI] [PubMed] [Google Scholar]
- 21.Dixon A.L., Liang L., Moffatt M.F., Chen W., Heath S., Wong K.C., Taylor J., Burnett E., Gut I., Farrall M. A genome-wide association study of global gene expression. Nat. Genet. 2007;39:1202–1207. doi: 10.1038/ng2109. [DOI] [PubMed] [Google Scholar]
- 22.The International HapMap Consortium The International HapMap Project. Nature. 2003;426:789–796. doi: 10.1038/nature02168. [DOI] [PubMed] [Google Scholar]
- 23.Zhang W., Duan S., Kistner E.O., Bleibel W.K., Huang R.S., Clark T.A., Chen T.X., Schweitzer A.C., Blume J.E., Cox N.J., Dolan M.E. Evaluation of genetic variation contributing to differences in gene expression between populations. Am. J. Hum. Genet. 2008;82:631–640. doi: 10.1016/j.ajhg.2007.12.015. [DOI] [PMC free article] [PubMed] [Google Scholar]
- 24.Abecasis G.R., Cardon L.R., Cookson W.O. A general test of association for quantitative traits in nuclear families. Am. J. Hum. Genet. 2000;66:279–292. doi: 10.1086/302698. [DOI] [PMC free article] [PubMed] [Google Scholar]
- 25.Abecasis G.R., Cookson W.O., Cardon L.R. Pedigree tests of transmission disequilibrium. Eur. J. Hum. Genet. 2000;8:545–551. doi: 10.1038/sj.ejhg.5200494. [DOI] [PubMed] [Google Scholar]
- 26.Benjamini Y., Hochberg Y. Controlling the false discovery rate: A practical and powerful approach to multiple testing. Journal of the Royal Statistical Society B. 1995;57:289–300. [Google Scholar]
- 27.Eisen M.B., Spellman P.T., Brown P.O., Botstein D. Cluster analysis and display of genome-wide expression patterns. Proc. Natl. Acad. Sci. USA. 1998;95:14863–14868. doi: 10.1073/pnas.95.25.14863. [DOI] [PMC free article] [PubMed] [Google Scholar]
- 28.Saeed A.I., Sharov V., White J., Li J., Liang W., Bhagabati N., Braisted J., Klapa M., Currier T., Thiagarajan M. TM4: A free, open-source system for microarray data management and analysis. Biotechniques. 2003;34:374–378. doi: 10.2144/03342mt01. [DOI] [PubMed] [Google Scholar]
- 29.Messina D.N., Glasscock J., Gish W., Lovett M. An ORFeome-based analysis of human transcription factor genes and the construction of a microarray to interrogate their expression. Genome Res. 2004;14:2041–2047. doi: 10.1101/gr.2584104. [DOI] [PMC free article] [PubMed] [Google Scholar]
- 30.Yvert G., Brem R.B., Whittle J., Akey J.M., Foss E., Smith E.N., Mackelprang R., Kruglyak L. Trans-acting regulatory variation in Saccharomyces cerevisiae and the role of transcription factors. Nat. Genet. 2003;35:57–64. doi: 10.1038/ng1222. [DOI] [PubMed] [Google Scholar]
- 31.Ng P.C., Henikoff S. Predicting deleterious amino acid substitutions. Genome Res. 2001;11:863–874. doi: 10.1101/gr.176601. [DOI] [PMC free article] [PubMed] [Google Scholar]
- 32.Moffatt M.F., Kabesch M., Liang L., Dixon A.L., Strachan D., Heath S., Depner M., von Berg A., Bufe A., Rietschel E. Genetic variants regulating ORMDL3 expression contribute to the risk of childhood asthma. Nature. 2007;448:470–473. doi: 10.1038/nature06014. [DOI] [PubMed] [Google Scholar]
- 33.Kapur K., Xing Y., Ouyang Z., Wong W.H. Exon arrays provide accurate assessments of gene expression. Genome Biol. 2007;8:R82. doi: 10.1186/gb-2007-8-5-r82. [DOI] [PMC free article] [PubMed] [Google Scholar]
- 34.Lawrence R., Evans D.M., Morris A.P., Ke X., Hunt S., Paolucci M., Ragoussis J., Deloukas P., Bentley D., Cardon L.R. Genetically indistinguishable SNPs and their influence on inferring the location of disease-associated variants. Genome Res. 2005;15:1503–1510. doi: 10.1101/gr.4217605. [DOI] [PMC free article] [PubMed] [Google Scholar]
- 35.Schleef R.R., Chuang T.L. Protease inhibitor 10 inhibits tumor necrosis factor alpha -induced cell death. Evidence for the formation of intracellular high M(r) protease inhibitor 10-containing complexes. J. Biol. Chem. 2000;275:26385–26389. doi: 10.1074/jbc.C000389200. [DOI] [PubMed] [Google Scholar]
- 36.Shioji G., Ezura Y., Nakajima T., Ohgaki K., Fujiwara H., Kubota Y., Ichikawa T., Inoue K., Shuin T., Habuchi T. Nucleotide variations in genes encoding plasminogen activator inhibitor-2 and serine proteinase inhibitor B10 associated with prostate cancer. J. Hum. Genet. 2005;50:507–515. doi: 10.1007/s10038-005-0285-1. [DOI] [PubMed] [Google Scholar]
- 37.Saito T., Hirai R., Loo Y.M., Owen D., Johnson C.L., Sinha S.C., Akira S., Fujita T., Gale M. Regulation of innate antiviral defenses through a shared repressor domain in RIG-I and LGP2. Proc. Natl. Acad. Sci. USA. 2007;104:582–587. doi: 10.1073/pnas.0606699104. [DOI] [PMC free article] [PubMed] [Google Scholar]
- 38.Hassett C., Aicher L., Sidhu J.S., Omiecinski C.J. Human microsomal epoxide hydrolase: Genetic polymorphism and functional expression in vitro of amino acid variants. Hum. Mol. Genet. 1994;3:421–428. doi: 10.1093/hmg/3.3.421. [DOI] [PMC free article] [PubMed] [Google Scholar]
- 39.Sarmanova J., Benesova K., Gut I., Nedelcheva-Kristensen V., Tynkova L., Soucek P. Genetic polymorphisms of biotransformation enzymes in patients with Hodgkin's and non-Hodgkin's lymphomas. Hum. Mol. Genet. 2001;10:1265–1273. doi: 10.1093/hmg/10.12.1265. [DOI] [PubMed] [Google Scholar]
- 40.Zusterzeel P.L., Peters W.H., Visser W., Hermsen K.J., Roelofs H.M., Steegers E.A. A polymorphism in the gene for microsomal epoxide hydrolase is associated with pre-eclampsia. J. Med. Genet. 2001;38:234–237. doi: 10.1136/jmg.38.4.234. [DOI] [PMC free article] [PubMed] [Google Scholar]
- 41.Smith C.A., Harrison D.J. Association between polymorphism in gene for microsomal epoxide hydrolase and susceptibility to emphysema. Lancet. 1997;350:630–633. doi: 10.1016/S0140-6736(96)08061-0. [DOI] [PubMed] [Google Scholar]
- 42.Salam M.T., Lin P.C., Avol E.L., Gauderman W.J., Gilliland F.D. Microsomal epoxide hydrolase, glutathione S-transferase P1, traffic and childhood asthma. Thorax. 2007;62:1050–1057. doi: 10.1136/thx.2007.080127. [DOI] [PMC free article] [PubMed] [Google Scholar]
- 43.International HapMap Consortium A haplotype map of the human genome. Nature. 2005;437:1299–1320. doi: 10.1038/nature04226. [DOI] [PMC free article] [PubMed] [Google Scholar]
Associated Data
This section collects any data citations, data availability statements, or supplementary materials included in this article.