

Abstract
Manganese superoxide dismutase (MnSOD) is an anti-oxidant enzyme essential for the survival of life. We have reported that NF-κB is essential but not sufficient for the synergistic induction of MnSOD by phorbol 12-myristate 13-acetate and cytokines. To further identify transcription factors and co-activators that participate in the induction of MnSOD, we used NF-κB affinity chromatography to isolate potential NF-κB interacting proteins. Proteins eluted from the NF-κB affinity column were subjected to proteomic analysis and verified by Western analysis. Nucleophosmin (NPM), a nucleolar phosphoprotein, is the most abundant single protein identified. Co-immunoprecipitation studies suggest a physical interaction between NPM and NF-κB proteins. To verify the role of NPM on MnSOD gene transcription, cells were transfected with constructs expressing NPM in sense or antisense orientation as well as interference RNA. The results indicate that an increase NPM expression leads to increased MnSOD gene transcription in a dose-dependent manner. Consistent with this, expression of small interfering RNA for NPM leads to inhibition of MnSOD gene transcription but does not have any effect on the expression of interleukin-8, suggesting that the effect of NPM is selective. These results identify NPM as a partner of the NF-κB transcription complex in the induction of MnSOD by phorbol 12-myristate 13-acetate and cytokines.
Superoxide dismutases (SODs)1 are the first line of cellular defense against the damaging effects of superoxide anion radicals (1). MnSOD is a highly regulated SOD exclusively localized in mitochondria but coded by the SOD2 gene located on human chromosome 6q25.3 (2, 3). Accumulating studies show that increased cellular levels of MnSOD are cytoprotective against oxidative stress (4), inflammatory responses, tumor necrosis factor α (TNF-α) (5, 6), interleukin-1 β (IL-1 β) (7), 12-O-tetradecanoylphorbol-13-acetate (8), ionizing radiation (9, 10), and neurotoxins (11, 12). The critical role of MnSOD as a cytoprotective enzyme is illustrated in both MnSOD knockout and transgenic animal models. For instance, MnSOD knockout mice develop cardiomyopathy and die within 10 days after birth (13). MnSOD knockout mice treated with a SOD mimetic were protected from systemic toxicity and from neonatal lethality (14). Conversely, transgenic mice overexpressing human MnSOD experienced less toxic injury resulting from inflammation (15), acute adriamycin-induced cardiac injury (16), and ischemia-induced brain injury (17). Additionally, several contemporary studies suggest that MnSOD may act as a tumor-suppressor gene (18-21) by modulating redox-sensitive transcription factors (22).
The human MnSOD (SOD2) gene is a single-copy gene consisting of five exons interrupted by four introns with a typical splice junction (23). The SOD2 gene from human, bovine, rat, and mouse share more than 90% homology in the coding sequence; the 5′-flanking regions are less homologous between human and other species (24). Sequence analysis of the 5′- and 3′-flanking regions reveal multiple potential regulatory motifs for NF-κB, AP-1, AP-2, and Sp1 bindings. The 5′ proximal promoter in the SOD2 gene is characterized by a lack of TATA or CAAT box, but it is rich in GC boxes. The basal promoter of the SOD2 gene has multiple transcription factor binding motifs containing Sp1 and AP-2 binding sites. Functional studies in different cell lines with different levels of Sp1 protein suggest that cellular levels of this protein might be differentially regulated via GC binding motifs in the human MnSOD promoter. Site-directed mutagenesis of Sp1 and AP-2 binding sites shows that Sp1 is essential for transcription of the SOD2 gene, whereas AP-2 plays a negative role on transcription. AP-2 down-regulates the transcription of MnSOD through interaction with Sp1 in the promoter region (25-27). The binding of Sp1 and AP-2 proteins to their recognition sites generates a specific DNA looping structure required for cooperative activation of other regulatory proteins and recruitment of co-activators of the MnSOD gene (28). In addition to Sp1 and AP-2, the basal promoter also contains binding sites for transcription modulators including the early growth protein, Egr-1. Interestingly, Egr-1 appears to play a negative role on basal promoter activity without affecting the 12-O-tetradecanoylphorbol-13-acetate-mediated activation of the human MnSOD promoter (29).
The SOD2 gene of mice and humans contains enhancer elements in the second intron of the gene (30, 31). Functional analyses of enhancer elements demonstrate that the intronic element consists of binding motifs for NF-κB, C/EBP, and NF-1, which are responsive to TNF-α and IL-1β. The activation of NF-κB is essential but not sufficient for the induction of MnSOD by TNF-α and IL-1β (32). NF-κB forms various homo-and heterodimer units among the mammalian subunits of p50, p52, p65 (Rel A), c-Rel, and Rel B. These dimer units in turn bind to a group of NF-κB DNA binding sites with different affinities within the target gene (33, 34).
The role of Sp1 on NF-κB-mediated induction of the SOD2 gene is unclear. Whereas it has been shown that Sp1 interferes with the DNA binding sites of NF-κB (35), other studies demonstrate that Sp1 bound to distal enhancer regions can interact with Sp1 bound at sites proximal to the promoter and synergistically activates transcription (36). Mastrangelo et al. (28) have shown that this synergism is likely a direct consequence of interactions between the distal and proximal Sp1 protein through a loop formation. Loop formation may lead to increased concentration of the activator protein. Such double stem-loop structures favor activation of some specific proteins (such as RNA binding proteins) to bind with the loop structure.
An important RNA-binding protein, nucleophosmin (NPM) is ubiquitously expressed and continuously shuttled between nucleus and cytoplasm. It was originally identified as functioning in the assembly and transport of ribosome. Recently, expression of NPM has been implicated in modulating active cellular processes such as transcription, DNA replication, and apoptosis (37). Nucleophosmin can relieve the transcription response of several mammalian genes by the transcription factor YY1 (38). The relief of YY1-induced transcriptional repression is achieved by its ability to interact with the YY1 protein. It has been shown that NPM regulates the stability of the transcriptional activity of p53 (39). Furthermore, NPM rapidly up-regulates and has been considered to be an immediate early response gene induced by damaged DNA. Interestingly, expression of nucleophosmin is increased in human myometrium during labor (40). The increase in NPM levels is associated with an increase in MnSOD levels during labor, suggesting a link between NPM and MnSOD expression. However, it is not known whether and how the expression of nucleophosmin affects the expression of MnSOD.
In this study, we use proteomic, immunoprecipitation, site-directed mutagenesis, gene transfection, and gene knock-down approaches to demonstrate that NPM enhances MnSOD transcription by interacting with NF-κB. The results identify NPM as an NF-κB co-activator that regulates the expression of Mn-SOD by interacting with NF-κB in response to PMA and cytokine treatment. It is possible that NPM may be a key factor that enables the induction of the housekeeping gene.
EXPERIMENTAL PROCEDURES
Cell Culture
The human hepatocarcinoma cell line HepG2 was purchased from American Type Culture Collection (Manassas, VA). Cells were grown in a 5% CO2 incubator at 37 °C in media consisting of Dulbecco’s modified Eagle’s/Ham’s F-12 medium (Sigma) supplemented with 10% (v/v) fetal bovine serum (Hyclone Inc., Logan, UT), 1% (w/v) L-glutamine (Invitrogen), 1% PSN antibiotic (Invitrogen), and 1 mg/ml insulin (Invitrogen) as a growth factor.
Reagents
Unless otherwise stated, all antibodies were purchased from Santa Cruz Biotechnology (Santa Cruz, CA). Anti-β-actin monoclonal antibody and anti-NPM-V5-epitope antibodies were purchased from Sigma and Invitrogen, respectively. Rabbit polyclonal MnSOD antibody and GAPDH antibodies were purchased from Upstate Biotechnologies (Lake Placid, NY). All chemicals were purchased from Sigma, unless otherwise indicated.
Construction of Plasmid
A BamHI fragment (B7) containing a 3.4-kb 5′-flanking region was used to generate the -555 to +24 basal MnSOD promoter by polymerase chain reaction. To create this construct, PCR primers with recognition sequences KpnI (upstream) and BglII (downstream) restriction sites were added for subcloning at the upstream of the luciferase reporter gene. To generate the intronic fragment (I2E) (1742 to 2083) constructs, a BamHI-digested 39b λ phase DNA, containing the entire human MnSOD gene (8074 bp), was used as the template for PCR amplification with a primer having a BglII artificial restriction site. The PCR product was then ligated to the BglII site of the -555 to +24 basal promoter containing pGL3 vector, which yielded the natural orientation of the gene. The following primer sets were used to generate the aforementioned constructs (the underlined sequences are the artificial KpnI and BglII recognition sites in the forward and reverse strand primers, respectively, or the BglII recognition site in both forward and reverse strands): forward primer (-555), 5′-CGGGGTACCCGCTGGCTCTACCCTCAGCTCATA-3′; reverse primer (+24), 5′-GGAAGATCTGCCGAAGCCACCACAGCCACGAGT-3′; forward primer (+1742), 5′-GGAAGATCTCGGGGTTATGAAATTTGTTGAGTA-3′; reverse primer (+2083), 5′-GGAAGATCTCCACAAGTAAAGGACTGAAATTAA-3′. After amplification of the human MnSOD basal promoter (-555 to +24), the system was subcloned into the pGL3 basic vector (Promega, Madison, WI) containing the luciferase gene. PCR amplified I2E fragments were directly subcloned downstream of the human MnSOD basal promoter. Site-specific mutations on the NF-κB binding region in the I2E construct were prepared by the Chameleon™ double-stranded site-directed mutagenesis kit (Stratagene, La Jolla, CA) as previously reported (31).
pcDNA3.1/NPM(B23), a cDNA clone, is a ras-gene™-constructed NPM expression vector obtained from Invitrogen. The presence of a cDNA insert within the vector was confirmed by restriction digestion. For construction of antisense NPM, pcDNA3.1/NPM plasmid DNA was used as the PCR template and primer with HindIII and BglII artificial restriction sites (underlined sequences) in the forward and reverse strand primers, respectively, and were used as follows: forward primer, 5′-TCAAAGCTTTCACGGTTGTGAACTAAAGGCCGA-3′; reverse primer, 5′-ATCGGAAGATCTTTACCTTCGAATGGGTGACCT-3′.
After amplification, the PCR product was subcloned into the pCMV vector at the multicloning site in the antisense orientation. The nucleotide sequence and orientations of all constructs were confirmed by automated DNA sequencing.
Transient Transfection and Luciferase Assay
HepG2 cells were grown in Dulbecco’s modified Eagle’s medium supplemented with fetal bovine serum, L-glutamine, insulin, and PSN antibiotics. 70–80% confluent cells were achieved within 24 h by plating the cells at a density of 2 × 10⁶ in a 100 × 20-mm cell culture dish. The cells were then transfected with plasmids following a modified calcium phosphate method as described previously (41). Cells were co-transfected with 6 μ M plasmid DNA constructs containing the intronic enhancer fragment (I2E) of the human MnSOD gene in the pGL3 reporter gene and pRL-TK (Promega) containing Renilla cDNA at 1/10th the molar concentration of the I2E construct. Eight hours after transfection, the cells were washed twice with PBS and incubated in fresh medium. Twenty-four hours later, transfected cells were trypsinized and replated in a 24-well plate at a density of 105 cells per well. After an additional 24 h, cells were treated either independently or in combination with 200 IU/ml recombinant human TNF-α (R & D Systems, Minneapolis, MN), 100 nM PMA (Sigma), and 2 ng/ml IL-1β (Endogen, Woburn, MA). Twelve hours post-treatment, the cells were washed with PBS and lysed in passive lysis buffer (Promega). Similarly, NPM expression vector (pcDNA3.1/NPM) and antisense NPM vector (pCMV/ASNPM) were individually co-transfected with I2E containing pGL3 reporter vectors in subconfluent HepG2 cells. After 24 h, cells were washed with PBS, trypsinized, and replated in a 12-well plate at a density of 1.5 × 10⁵ cells per well. After another 24 h, cells were treated with a PMA and cytokine combination for 12 h in the same manner as described above. Then the cells were lysed in passive lysis buffer (Promega); cell lysates were collected, and the samples were analyzed with the dual luciferase reporter assay system (Promega), in accordance with the manufacturer’s instructions, in a TD-20/20 luminometer (Turner Designs, Sunnyvale, CA).
Nuclear Extract Preparation
Nuclei were isolated from HepG2 cells as described by Dignam and co-workers (42). Subconfluent monolayers of cells were collected and centrifuged at 100 × g for 2 min at 4 °C. Cell pellets were resuspended in buffer A containing 10 mM HEPES (pH 7.9), 1.5 mM MgCl2, 10 mM KCl, 0.5 mM dithiothretol (DTT), and 0.2 mM phenylmethylsulfonyl fluoride with the inclusion of protease inhibitors (pepstatin, aprotinin, and leupeptin) at a concentration of 1 μ g/ml. Additionally, the phosphatase inhibitors NaF (5 mM) and Na3VO4 (1 mM) were included. The cell suspension was incubated on ice for 15 min. 12.5 μ l of 10% Nonidet P-40 was added, and the mixture was vigorously vortexed for 15 s. The cytoplasmic and nuclear fractions were separated by centrifugation at 17,000 × g for 30 s at 4 °C. The nuclear pellet was subsequently resuspended in buffer B containing 20 mM HEPES (pH 7.9), 1.5 mM MgCl2, 420 mM NaCl, 0.2 mM EDTA, 35% glycerol, 0.5 mM DTT, 0.2 mM phenylmethylsulfonyl fluoride, and protease inhibitor (pepstatin, aprotinin, and leupeptin) at a concentration of 1 μ g/ml, and incubated on ice for 20 min. Nuclear proteins in the supernatant fraction were collected by centrifugation at 14,000 × g for 2 min at 4 °C and stored at -80 °C until used. Nuclear extracts older than 2 weeks were not used in any of the experiments. Protein concentration was determined by a colorimetric assay using bovine serum albumin as the standard (Bio-Rad).
Electrophoretic Mobility Shift Assay (EMSA)
The consensus double-stranded oligonucleotides of the NF-κB sequence (5′-GAGACTGGGGAATACCCCAGT-3′) were purchased from Promega. The oligonucleo-tides were radioactively labeled with [γ-32P]ATP and T4 polynucleotide kinase (New England Biolabs, Beverly, MA). The probes were purified on 20% native polyacrylamide gels. Double-stranded DNA probes were eluted overnight at 37 °C in 600 μ l of TE buffer (pH 7.4) containing 10 mM Tris-HCl and 1 mM EDTA. The activity of a radiolabeled probe was counted and stored at -80 °C. Probes were used within 2 weeks after preparation.
In each reaction, 5 μ g of nuclear protein or 0.25 μ g of affinity purified proteins and 6 μ l of 5x binding buffer containing 20% (v/v) glycerol, 5 mM MgCl2, 2.5 mM EDTA, 5 mM DTT, 50 mM Tris-HCl (pH 7.5), 0.25 mg/ml poly(dI-dC), and 50,000 counts/min of radiolabeled probe were used. Samples were incubated at room temperature for 20 min. Super-shift experiments to determine the components of the complex bound to the NF-κB consensus element following treatment were performed by adding 2 μ g of the primary antibody (p50, p65, and c-Rel) to the binding reaction and extending the incubation to 1 h at room temperature. The reaction was stopped by the addition of 3 μ l of 10x DNA loading buffer (25 mM Tris-HCl, pH 7.5, 0.02% bromphenol blue, and 4% (v/v) glycerol). DNA-protein complexes were separated from unbound probes on 6% polyacrylamide native gel. Gels were dried and exposed to Kodak film at -80 °C for 6–12 h.
Protein Purification by Affinity Chromatography
The consensus NF-κB oligonucleotide was synthesized and labeled with biotin at the 5′ end of the oligonucleotide (Invitrogen). The NF-κB binding sequence is 5′-GAGACTGGGGAATACCCCAGT-3′, in which biotin is cross-linked at the 5′ end of the primer. The complementary sequence, 5′-ACTGGGGTATTCCCCAGTCTC-3′, was synthesized and annealed with the biotin-labeled NF-κB oligomer in 10 mM HEPES (pH 7.8), 10 mM MgCl2, and 0.1 mM EDTA by heating at 65 °C for 5 min followed by cooling to room temperature. Double-stranded DNA formation was verified by 1.5% agarose gel electrophoresis, and only 95–100% annealed DNA was used to pull down NF-κB binding proteins.
Extracts of nuclei treated with the PMA and cytokine (TNF-α and IL-1β) combination were suspended in binding buffer (12% glycerol, 60 mM KCl, 12 mM HEPES, pH 7.8, 0.12 mM EDTA, 5 mM MgCl2, 5 mM DTT, and 0.1% Triton X-100), and proteins were purified as described by Hagenbuchle et al. (43). Briefly, biotin-labeled double-stranded NF-κB oligonucleotide was added directly to the nuclear suspension in the presence of poly(dI-dC) to a final concentration of 0.25 mg/ml. Binding reactions were performed at 4 °C overnight with continuous gentle rotation in the presence of protease inhibitor (pepstatin, leupeptin, and aprotinin) at 1 μ g/ml concentration. The reaction mixture was centrifuged at 3,000 rpm for 5 min to remove debris that may have clogged the affinity column. The affinity column was prepared using high-performance streptavidin-agarose beads (Amersham Biosciences). Briefly, a small column was packed with 500 μ l of streptavidin-agaroseconjugated beads and washed five times with 1x binding buffer at 4 °C. The mixture of DNA-protein complex was passed through the column five times at a flow rate of 20 ml/h. The column was washed with binding buffer to remove nonspecific attachment of proteins. Additionally, the column was washed 5 times with 2-column volumes each of 1x binding buffer containing 60 mM KCl. Before elution, the column was further washed with binding buffer containing 150 mM KCl. NF-κB sequence-specific binding proteins or NF-κB interacting proteins were eluted with 450 mM KCl in 1x binding buffer. Purified proteins were then subjected to 10% SDS-polyacrylamide gel electrophoresis and visualized by silver staining.
Silver Staining
Purified proteins were separated by SDS-polyacryl-amide gel electrophoresis. Gels were preincubated in the fixing solution (50% methanol, 5% acetic acid) for 30 min with gentle shaking and then washed 2 h in distilled water with gentle shaking. Gels were sensitized with 0.02% Na2S2O3 solution for 1 min and washed 2 times with distilled water. Gels were incubated in 0.1% AgNO3 for 20 min, washed 2 times with distilled water, and then proteins were visualized by incubating the gel in 2% Na2CO3 and 0.04% formaldehyde solution.
In-gel Digestion
Protein bands were excised from the silver-stained gel and washed with 100 mM NH4HCO3 dehydrated with acetonitrile and rehydrated with 100 mM NH4HCO3. This cycle was repeated three times. The gel slices were reduced with 10 mM DTT, 100 mM NH4HCO3 at 56 °C for 60 min. Samples were S-alkylated with 20 mM iodoacet-amide at 25 °C in the dark for 30 min and vacuum dried. In-gel digestion of excised bands with trypsin (sequencing grade, Promega) and extraction of peptides were done according to Shevchenko et al. (44). Extracted peptide solutions were dried, rehydrated in 10 μ l of 0.1% aqueous formic acid, and stored at -20 °C until analyzed.
Mass Spectrometry
All mass spectra reported in this study were acquired by the University of Kentucky Mass Spectrometry Facility. LC/MS/MS spectra were acquired on a Finnigan LCQ “Classic” quadrupole ion trap mass spectrometer (Finnigan Co., San Jose, CA). Separations were performed with HP 1100 high performance liquid chromatography modified with a custom splitter to deliver 4 μ l/min to a custom C18 capillary column (300 μ m inner diameter × 15 cm), packed in-house with Macrophere 300 5-μ m C18 (Alltech Associates, Deerfield, IL). Gradient separations consisted of a 2-min isocratic step at 95% water and 5% acetonitrile (both phases contain 0.1% formic acid). The organic phase was increased to 20% acetonitrile over 8 min and then increased to 90% acetonitrile over 25 min; held at 90% acetonitrile for 8 min and then increased to 95% in 2 min; finally they were returned to the initial conditions in 10 min (total acquisition time 45 min with a 10 min recycle time). Tandem mass spectra were acquired in a data-dependent manner. Three microscans were averaged to generate the data-dependent full-scan spectrum. The most intense ion was subjected to tandem mass spectrometry, and three microscans were averaged to produce the MS/MS spectrum. Masses subjected to the MS/MS scan were placed on an exclusion list for 2 min.
Data Base Analysis of Peptides
Tandem spectra used for protein identification from tryptic fragments were searched against the NCBI nonredundant protein data base using an in-house copy of the MASCOT search engine. For MS/MS spectra, the peptides were also assumed to be monoisotopic, oxidized at methionine residues, and carbamidomethylated at cysteine residues with a 0.8 Da mass tolerance.
Probability-based MOWSE scores were estimated by comparing search results against the estimated random match population and were reported as -10 · Log10(P), where P is the absolute probability. All reported proteins showed very significant scores, typically much greater than 50 (p < 0.05).
Western Analysis
Nuclear extracts (50 μ g) from either control or treated cells were used to analyze the level of various NF-κB transcription factors or related proteins. For partially purified proteins, 2.5 μ g were analyzed by Western blotting. Samples were subjected to 10% SDS-polyacrylamide gel electrophoresis and transferred to a nitrocellulose membrane. Transfer efficiency was assessed by incubation with 0.1% Ponceau solution. The membrane was washed with distilled water until the dye disappeared completely. The membranes were then blocked by 5% nonfat dried milk in TBS-T (10 mM Tris-HCl, pH 7.8, 150 mM NaCl, and 0.05% (v/v) Tween 20) buffer (pH 7.8) for at least 1 h at room temperature. After a short wash with TBS-T buffer, the membranes were incubated in the primary antibody for at least 2 h at room temperature or overnight at 4 °C. The primary antibody was diluted in TBS-T buffer containing 5% nonfat dried milk at a dilution range of 500 to 3,000. The membranes were washed three times each for 10 min with TBS-T. Then the membranes were incubated with the secondary antibody at a dilution range of 2,000 to 5,000 for 1 or 2 h. The membranes were then washed two times with TBS-T for 10 min and one time with PBS for 5 min. Protein bands were detected using the enhanced chemiluminescence detection system (ECL®, Amersham Biosciences). Densitometric analysis was performed by using the Quantity One® Image analyzer software program (Bio-Rad).
Immunoprecipitation
Immunoprecipitation studies were carried out with nuclear extracts from HepG2 cells (either untreated or treated with a combination of PMA and cytokine) in RIPA buffer (9.1 mM Na2HPO4, 1.7 mM NaH2PO4, 150 mM NaCl, pH 7.4, 1% (v/v) Nonidet P-40, 0.5% sodium deoxycholate, 0.1% SDS, 10 μg/ml phenylmethylsulfonyl fluoride, 1 μg/ml aprotinin). The antibodies used for immunoprecipitation were rabbit anti-p50 and anti-p65 and goat anti-NPM (B23). One mg of nuclear extracts was incubated at 4 °C overnight with 2 μg of corresponding antibodies. After a 2-h incubation with the antibody, 20 μl of protein A/G (Santa Cruz Biotechnology, Santa Cruz, CA) was added to the reaction mixture of the antibody and nuclear extract, and rotated overnight at 4 °C. Immunoprecipitates were collected by centrifuging at 2,500 rpm for 5 min followed by washing four times with RIPA buffers. Following the final wash, all the liquids that adhered to the protein A/G beads were removed. Samples were then resuspended in the sample loading buffer, subjected to SDS-polyacrylamide gel electrophoresis (10% gel (w/v)), transferred onto nitrocellulose membrane, and the immunoprecipitated proteins were then detected by Western blotting.
RNA Isolation, cDNA Synthesis, and RT-PCR
Total RNA was isolated from HepG2 cells by a single step guanidinium thiocyanate/ phenol-chloroform extraction using TRIzol reagent (Invitrogen) according to the manufacturer’s protocol. Briefly, subconfluent HepG2 cells were washed with ice-cold 1x PBS and harvested by scraping and centrifugation. The cells were resuspended in 1 ml of TRIzol reagent and incubated at room temperature for 15 min. Chloroform (0.2 ml) was added to the sample, vortexed vigorously, and then incubated at room temperature for 10 min. The RNA containing aqueous phase was extracted after centrifugation at 12,000 × g for 15 min at 4 °C. The RNA was precipitated with isopropyl alcohol, and the pellet was washed with 70% ethanol in diethyl pyrocarbonate-treated water. The RNA pellet was air dried, RNA concentration was measured, aliquoted, and stored at -80 °C until used. RNA samples having an A260/A280 ratio of more than 17.5 were used for RT-PCR.
For reverse transcription, cDNA was generated using 2 μg of total RNA, oligo(dT) primer, and Moloney murine leukemia virus reverse transcriptase according to the manufacturer’s instructions (RT-for-PCR kit, Clontech Laboratories) in a total volume of 20 μl. After the RT reaction, cDNA was diluted to 100 μl with diethyl pyrocarbonate-treated water. Two microliters of first-strand cDNA were amplified using the following PCR primer sets: NPM sense, 5′-TCACGGTTGTGAACTAAAGGCCGA-3′ and antisense, 5′-TCTTTACCTTCGAATGGGTGACCT-3′; hMnSOD sense, 5′-AGGTTGTTCACGTAGGCCGC-3′ and antisense, 5′-AGCATGTTGAGCCGGGCAAGT-3′; IL-8 sense, 5′-AGGAGAGCACACAAGCTTCAG-3′ and antisense, 5′-GGCATCTTCACTGATTCTTGG-3′; β-actin sense, 5′-TGTTACCAACTGGGACGACA-3′ and antisense, 5′-CTGGGTCATCTTTTCACGGT-3′. For each PCR reaction, 2 μl of diluted cDNA were amplified using specific primers (50 pmol) in a final volume of 50 μl. For hMnSOD, PCR was performed for 30 cycles at 94 (30 s), 65 (15 s), and 72 °C (20 s) followed by a final 72 °C step (7 min). For NPM, PCR was performed for 30 cycles at 94 (30 s), 60 (30 s), and 72 °C (45 s), and a final 72 °C step (7 min). For IL-8, PCR was performed for 30 cycles at 94 (1 min), 60 (1 min), and 72 °C (2 min), and a final 72 °C step (7 min). For β-actin, PCR was performed for 30 cycles at 94 (30 s), 60 (30 s), and 72 °C (40 s), and a final 72 °C step (7 min). PCR products were separated on a 1% agarose gel and visualized by ethidium bromide staining.
Northern Blotting
For RNA analysis by Northern blotting, 30 μg of total RNA were separated on 1.1% formaldehyde-agarose gel (1.1% agarose and 4.6% formaldehyde in 1x MOPS/sodium acetate running buffer (pH 7.0)), transferred onto a nylon membrane, and hybridized with 32P-labeled hMnSOD cDNA, IL-8 cDNA, and β-actin c-DNA.
Statistical Analysis
Data were analyzed using a two-way analysis of variance procedure for comparison. Bonferroni’s post-test multiple comparisons procedure was used to determine the statistical significance. Data were shown as mean ± S.D. of at least three experiments.
RESULTS
Combination Treatment of PMA and Cytokines Enhances MnSOD Transcription
We have previously shown that treatment with PMA and cytokines synergistically enhances Mn-SOD gene transcription in VA-13 cells (41). To further verify that the intronic enhancer element of the MnSOD gene (I2E) under the control of its promoter will respond to PMA and cytokines in the same manner, we transiently transfected Mn-SOD promoter-driven I2E enhancer vector (-555 to +24/I2E/ pGL3) into HepG2 cells and measured the reporter gene activity. Fig. 1A shows the induction of the MnSOD gene transcription after treatment with PMA (100 nM), TNF-α (200 IU/ml), IL-1β (2 ng/ml), or a combination of all three agents. Consistent with our previous findings, we found that simultaneous treatment of cells with PMA and cytokines (all 3) synergistically increases the reporter gene activity.
Fig. 1. Induction of MnSOD gene transcription after treatment of PMA and cytokines.

A, subconfluent HepG2 cells were transiently transfected with MnSOD promoter- and enhancer-driven pGL3 reporter vectors along with Renilla (pRL-TK) luciferase vector as an internal control. Eight hours after transfections, cells were washed with 1x PBS and incubated at 37 °C for 24 h. At 12 h after treatment of PMA and cytokines, cell lysates were collected. Reporter activity was determined as a measure of MnSOD gene transcription by relative chemiluminescent light units. B, nuclear extracts were collected from HepG2 cells and the levels of p50, p65, CEBP/β, and c-Rel in HepG2 cells after treatment of PMA or cytokines or in combination for 4 h was determined by Western blotting analysis. Equal amounts of nuclear extracts (50 μg) were subjected to 10% SDS-polyacrylamide gel electrophoresis, and Western analysis was performed using antibodies specific to p50, p65, CEBP/β, and c-Rel. The same membrane was re-probed with a β-actin antibody used as the loading control. C, NF-κB DNA binding reactions were carried out as described under “Experimental Procedures.” For supershift experiments nuclear extracts were preincubated with 1 μg of an antibody specific to p50, p65, and c-Rel prior to the binding reaction. DNA binding complexes and supershift complexes are indicated by the arrows. Each data point represents the mean of three independent experiments mean ± S.D. Significant difference from control: *, p < 0.05, and **, p < 0.01.
To verify that the increased level of SOD2 gene transcription is associated with an increase in NF-κB and C/EBP levels, both control and treated nuclear extracts were subjected to 10% SDS-polyacrylamide gel electrophoresis and Western blotting using antibodies specific to p50, p65, c-Rel, C/EBP-β, and β-actin. The results in Fig. 1B show enhanced accumulation of these transcription factors in the nucleus after treatment with PMA or cytokines or in combination. Accumulation of p65 and C/EBP-β after both individual and combined treatments is similar, whereas combination treatment strongly increases p50 and c-Rel levels. To determine whether the increase in NF-κB levels is accompanied by an increase in DNA binding activity, we examined the NF-κB DNA binding activity using EMSA. PMA and cytokine-treated nuclear extracts from HepG2 cells show the activation of DNA binding complexes with NF-κB (Fig. 1C). The increase of DNA binding activity of NF-κB was observed within 4 h in all the treatments. The increase in NF-κB binding activity upon treatment with PMA was slightly less than that with either cytokine alone. The combined PMA and cytokine treatment led to increased DNA binding activity of NF-κB, suggesting an increased binding of the NF-κB·Rel complex. Whereas antibodies specific to p50 or p65 can almost completely supershift the p50-p65 and p50-p65 complexes, antibodies specific to c-Rel had a minor affect on p50-p50 and p50-p65 complexes.
Purification of NF-κB DNA-binding Proteins
The effects of PMA and cytokines on MnSOD gene expression in HepG2 cells were similar to those of VA-13 cells. As our studies of VA-13 cells clearly demonstrated that NF-κB is essential but not sufficient for a high-level induction of the SOD2 gene, we therefore began a systematic attempt to identify potential partners of NF-κB for the induction of the MnSOD gene by PMA and cytokines using an NF-κB affinity column. The results in Fig. 2A show the electrophoresis pattern of the NF-κB consensus, DNA-binding protein. To maximize the chance of purifying NF-κB proteins, we treated HepG2 cells with the PMA and cytokine combination to induce NF-κB activity. Proteins eluted with 450 mM KCl, which represent less than 1% of total nuclear proteins, were loaded onto the column. The affinity pure proteins were subjected to a 10% SDS-polyacrylamide gel, and protein bands were visualized by silver staining. The major components of the eluted fraction were 36-, 68-, and 80-kDa proteins. In addition, a few faint protein bands were observed between 37 and 50 kDa, one of which is presumed to be p50. The 36-kDa protein band is several times more intense than the 50-kDa protein band.
Fig. 2. Affinity purified DNA-binding proteins.

A, purification of NF-κB DNA-binding proteins by NF-κB oligonucleotide DNA affinity chromatography. Various fractions obtained from the NF-κB affinity column were subjected to 10% SDS-polyacrylamide gel electrophoresis and thereafter visualized by silver staining. Lane 1 represents the crude nuclear extract; lanes 2 and 3 represent the first flow-through and first wash flow-through with 800 mM KCl containing binding buffer, respectively. Lanes 4–8 represent the wash flow-through with 1x binding buffer. Lane 9 is 150 mM KCl in 1x binding buffer wash flow-through, and lane 10 is 450 mM KCl in 1x binding buffer elute. B, EMSA of affinity purified NF-κB DNA-binding protein complexes. For the supershift assay, anti-p50 or anti-p65 antibodies of 1 μg were preincubated with the EMSA reaction mixture, and the reaction was performed as described under “Experimental Procedures.” DNA binding complexes and supershift complexes are indicated by the arrow. C, Western blot analysis of affinity purified DNA-binding proteins. 450 mM KCl, eluted from an affinity column that contained purified protein complexes, was subjected to 10% SDS-polyacrylamide gel, transferred onto nitrocellulose membrane, and then probed with either p50 or p65 antibody.
After purifying the protein fraction we investigated the DNA binding activity. Purified protein fractions showed intense DNA binding activity when probed with γ-32P-labeled NF-κB oligonucleotide as determined by EMSA. Purified protein complexes showed NF-κB activity, which can be supershifted by both p50 and p65 antibodies (Fig. 2B). This suggests that the eluted fraction was composed of specific NF-κB-binding protein complexes. In the same eluted fraction, the p50 and p65 proteins were both identified by Western blot analysis (Fig. 2C).
Identification of NF-κB Interacting Proteins
To identify NF-κB DNA-binding proteins, we excised the bands from the SDS-PAGE gel (see Fig. 2A), digested these with trypsin, and analyzed them with mass spectrometry. Matrix-assisted laser desorption ionization analysis of the excised gel spots was inconclusive, probably because of the low abundance of the NF-κB-binding proteins. Subsequent LC/MS/MS analysis produced significant identifications. Band 1 produced 14 non-redundant peptides; band 2 produced 10 non-redundant peptides; and band 3 produced 16 non-redundant peptides (Table I). MASCOT search of the NCBI data base revealed that the peptides derived from band 1 (36 kDa protein) corresponded to a multifunctional nucleolar phosphoprotein NPM (Fig. 3A) whose molecular chaperone activities are thought to play a role in ribosome assembly (37). Similarly, MASCOT searches of the peptides derived from band 2 (68-kDa protein) matched with ku-autoantigen (Fig. 3B), and peptides from band 3 (80 kDa protein) matched with nucleolin (Fig. 3C). In each of these cases, ∼17–43% of the protein sequence was covered by the peptides obtained from LC/MS/MS.
TABLE I. Sequences of trypsin-produced peptides from NF-κB oligonucleotide pull down affinity purified proteins identified by MS/MS.
| Antigen and band 3 is identified as 102-kDa nucleolin. |
|---|
| Peptides from band 1 (36-kDa protein) |
| LLSISGK |
| FINYVK |
| LLSISGKR |
| GGSLPKVEAK |
| GPSSVEDIKAK |
| VEAKFINYVK |
| MQASIEKGGSLPK |
| FINYVKNCFR |
| MQASIEKGGSLPK |
| VDNDENEHQLSLR |
| MTDQEAIQDLWQWR |
| MTDQEAIQDLWQWRK |
| MSVQPTVSLGGFEITPPVVLR |
| TVSLGAGAKDELHIVEAEAMNYEGSPIK |
| Peptides from band 2 (68-kDa protein) |
| FTYR |
| MPFTEK |
| SQIYGSR |
| KMPFTEK |
| IMATPEQVGK |
| ILELDQFKGQQGQK |
| VEYSEEELKTHISK |
| TFNTSTGGLLLPSDTKR |
| ELVYPPDYNPEGKVTK |
| IMLFTNEDNPHGNDSAK |
| Peptides from band 3 (80-kDa protein) |
| TLFVK |
| VAVATPAK |
| ALVATPGK |
| KAAATPAK |
| ALELTGLK |
| ALVATPGKK |
| TGISDVFAK |
| SQPSKTLFVK |
| AIRLELQGPR |
| SISLYYTGEK |
| EVFEDAAEIR |
| ATFIKVPQNQNGK |
| TFEEKQGTEIDGR |
| GLSEDTTEETLKESFDGSVR |
| VEGTEPTTAFNLFVGNLNFNK |
| TLVLSNLSYSATEETLQEVFEK |
Fig. 3. MOWSE scores from MASCOT data base searches.

A, results from band 1 identifying nucleophosmin. B, results from band 2 identifying ku antigen. C, results from band 3 identifying nucleolin.
NPM Forms Complex with NF-κB
Of the three proteins identified by NF-κB affinity chromatography and mass spec-trometry, the most abundant protein was NPM. The interaction of NPM and NF-κB was further investigated by co-immunoprecipitation studies. Using antibodies against p50 and p65, we were able to immunoprecipitate NPM. In addition, using the NPM antibody we successfully immunoprecipitated p65 from the combination of PMA- and cytokine-treated nuclear extracts. Antibodies to IgG alone were unable to immunoprecipitate NPM (Fig. 4). These results indicate that p50, p65, and NPM interact with each other in vivo and the interaction increases after PMA and cytokine treatment.
Fig. 4. Interaction of NF-αB proteins and NPM.
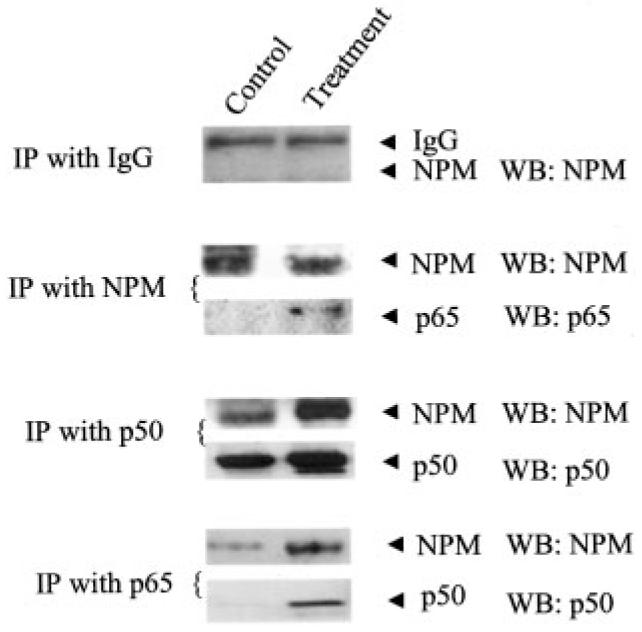
In vivo binding of p50 with NPM, p65 with NPM, and NPM with p65 was confirmed by co-immunoprecipitation analysis. Combination treatment of PMA and cytokines in HepG2 cells was observed to enhance the binding of NPM with p50 and p65.
NPM Enhances Transcription of the MnSOD Gene
To investigate whether NPM plays any role in MnSOD gene transcription, overexpression of NPM was achieved using the pcDNA3.1/NPM vector expressing NPM. HepG2 cells were cotransfected with a MnSOD promoter/enhancer construct and a NPM expression vector construct. Overexpression of NPM led to a dose-dependent increase of NPM protein, whereas transfection with the corresponding empty vector (pcDNA/3.1) did not show any presence of vector-derived NPM (Fig. 5A). Consistent with the expression results, overexpression of NPM led to a dose-dependent increase of luciferase activity, whereas transfection with the corresponding empty vector had no effect on reporter gene activity (Fig. 5B). The activities of MnSOD reporter gene transcription are completely blocked when the NF-κB binding sites of the MnSOD enhancer region are mutated (Fig. 5C).
Fig. 5. NPM overexpression enhances MnSOD gene transcription.
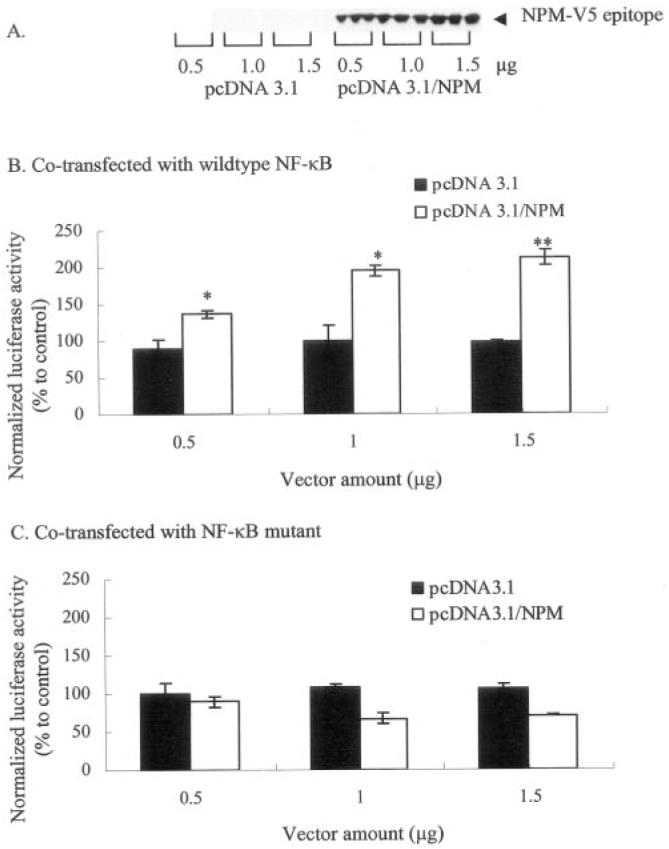
HepG2 cells were co-transfected with either NPM expression vector (pcDNA3.1/NPM) or empty vector (pcDNA3.1) along with Mn-SOD promoter- and enhancer-driven luciferase reporter vector. Parallel transfection experiments were performed using MnSOD promoter- and enhancer-driven luciferase reporter vectors, where the NF-κB binding site in the enhancer region is mutated. After 12 h of co-transfection, cells were washed and grown for 24 h, and then cell lysates were collected. A, equal amounts of cellular proteins were subjected to 10% SDS-polyacrylamide gel electrophoresis, transferred onto nitrocellulose membrane, and then Western blot analyses were conducted with an NPM-V5-epitope antibody. B and C, luciferase activity of cell lysates was measured as a determinant of MnSOD gene transcription. Each data point represents the mean of three independent experiments ± S.D. Significantly different from corresponding empty vector transfected control; **, p < 0.01. IP, immunoprecipitation; WB, Western blot.
Effects of NPM on the Endogenous Human MnSOD mRNA
To verify the role of NPM on hMnSOD gene transcription, we overexpressed the NPM expression vector in HepG2 cells and measured the hMnSOD mRNA level. As shown in Fig. 6, NPM overexpression leads to a significant increase of the hMnSOD mRNA level. Both the 4- and 1-kb MnSOD transcripts increase after NPM overexpression. In contrast to the MnSOD gene, the mRNA of another NF-κB target gene, IL-8, remains unchanged with the overexpression of NPM, indicating that NPM-induced transcription is selective for MnSOD, at least in this particular system.
Fig. 6. NPM overexpression enhances MnSOD mRNA expression.
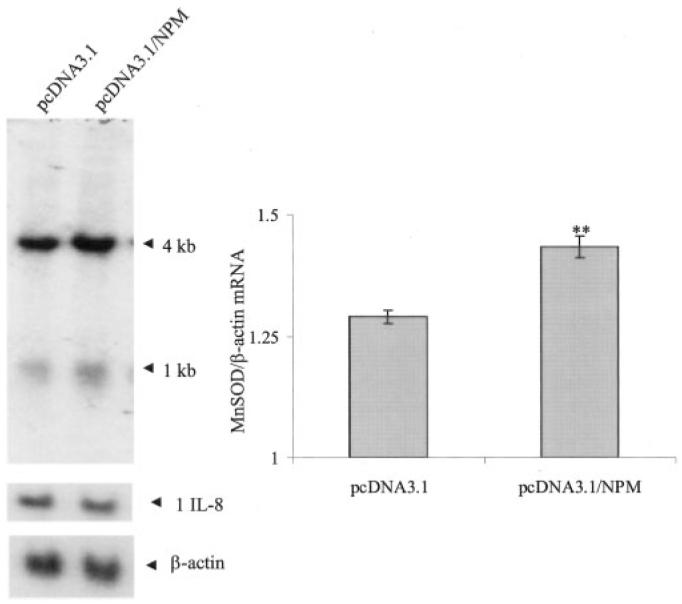
HepG2 cells were transfected with 0.5 μg of NPM expression vector (pcDNA3.1/NPM) or empty vector (pcDNA3.1) for 24 h. Cells were then washed with 1x PBS, and total RNA was isolated by the TRIzol method. Thirty μg of RNA was subjected to 1.1% agarose gel electrophoresis and transferred onto nylon membrane. Northern analysis of RNA isolated from control and overexpressing cells were performed using a human MnSOD cDNA probe. The 1- and 4-kb human MnSOD transcripts are indicated by arrows. The same membrane was stripped and re-probed with a human IL-8 cDNA probe (middle arrow) and a β-actin cDNA probe (bottom arrow). The 4-kb MnSOD transcript bands were densitometrically scanned and normalized with β-actin. Statistical analyses were performed using three sets of experiments. Each column represents the mean of three samples ± S.D. **, p < 0.01 as compared with empty vector-transfected control.
Antisense NPM Reduces MnSOD Gene Transcription
To further investigate the potential role of NPM, HepG2 cells were transiently co-transfected with antisense NPM vector (pCMV/ ASNPM) and MnSOD promoter-driven I2E/pGL3 vector, followed by treatment with the PMA and cytokine combination for 12 h. Antisense NPM expression in HepG2 cells leads to a significant reduction of reporter gene activity after PMA and cytokine treatment (Fig. 7). Expression of antisense NPM does not significantly affect the constitutive levels of the reporter gene. Combination treatment leads to increased MnSOD gene transcription in both the empty vector and antisense NPM expression vector-transfected cells. But the induction in anti-sense NPM transfected cells after treatment is significantly reduced as compared with their corresponding empty vector-transfected cells. These results demonstrate that NPM plays an important role in MnSOD gene transcription.
Fig. 7. Antisense NPM overexpression suppresses MnSOD gene induction.
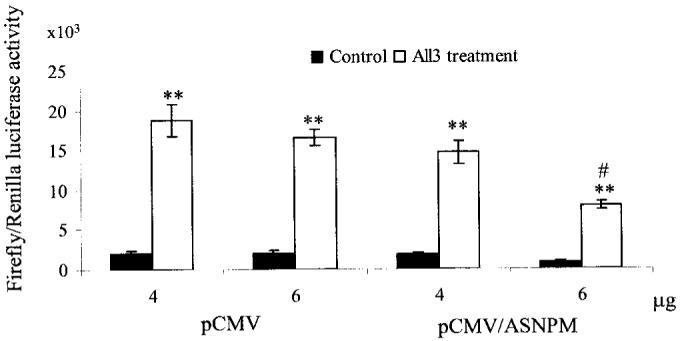
HepG2 cells were transfected with antisense NPM (pCMV/ASNPM) or empty vector (pCMV) along with MnSOD promoter-and enhancer-driven luciferase reporter vectors. After 12 h of co-transfection, cells were washed, grown for 24 h, and then treated with PMA and cytokines for 12 h, after which cells were again washed. Cell lysates were collected, and the luciferase activity was measured as a determinant of MnSOD gene transcription. Each data point represents the mean of three independent experiments ± S.D. Significant difference from corresponding control: **, p < 0.01. Significant difference from corresponding treatment group: #, p < 0.01.
Antisense NPM Suppresses Endogenous MnSOD Level
To verify the role of NPM in MnSOD induction, HepG2 cells were transfected with antisense NPM expression vector (pCMV/ASNPM) or empty vector (pCMV), and the MnSOD protein levels were monitored. Whole cell lysates were collected at 12 h after treatment with the PMA and cytokine combination and subjected to Western blotting to determine the level of endogenous NPM, MnSOD, and GAPDH, where GAPDH was used as the loading control. Triplicate data sets were quantified and statistical analyses were performed; the results are shown in Fig. 8. The results show a dose-dependent decrease of endogenous NPM after antisense NPM expression in HepG2 cells. Treatment with the PMA and cytokine combination does not significantly alter the NPM level in either empty vector or antisense NPM expression vector-transfected cells (Fig. 8A). Treatment of empty vector or antisense NPM expression vector-transfected cells with the above agents significantly increases the MnSOD level. However, the total induced level of MnSOD protein is significantly lower in antisense NPM expression vector-transfected cells compared with the corresponding empty vector-transfected cells (Fig. 8B).
Fig. 8. Antisense NPM suppresses endogenous MnSOD.
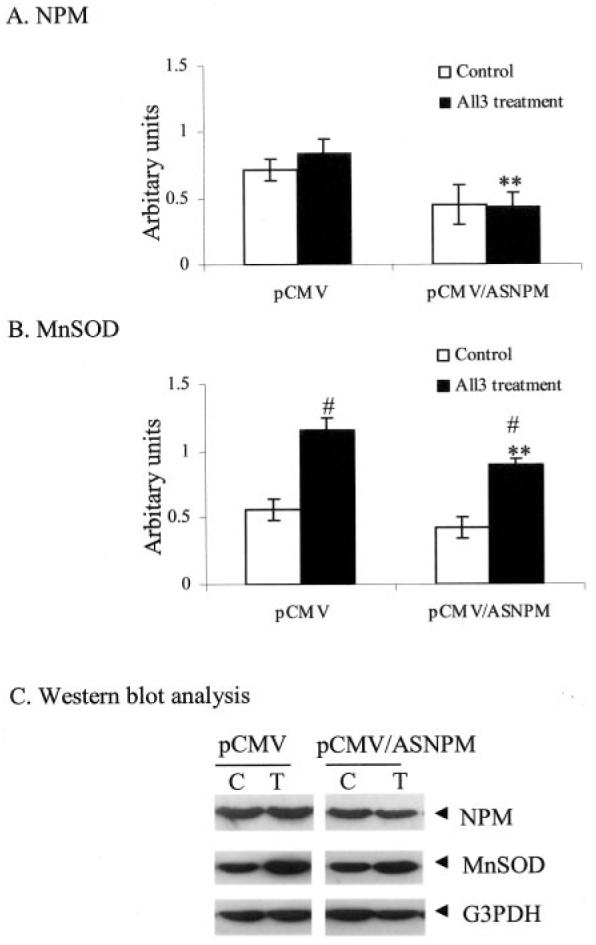
HepG2 cells were transfected with antisense NPM vector or empty vector for 12 h. Cells were washed, grown for 24 h, and then treated with PMA and cytokines for 12 h. Cells were washed, and total cell lysates were collected. Equal amounts of proteins (50 μg) were subjected to 12.5% SDS-polyacrylamide gel electrophoresis, transferred onto nitrocellulose membrane, and then probed with MnSOD antibody. The same membranes were then stripped and re-probed with NPM (B23) antibody or GAPDH antibody, with GAPDH used as the loading control. Quantification of immunoband intensities was determined by densitometric scanning. The band intensity values of NPM and MnSOD were normalized with respect to the band intensity values of GAPDH (G3PDH). The normalized protein levels of NPM and MnSOD are shown in A and B, respectively. A representative Western blot is shown in C. Statistical analyses were performed using three sets of independent experiments. **, p < 0.01 compared with corresponding treatment; #, p < 0.01 compared with corresponding control.
NPM SiRNA Inhibit hMnSOD Reporter Gene Activity, mRNA and Protein
To verify the role of NPM in the expression of MnSOD, HepG2 cells were transfected with the control or siRNA (Table II). Suppression of endogenous NPM by NPM siRNA overexpression had a pronounced effect on MnSOD gene transcription as measured by MnSOD reporter gene activity, endogenous mRNA, and protein levels. TNF-α treatment induces the reporter gene transcription several folds in control RNA-transfected cells. SiRNA expression in HepG2 cells significantly suppresses TNF-α-induced MnSOD reporter gene transcription (Fig. 9A). Consistent with these findings, TNF-α treatment induces the hMnSOD mRNA level, and siRNA inhibits TNF-α-induced hMnSOD mRNA expression as compared with control RNA-transfected cells treated with TNF-α (Fig. 9B). Similarly, siRNA expression reduces endogenous NPM and MnSOD protein levels (Fig. 9C).
TABLE II. siRNA sequences used for silencing endogenous NPM expression.
| A, control RNA |
| Forward: 5′-GATCCAATGAGCACCAGTTATCTTTTCAAGAGATTTTTTGCTAGCG-3′ |
| Reverse: 5′-AATTCGCTAGCAAAAAATCTCTTGAAAAGATAACTGGTGCTCATTG-3′ |
| B, siRNA |
| Forward: 5′-GATCCAATGAGCACCAGTTATCTTTTCAAGAGAAAGATAACTGGTGCTCATTTTTTTTGCTAGCG-3′ |
| Reverse: 5′-AATTCGCTAGCAAAAAAAATGAGCACCAGTTATCTTTCTCTTGAAAAGATAACTGGTGCTCATTG-3′ |
Fig. 9. NPM siRNA inhibits MnSOD gene expression.

HepG2 cells were transfected with control RNA or siRNA (double-stranded siRNA in Ready pSIREN-Shuttle vector) along with MnSOD promoter-and enhancer-driven luciferase reporter vectors for 24 h. Cells were then washed with 1x PBS and incubated in medium at 37 °C. After 12 h of co-transfection, cells were treated with TNF-α (200 units/ml) for 12 h, and then cell lysates were collected and luciferase activity was measured. A, control RNA or NPM siRNA transfected into HepG2 cells was used to isolate total RNA or total cell lysates. B, RT-PCR of RNA isolated from control and TNF-α (200 units/ml for 12 h) -treated cells was carried out using primers for each specific gene as described under “Experimental Procedures.” C, proteins from total cellular extracts were analyzed by 10% SDS-PAGE, transferred onto nitrocellulose membrane, and probed with MnSOD antibody. The same membrane was re-probed with NPM antibody (B23) or β-actin antibody. Statistical analyses were performed in three independent experiments. **, p < 0.01 compared with the corresponding control; #, p < 0.01 compared with the corresponding treatment.
Effect of NPM on NF-κB-dependent Transcription Is Selective for MnSOD
To determine whether there is any selectivity of NPM on NF-κB target genes, we overexpressed NPM siRNA in HepG2 cells and examined the mRNA levels of two distinct NF-κB target genes by RT-PCR. The data indicate that NPM siRNA reduces the NPM mRNA level. TNF-α induces the mRNA level of MnSOD both in control RNA and siRNA-transfected cells, but the constitutive and TNF-α-induced mRNA levels are reduced in siRNA-transfected cells. SiRNA to NPM had a greater effect on the expression of the MnSOD gene than on the TNF-α-induced expression (Fig. 10B). We did not observe any change in the IL-8 mRNA level after TNF-α treatment for 12 h in HepG2 cells. Importantly, in HepG2 cells, the mRNA levels of IL-8 remain unchanged in siRNA overexpressing cells, suggesting that the effect of NPM on MnSOD gene transcription is selective.
Fig. 10. The role of NPM on mRNA levels of NF-αB-targeted genes.

A, schematics of transcription factor binding sites in the human MnSOD and IL-8 gene promoters. Corresponding transcription factor binding sites for key transcription factors in the 5′-flanking and enhancer regions are indicated by vertical lines. In the promoter region of the IL-8 gene, typical TATA and CAAT signal sequences are highlighted. B, RT-PCR products of RNA isolated from NPM siRNA transfected control and treated cells as described in the legend to Fig. 9.
DISCUSSION
Exposure of cells to PMA and cytokines leads to the accumulation of toxic reactive oxygen species and causes the induction of MnSOD (3-5). Studies have demonstrated that NF-κB is involved in the induction of many genes that are responsive to phorbol ester (12-O-tetradecanoylphorbol-13-acetate), TNF-α, IL-1β, and lipopolysaccharide. The activation of NF-κB by these stimuli is a consequence of proteolytic degradation of IκB resulting in the release of NF-κB from its inhibitory complex, followed by nuclear accumulation to the transcription site (45). Modulation of NF-κB function also modulates MnSOD induction, suggesting that NF-κB is intimately involved in the regulation of MnSOD (46, 47).
The NF-κB site in the intronic region of the MnSOD gene plays a vital role in the induction of MnSOD after TNF-α and IL-1β treatments. The NF-κB sites in the 5′- and 3′-flanking regions of MnSOD are not responsive to cytokine treatment unless they are placed in an intronic position (31). Our previous study reveals that intronic NF-κB is essential for both individual and combined PMA and cytokine treatments. However, combination treatment synergistically induces the MnSOD gene. Our previous studies in human lung fibroblast cells (WI-38, VA-13) show that the synergistic induction of MnSOD after the combined PMA and cytokine treatment results from a sequence of events that includes a sequential degradation of IκB-α and IκB-β by cytokines. We also demonstrate that activation of CEBP/β in addition to NF-κB is a mechanism leading to synergistic induction of MnSOD by PMA and cytokines (41). Our results are also consistent with reports that demonstrate that NF-κB is a potential transcription factor activated simultaneously with other transcription factors, such as C/EBP upon stimulation by cytokines, producing cross-talk between them to maximize gene induction (30, 48). In this present report we confirm the synergistic induction of the SOD2 gene in a hepatocarcinoma cell line, and extend the observation to include p50 and p65, c-Rel, another NF-κB protein of the Rel family, in the synergistic induction process. This result is also consistent with another report, which demonstrates that c-Rel can both induce and inhibit apoptosis via up-regulation of MnSOD (50). Thus the ultimate level of MnSOD upon NF-κB/Rel activation is dependent on various parameters, such as the relative levels of NF-κB/Rel family members and the presence of co-activators.
Our present investigation focuses on the identification and characterization of co-activator proteins involved in NF-κB-mediated MnSOD induction. We used an affinity chromatography approach to co-purify NF-κB interacting proteins and identified them with mass spectrometry. We verified that NF-κB-binding proteins were co-eluted in the 450 mM KCl fraction and the protein complexes contained p50 and p65 proteins as demonstrated by EMSA and Western blotting. The results in Fig. 2 show that, in addition to NF-κB family members, several other proteins are present in the 450 mM KCl fraction. Proteomic analyses demonstrate that the most abundant proteins in this fraction are NPM and nucleolin.
NPM and nucleolin are RNA-binding proteins that participate in ribosome biogenesis. Studies have shown that both are multifunctional proteins involved in several cellular processes such as transcription, attachment of genomic DNA to nuclear matrix, and de-condensation of chromatin (51). It has been demonstrated that NPM and nucleolin, the major RNA-binding proteins, actually bind to the double-stem loop RNA structure. Considering the information obtained from a previous investigation in our laboratory, where we postulated that the GC-rich human MnSOD promoter could form a putative DNA looping structure (52), the presence of NPM and nucleolin is very interesting. The interaction between NPM and NF-κB, initially identified by NF-κB affinity chromatography coupled to proteomic analysis, was verified by co-immunoprecipitation studies. Using antibodies specific to p50 and p65, NPM was immunoprecipitated with NF-κB. The immunoprecipitation results further demonstrate that interaction between NPM and NF-κB is present under unstimulated conditions and is enhanced by treatment with cytokines and 12-O-tetradecanoylphorbol-13-acetate. Our data from co-immunoprecipitation studies also suggest a positive interaction of NPM with p50 and p65. Enhanced interaction of NPM with p50 and p65 after treatment suggests that a larger quantity of NPM is recruited into the nucleus during activation of NF-κB. The positive role of NPM in the induction of MnSOD is also confirmed by transfection studies. Overexpression of the NPM expression vector into HepG2 cells leads to increased MnSOD gene transcription, which further suggests that NPM plays a positive role in Mn-SOD gene induction. The results from transfections of anti-sense NPM expression vectors and interference RNA for NPM into HepG2 cells that show a significant inhibition of MnSOD gene induction after treatment support this possibility.
Our finding that NPM interacts with NF-κB to enhance MnSOD transcription is supported by a report using microarray analysis, which demonstrates that both NPM and MnSOD mRNA are up-regulated in human subjects during labor (40). Our identification of NPM by proteomic analysis and subsequent studies of its role in MnSOD gene induction are consistent with a report that demonstrates that the DNA damaging agent could activate the RNA binding of specific proteins that favor a double-stem loop structure (37). Overexpression of NPM plays a positive role on transcription of the MnSOD gene. However, NPM does not have any effect on MnSOD reporter gene activity when the NF-κB site in the intron was mutated (Fig. 5). Consistent with the positive role of NPM on the NF-κB-mediated MnSOD gene transcription, NPM siRNA overexpression does not alter the transcription of the MnSOD gene when the NF-κB site of the intronic element was mutated (data not shown), suggesting that the increase of MnSOD gene transcription by NPM is selective for MnSOD and is NF-κB dependent. However, we cannot rule out the possibility that NPM may participate in transcription activation of other NF-κB target genes not tested in this study. The results we demonstrate here, indicate that overexpression of NPM and siRNA for NPM does not alter the transcription of IL-8, a TATA containing NF-κB target gene. These results suggest that NPM may be preferentially linked to a GC-rich promoter, such as the Mn-SOD gene. Because the MnSOD promoter can potentially form a DNA double-stem looping structure, this structure may facilitate the binding of NPM, a known RNA-binding protein. Thus, it is possible that NPM may serve as a link between proteins bound to the promoter and enhancer regions to enhance transcription of the human MnSOD gene. The finding that NPM had a greater effect on the basal expression than the inducible expression of the MnSOD gene suggests that TNF-α-induced MnSOD expression may require other transcription factors in addition to NPM.
In addition to NPM and nucleolin, another major protein identified by proteomic analysis from the 450 mM KCl fraction is the thyroid autoantigen, ku protein. Presently, the rationality for ku protein interaction with NF-κB is not clear. In the purification of protein by affinity chromatography, we used NF-κB double-stranded DNA as a probe; the double strand, break-repair ku protein may recognize the NF-κB consensus region as a double strand break and bind to it. Thus, the presence of ku protein is likely to be a consequence of the method used to isolate NF-κB proteins. However, we cannot eliminate the possibility of other functions of ku protein during the transcription process. Um et al. (49) reported that the ku protein, a DNA damage sensor and a key double strand, break-repair protein, is a component of the faster running NF-κB DNA binding complex activated during multidrug resistance. Thus, the role of ku protein in the transcription of MnSOD should be further elucidated in separate studies.
Our present study reveals a previously unrecognized role of NPM in the induction of the SOD2 gene. Considering the unique housekeeping gene promoter structure and the presence of a key NF-κB-responsive element in the intron, the role of NPM in this unique relationship is intriguing. Proteins previously thought to function mainly as RNA-binding proteins may actually have a major role in the transcription of housekeeping genes with a critical biological function, such as Mn-SOD, under both normal physiological and stressful conditions.
Footnotes
This work was supported by National Institute of Health Grants CA49797, CA 59835, AG 05119, and HL 03544 (to D. K. S. C.). The costs of publication of this article were defrayed in part by the payment of page charges. This article must therefore be hereby marked “advertisement” in accordance with 18 U.S.C. Section 1734 solely to indicate this fact.
- SOD
- superoxide dismutase
- MnSOD
- manganese superoxide dismutase
- NPM
- nucleophosmin
- NF-κB
- nuclear factor κB
- AP
- activating protein
- Sp1
- specificity protein 1
- PMA
- phorbol 12-myristate 13-acetate
- TNF-α
- tumor necrosis factor α
- IL-1β
- interleukin-1β
- DTT
- dithiothretol
- GAPDH
- glyceraldehyde-3-phosphate dehydrogenase
- PBS
- phosphate-buffered saline
- EMSA
- electro-phoretic mobility shift assay
- RT
- reverse transcriptase
- MOPS
- 4-morpholinepropanesulfonic acid
- siRNA
- small interfering RNA
- TNF-α
- tumor necrosis factor-α
- C/EBP
- CAAT-enhancer binding protein
REFERENCES
- 1.Halliwel B, Gutteridge JM. Methods Enzymol. 1990;186:1–85. doi: 10.1016/0076-6879(90)86093-b. [DOI] [PubMed] [Google Scholar]
- 2.Dougall WC, Nick HS. Endocrinology. 1991;129:2379–2384. doi: 10.1210/endo-129-5-2376. [DOI] [PubMed] [Google Scholar]
- 3.Suzuki K, Tatsumi H, Satoh S, Sendra T, Naskata T, Fuji J, Takiguchi N. Am. J. Physiol. 1993;265:H1173–H1178. doi: 10.1152/ajpheart.1993.265.4.H1173. [DOI] [PubMed] [Google Scholar]
- 4.Del Maestro R, McDonald W. Mech. Aging Dev. 1989;48:15–31. doi: 10.1016/0047-6374(89)90022-5. [DOI] [PubMed] [Google Scholar]
- 5.Wong GH, Elwell J, Overly L, Goeddel DV. Cell. 1989;58:923–931. doi: 10.1016/0092-8674(89)90944-6. [DOI] [PubMed] [Google Scholar]
- 6.Wong GH, Goeddel DV. Science. 1988;242:941–944. doi: 10.1126/science.3263703. [DOI] [PubMed] [Google Scholar]
- 7.Visner GA, Dougall WC, Wilson JM, Burr IM, Nick HS. J. Biol. Chem. 1990;256:2856–2864. [PubMed] [Google Scholar]
- 8.Fuji J, Taniguchi N. J. Biol. Chem. 1991;266:23142–23146. [PubMed] [Google Scholar]
- 9.Akashi M, Hachiya M, Paquette RL, Osawa Y, Shimizu S, Suzuki G. J. Biol. Chem. 1995;270:15864–15869. doi: 10.1074/jbc.270.26.15864. [DOI] [PubMed] [Google Scholar]
- 10.Eastgate J, Moreb J, Nick HS, Suzuki K, Taniguchi N, Zucali JR. Blood. 1993;81:639–646. [PubMed] [Google Scholar]
- 11.Manganaro F, Chopra VS, Mydlarski MB, Bernatchez G, Schipper HM. Free Radic. Biol. Med. 1995;19:823–835. doi: 10.1016/0891-5849(95)02008-x. [DOI] [PubMed] [Google Scholar]
- 12.Baker K, Marcus CB, Huffman K, Kruk H, Malfroy B, Doctrow SR. J. Pharmacol. Exp. Ther. 1998;284:215–221. [PubMed] [Google Scholar]
- 13.Li Y, Huang TT, Carison EJ, Melov S, Ursell PC, Olson JL, Noble LJ, Yoshimura MP, Berger C, Chan PH. Nat. Genet. 1995;11:376–381. doi: 10.1038/ng1295-376. [DOI] [PubMed] [Google Scholar]
- 14.Melov S, Schneider JA, Day BJ, Hinerfeld D, Coskun P, Mirra SS, Crapo JD, Wallace DC. Nat. Genet. 1998;18:159–163. doi: 10.1038/ng0298-159. [DOI] [PubMed] [Google Scholar]
- 15.Wispe JR, Warner BB, Clark JC, Dey CR, Neuman J, Glasser SW, Crapo JD, Chang L, Whitselt JA. J. Biol. Chem. 1992;267:23937–23941. [PubMed] [Google Scholar]
- 16.Yen H-C, Oberley TD, Vichitbandha S, HO Y-S, Clair DK. J. Clin. Investig. 1996;98:1253–1260. doi: 10.1172/JCI118909. [DOI] [PMC free article] [PubMed] [Google Scholar]
- 17.Keller JN, Kindy MS, Holtsberg FW, Clair DK, Yen H-C, Germeyer AM, Steiner SM, Bruce-Keller AJ, Hutchins JB, Mattson MP. J. Neurosci. 1998;18:687–697. doi: 10.1523/JNEUROSCI.18-02-00687.1998. [DOI] [PMC free article] [PubMed] [Google Scholar]
- 18.Church SL, Grant JM, Ridnour LA, Oberley LW, Swanson PE, Meltzer PS, Trent JM. Proc. Natl. Acad. Sci. U. S. A. 1993;90:3113–3117. doi: 10.1073/pnas.90.7.3113. [DOI] [PMC free article] [PubMed] [Google Scholar]
- 19.Safford SE, Oberley TD, Urano M, Clair DK. Cancer Res. 1994;54:4261–4265. [PubMed] [Google Scholar]
- 20.Urano M, Kuroda M, Reynolds R, Oberley TD, Clair DK. Cancer Res. 1995;55:2490–2493. [PubMed] [Google Scholar]
- 21.Zhong W, Oberley LW, Oberley TD, Clair DK. Oncogene. 1997;14:481–490. doi: 10.1038/sj.onc.1200852. [DOI] [PubMed] [Google Scholar]
- 22.Kiningham KK, Clair DK. Cancer Res. 1997;57:5265–5271. [PubMed] [Google Scholar]
- 23.Wan XS, Devalaraja MN, Clair DK. DNA Cell Biol. 1994;13:1127–1136. doi: 10.1089/dna.1994.13.1127. [DOI] [PubMed] [Google Scholar]
- 24.Meyrick B, Magnuson MA. Am. J. Respir. Cell Mol. Biol. 1994;10:113–121. doi: 10.1165/ajrcmb.10.1.8292376. [DOI] [PubMed] [Google Scholar]
- 25.Zhu C-H, Huang Y, Oberley LW, Domann FE. J. Biol. Chem. 2001;276:14407–14413. doi: 10.1074/jbc.M009708200. [DOI] [PubMed] [Google Scholar]
- 26.Zhu C, Huang Y, Weydert CJ, Oberley LW, Domann FE. Antioxid. Redox Signaling. 2001;3:387–395. doi: 10.1089/15230860152409031. [DOI] [PubMed] [Google Scholar]
- 27.Xu Y, Porntadavity S, Clair DK. Biochem. J. 2002;362:401–412. doi: 10.1042/0264-6021:3620401. [DOI] [PMC free article] [PubMed] [Google Scholar]
- 28.Mastrangelo IA, Courey AJ, Wall JS, Jackson SP, Hough PV. Proc. Natl. Acad. Sci. U. S. A. 1991;88:5670–5674. doi: 10.1073/pnas.88.13.5670. [DOI] [PMC free article] [PubMed] [Google Scholar]
- 29.Porntadavity S, Xu Y, Kiningham KK, Rangnekar VM, Prachayasitikul V, Clair DK. DNA Cell Biol. 2001;20:473–481. doi: 10.1089/104454901316976109. [DOI] [PubMed] [Google Scholar]
- 30.Jones PL, Ping D, Boss JM. Mol. Cell. Biol. 1997;17:6970–6981. doi: 10.1128/mcb.17.12.6970. [DOI] [PMC free article] [PubMed] [Google Scholar]
- 31.Xu Y, Kiningham KK, Devalaraja MN, Yeh C-C, Majima H, Kasarskis EJ, Clair DK. DNA Cell Biol. 1999;18:709–722. doi: 10.1089/104454999314999. [DOI] [PubMed] [Google Scholar]
- 32.Clair DK, Porntadavity S, Xu Y, Kiningham KK. Methods Enzymol. 2002;349:306–312. doi: 10.1016/s0076-6879(02)49345-7. [DOI] [PubMed] [Google Scholar]
- 33.Grilli M, Chiu JJ, Lenardo MJ. Int. Rev. Cytol. 1993;143:1–62. doi: 10.1016/s0074-7696(08)61873-2. [DOI] [PubMed] [Google Scholar]
- 34.Zabel U, Schreck R, Baeuerle PA. J. Biol. Chem. 1991;266:252–260. [PubMed] [Google Scholar]
- 35.Hirano F, Tanaka H, Hirano Y, Hiramoto M, Hanada H, Makino I, Scheidereit C. Mol. Cell. Biol. 1998;18:1266–1274. doi: 10.1128/mcb.18.3.1266. [DOI] [PMC free article] [PubMed] [Google Scholar]
- 36.Pascal E, Tjian R. Genes Dev. 1991;5:1646–1656. doi: 10.1101/gad.5.9.1646. [DOI] [PubMed] [Google Scholar]
- 37.Carrier F, Gatignol A, Hollander MC, Jeang KT, Fornace AJ., Jr. Proc. Natl. Acad. Sci. U. S. A. 1994;91:1544–1558. doi: 10.1073/pnas.91.4.1554. [DOI] [PMC free article] [PubMed] [Google Scholar]
- 38.Inouye CJ, Seto E. J. Biol. Chem. 1994;269:6506–6510. [PubMed] [Google Scholar]
- 39.Colombo E, Marine JC, Danovi D, Fulini B, Pelicci PG. Nat. Cell Biol. 2002;4:529–533. doi: 10.1038/ncb814. [DOI] [PubMed] [Google Scholar]
- 40.Chan EC, Fraser S, Yin S, Yeo G, Kwek K, Fairclough RJ, Smith R. J. Clin. Endocrinol. Metab. 2002;87:2435–2441. doi: 10.1210/jcem.87.6.8439. [DOI] [PubMed] [Google Scholar]
- 41.Kiningham KK, Xu Y, Daosukho C, Popova B, Clair DK. Biochem. J. 2001;353:147–156. [PMC free article] [PubMed] [Google Scholar]
- 42.Dignam JD, Lebovitz RM, Roeder RG. Nucleic Acids Res. 1983;11:1475–1489. doi: 10.1093/nar/11.5.1475. [DOI] [PMC free article] [PubMed] [Google Scholar]
- 43.Hagenbuchle O, Wellauer PK. Nucleic Acids Res. 1992;20:3553–3559. doi: 10.1093/nar/20.14.3555. [DOI] [PMC free article] [PubMed] [Google Scholar]
- 44.Shevchenko A, Wilm M, Vorm O, Jensen ON, Podtelejnikov AV, Neubauer G, Mortenson P, Mann M. Biochem. Soc. Trans. 1996;24:893–896. doi: 10.1042/bst0240893. [DOI] [PubMed] [Google Scholar]
- 45.Baldwin AS. Annu. Rev. Immunol. 1996;14:649–681. doi: 10.1146/annurev.immunol.14.1.649. [DOI] [PubMed] [Google Scholar]
- 46.Das KC, Lewis-Molock Y, White CW. Am. J. Physiol. 1995;269:L588–L602. doi: 10.1152/ajplung.1995.269.5.L588. [DOI] [PubMed] [Google Scholar]
- 47.Das KC, Lewis-Molock Y, White CW. Mol. Cell. Biochem. 1996;148:45–57. doi: 10.1007/BF00929502. [DOI] [PubMed] [Google Scholar]
- 48.Maehara K, Hasegawa T, Xiao H, Takeuchi A, Abe R, Isobe K-I. FEBS Lett. 1999;449:115–119. doi: 10.1016/s0014-5793(99)00408-1. [DOI] [PubMed] [Google Scholar]
- 49.Um JH, Kang CD, Lee BG, Kim DW, Chung BS, Kim SH. Oncogene. 2001;20:6048–6056. doi: 10.1038/sj.onc.1204732. [DOI] [PubMed] [Google Scholar]
- 50.Bernard D, Monte D, Vanderbunder B, Abbadie C. Oncogene. 2002;21:4392–4402. doi: 10.1038/sj.onc.1205536. [DOI] [PubMed] [Google Scholar]
- 51.Yanagida M, Shimamoto A, Nishikawa K, Furuichi Y, Isobe T, Takahashi N. Proteomics. 2001;1:1390–1404. doi: 10.1002/1615-9861(200111)1:11<1390::AID-PROT1390>3.0.CO;2-Z. [DOI] [PubMed] [Google Scholar]
- 52.Xu Y, Krishna A, Wan XS, Majima H, Yeh C-C, Ludewig G, Kasarskis EJ, Clair DK. Oncogene. 1999;18:93–102. doi: 10.1038/sj.onc.1202265. [DOI] [PubMed] [Google Scholar]