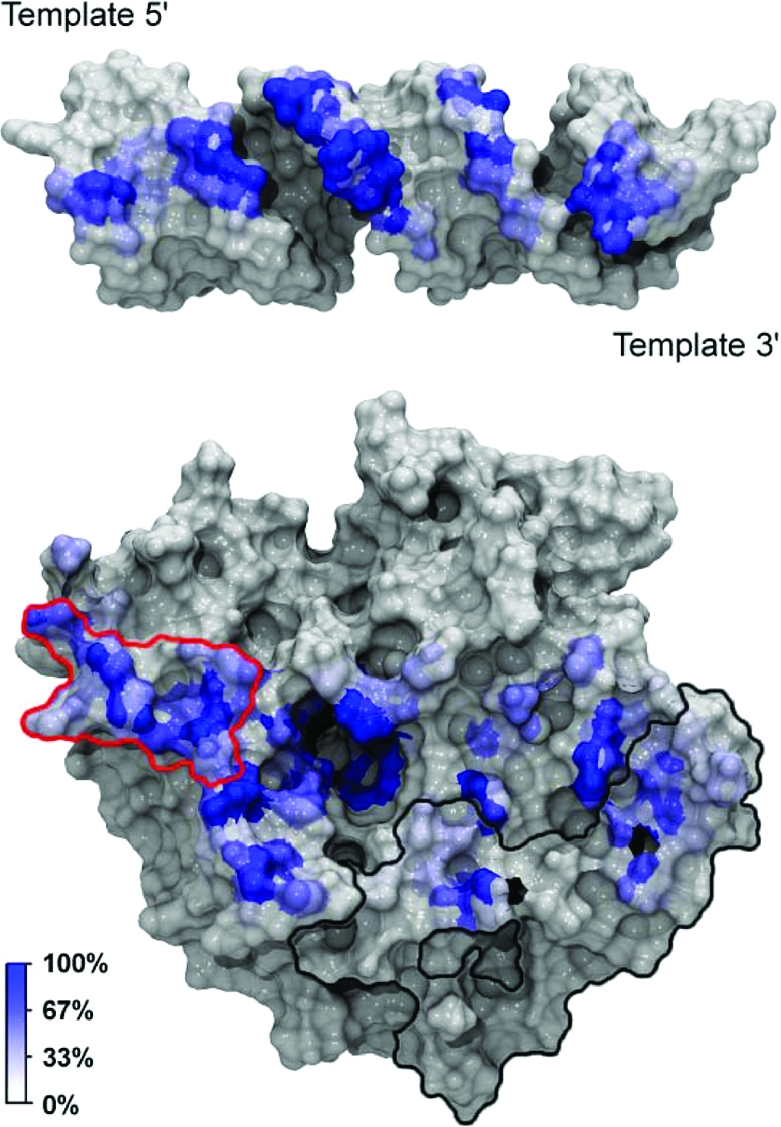
Figure 5.

RNA binding footprint. In the top panel, the protein dynamic contact footprint is projected onto the molecular surface of the RNA. In the bottom panel, the RNA dynamic contact footprint is projected onto the molecular surface of TbREL1. Both the protein and RNA are shown in gray surface representation with the contacts colored by percent occupancy over the dynamics portion of the simulation. A unique kinetoplastid insert is outlined in black, and a cluster of residues thought to be important in RNA recognition on the 5′-PO4 side of the nick is outlined in red.
