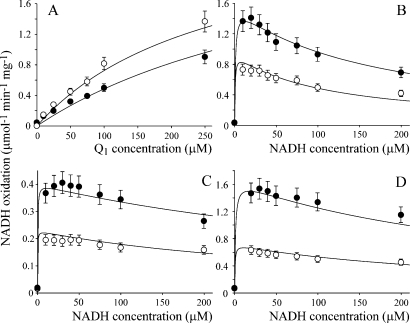
Figure 3.
Dependence of the rate of NADH:Q oxidoreduction at the hydrophilic site on NADH and Q concentration. (A) Dependence of NADH:Q1 oxidoreduction on Q1 concentration in 30 (○) and 100 μM NADH (●). (B) Dependence of NADH:Q1 oxidoreduction on NADH concentration at 100 (○) and 250 μM Q1 (●). The data in panels A and B have been fitted using the ping-pong mechanism, using the parameters in row 4 of Table 1. (C) Dependence of NADH:Q0 oxidoreduction on NADH concentration in 100 (○) and 250 μM Q0 (●). (D) Dependence of NADH:IDE oxidoreduction on NADH concentration in 100 (○) and 250 μM IDE (●). The data in panels C and D have been fitted using the ping-pong-pong mechanism, using the parameters in rows 11 and 12 of Table 1. Conditions: 32 °C in 20 mM Tris-HCl (pH 7.55) and 2.3 μM rotenone.

