Abstract
Similarities in the sequence and structure of allergens can explain clinically observed cross-reactivities. Distinguishing sequences that bind IgE in patient sera can be used to identify potentially allergenic protein sequences and aid in the design of hypo-allergenic proteins. The property distance index PD, incorporated in our Structural Database of Allergenic Proteins (SDAP, http://fermi.utmb.edu/SDAP/), may identify potentially cross-reactive segments of proteins, based on their similarity to known IgE epitopes. We sought to obtain experimental validation of the PD index as a quantitative predictor of IgE cross-reactivity, by designing peptide variants with predetermined PD scores relative to three linear IgE epitopes of Jun a 1, the dominant allergen from mountain cedar pollen. For each of the three epitopes, 60 peptides were designed with increasing PD values (decreasing physicochemical similarity) to the starting sequence. The peptides synthesized on a derivatized cellulose membrane were probed with sera from patients who were allergic to Jun a 1, and the experimental data were interpreted with a PD classification method. Peptides with low PD values relative to a given epitope were more likely to bind IgE from the sera than were those with PD values larger than 6. Control sequences, with PD values between 18 and 20 to all the three epitopes, did not bind patient IgE, thus validating our procedure for identifying negative control peptides. The PD index is a statistically validated method to detect discrete regions of proteins that have a high probability of cross-reacting with IgE from allergic patients.
Keywords: Allergen, Cross-reactivity, Physicochemical property index, Peptide design
1. Introduction
The last decade has seen great progress in identifying specific allergenic proteins and elucidating the sequences, and in some cases structures, that induce IgE responses to environmental triggers (Aalberse, 2000; Breiteneder and Radauer, 2004; Chapman et al., 2007). These advances provide a basis for identifying common molecular features of allergenic proteins, and should allow us to pinpoint those areas that distinguish these from similar, innocuous structures (Breiteneder and Mills, 2006; Ivanciuc et al., 2008; Jenkins et al., 2005; Oezguen et al., 2008; Schein et al., 2007). While many cross-reactive allergens have similar sequences and structures (Ivanciuc et al., 2008), overall sequence identity alone does not predict all proteins that might evoke a response in allergic individuals. Although the glycinins of soybean and peanut are 62% identical, the latter are much more likely to cause anaphylactic shock (Beardslee et al., 2000). Also, in some cases, changing single amino acids residues greatly decrease allergic reactivity (de Leon et al., 2003; Ferreira et al., 1998; Rabjohn et al., 2002; Scheurer et al., 1999). The major allergens from pollens, particularly the pectate lyases, vicilins and seed storage proteins from cedars (Czerwinski et al., 2005; Midoro-Horiuti et al., 1999, 2003, 2006), birch (Fedorov et al., 1997a,b; Ferreira et al., 1998; Spangfort et al., 1999), and grass (de Lalla et al., 1996; Flicker et al., 2000; Petersen et al., 1998; Schramm et al., 1997) are similar in overall sequence within each group of allergens, even across several phylogenetic groups (Breiteneder and Mills, 2005; Radauer and Breiteneder, 2006). Recent studies showed that IgE epitopes have low or no similarity to the human proteome (Kanduc, 2008). However, our ability to predict allergenic cross-reactivities is limited by our knowledge of the structural basis for these reactivities (Aalberse, 2007; Bonds et al., 2008; Goodman, 2006).
The availability of databases of allergenic proteins, including our Structural Database of Allergenic Proteins (SDAP, http://fermi.utmb.edu/SDAP/) (Ivanciuc et al., 2002, 2003b), permits us to use new bioinformatics approaches to identify the molecular similarities which underlie clinically relevant cross-reactivity between proteins from very different sources (Aalberse and Stadler, 2006; Marti et al., 2007; Mittag et al., 2006; Stadler and Stadler, 2003). After developing tools to rapidly compare the overall sequence of the more than 800 allergens in SDAP, we next developed the property distance index PD to detect short sequences with significant similarity to known linear IgE epitopes (Ivanciuc et al., 2003a). Given a peptide from the SDAP list of IgE epitopes or one provided by the user, this tool automatically calculates the PD index for each sequence-window with the same length for all allergens in SDAP, and returns a list of closely related sequences in known allergens (Ivanciuc et al., 2002, 2003b). The more closely the related peptides, the lower their physicochemical distance from one another in property space. We previously showed that PD scores accurately detected known IgE epitopes regions in Ara h 1 that were similar to one another in a predicted 3D structure (Schein et al., 2005a).
Here, we directly validated the PD index by investigating artificially generated sequences with a low PD value to three previously characterized epitopes that are recognized by IgE from individuals sensitive to the Jun a 1 allergen of cedar pollen (Midoro-Horiuti et al., 2003). Dot blot immunoassays were used to test a large number of naturally occurring and designed peptide sequences with varying PD values relative to the original epitopes of Jun a 1 for their binding of IgE antibodies from patients with mountain cedar sensitivity. Statistical treatments (classification methods and ROC curves) indicate that the PD values accurately identified peptides that are likely to be recognized by IgE from patient sera. In contrast, our negative controls, representing peptides designed to have very high PD values to all three epitopes, were not recognized by any patient sera. These results demonstrate that the PD index can be used to differentiate sequences that are most likely to evoke IgE-mediated reactions from innocuous ones.
2. Methods
2.1. The property distance index PD
A search option was included in SDAP to identify segments of allergen sequences with varying degrees of sequence similarities to known IgE epitopes in an automated fashion (Ivanciuc et al., 2002, 2003b). The sequence similarity is measured by a property distance index PD using the physicochemical properties of amino acids rather than their substitution frequencies in related proteins. The PD index is based on five amino acid descriptors E1–E5 that were determined by a multidimensional scaling of 237 physicochemical properties of amino acids (Venkatarajan and Braun, 2001). We hypothesized that segments of protein sequences with similar physicochemical properties, as measured by the PD index, can mediate immunologic cross-reactivity.
The PD index of two peptides with identical sequences is 0, and peptides with conservative substitutions of one or two amino acids have a small PD value, typically in the range of 0–4. Peptides with a recognizable similarity in their physicochemical properties tend to have PD indices lower than 10, whereas unrelated peptides have much higher PD values (Ivanciuc et al., 2003a). For example, when we scan all sequence windows of all allergens in SDAP with the peptide sequence of epitope 4 of Jun a 1 and calculate the lowest PD value for each allergen, the overwhelming majority of PD values are larger than 10 (Fig. 1). The distributions of PD indices for other known IgE epitopes, calculated in an identical approach versus all allergens in SDAP, are very similar (Schein et al., 2005a, 2007). Thus we conclude that PD values smaller than 10 only rarely occur by chance, and thus might have a biological meaning, especially when they are located in similar regions of homologous proteins or those with shared activities (Schein et al., 2005b). In contrast to other sequence similarity measures of peptides, which are based on the observed occurrence of amino acid substitutions averaged over large databases (i.e., matrices such as Gonnet, or the PAM and Blossum series), the PD index is based on basic physicochemical properties of the amino acids themselves, and represents a distance between two sequences.
Fig. 1.
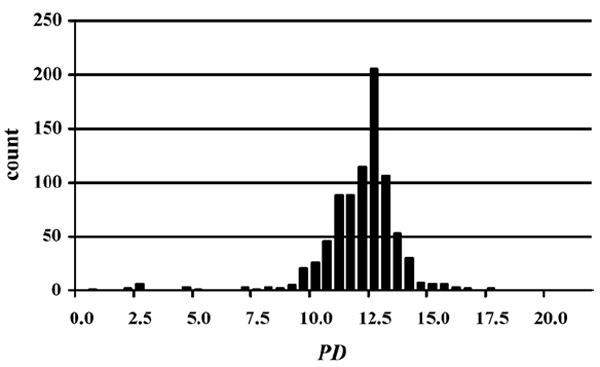
Distribution of the PD values of all peptide segments for all allergens in SDAP relative to epitope 4 from Jun a 1, where only the lowest PD value per sequence was retained. The average value of this distribution is 11.72 and the standard deviation is 1.71.
2.2. Selection and design of peptides with varying similarity to Jun a 1 IgE epitopes
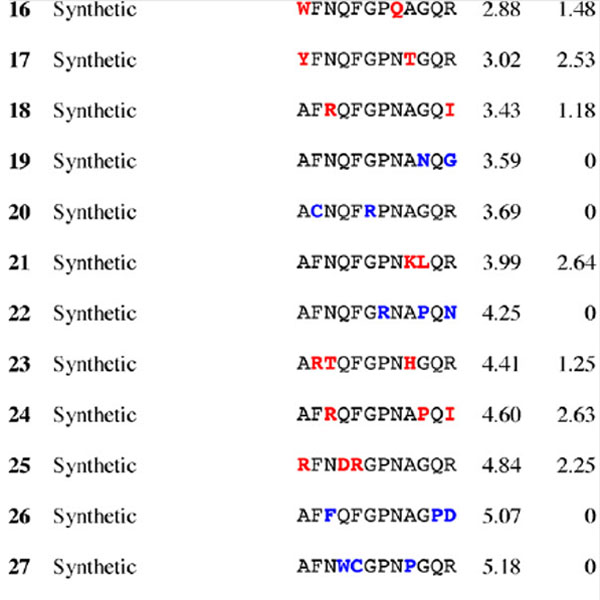
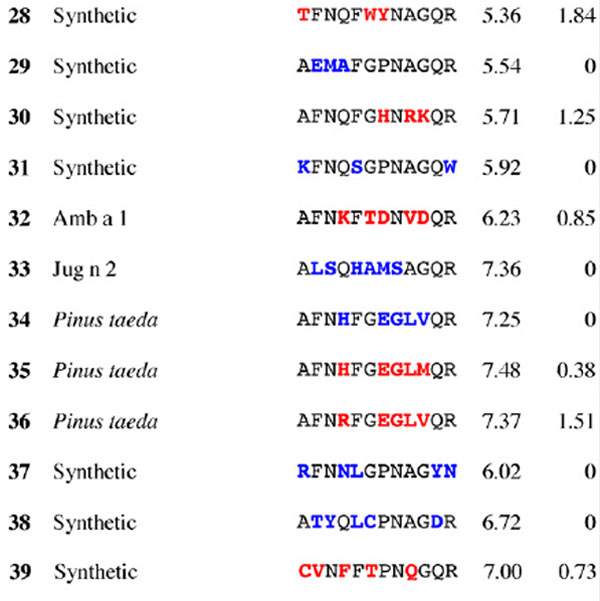
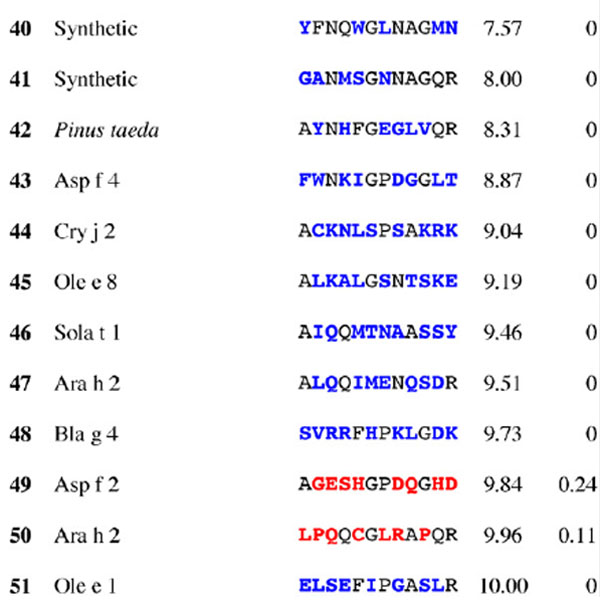
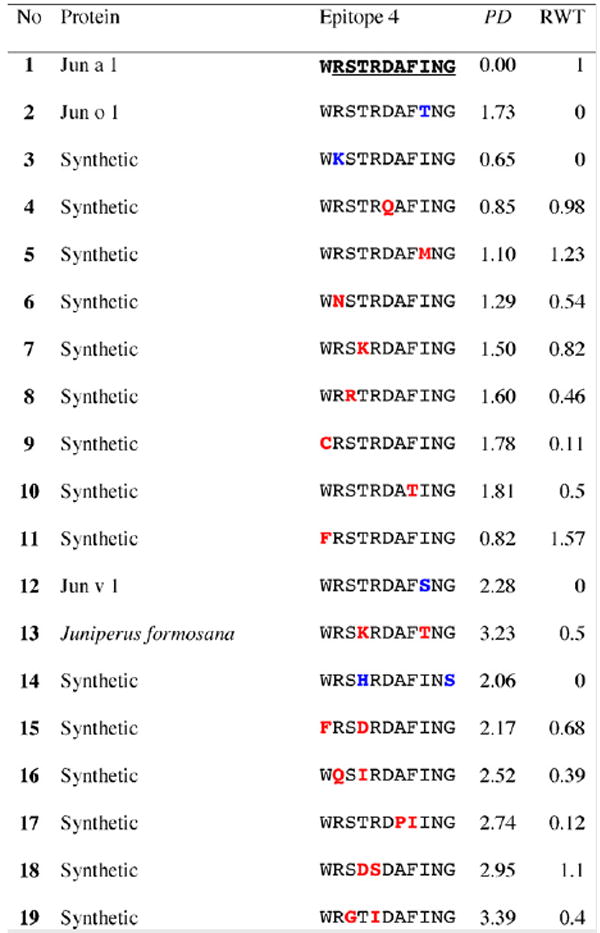
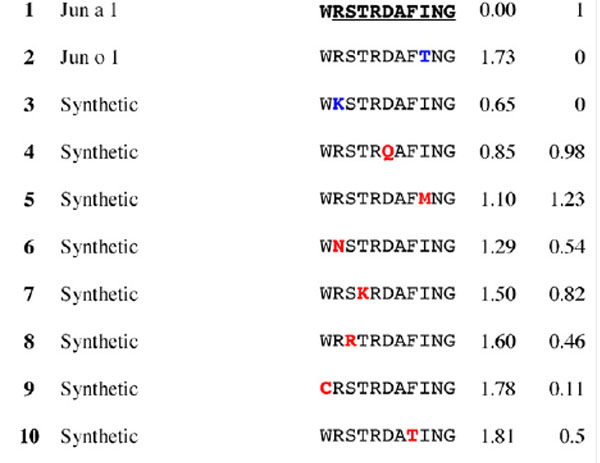
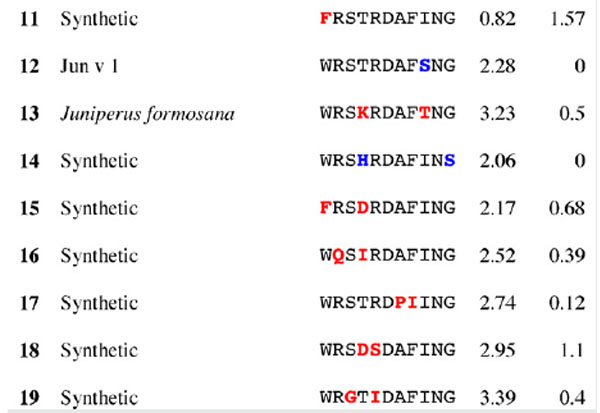
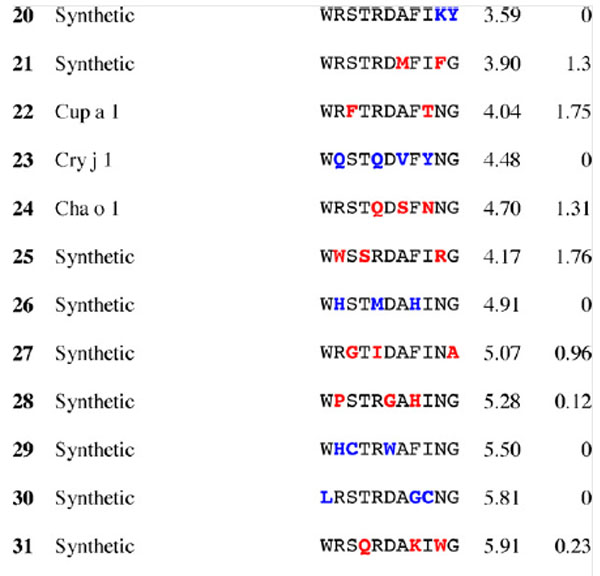
In order to test the prediction power of the PD index for IgE cross-reactivity, we chose three well-characterized linear IgE epitopes from Jun a 1 protein (AFNQFGPNAGQR, MPRARYGL, and WRSTRDAFING) (Midoro-Horiuti et al., 2003). We selected naturally occurring, homologous sequences from SDAP and supplemented these with computationally designed, novel peptides, to generate an array of 60 different peptides with varying physicochemical property distance for each Jun a 1 IgE epitope. This provided a sufficient number of peptides to determine whether the PD scale accurately predicts potential reactivity.
2.3. Selection of naturally occurring homologous sequences
We searched SDAP to select peptide sequences from homologues of Jun a 1 (e.g. Jun o 1, Jun v 1, Cup a 1, Cry j 1, Cha o 1 and Amb a 1), that correspond to, but are not identical in sequence to each of the three Jun a 1 epitopes. To expand the list of homologous structures, Jun a 1 homologues from all 104 species from the Juniperus and 34 from Cupressus genera were sequenced from genomic DNA purified from their leaves using DNeasy Plant kit (Qiagen). Polymerase chain reaction (PCR) amplification was performed with Jun a 1 primers, as described previously, with some modification (Midoro-Horiuti et al., 1999). Nucleotide sequences were determined using a PerkinElmer/Applied BioSystems model 373A DNA sequencer and primers designed for Jun a 1 sequencing.
Jun a 1 belongs to the pectate lyase family, a large group of homologous proteins that contains both allergens and proteins that have not been reported to be allergenic. To test the potential cross-reactivity between Jun a 1 and other pectate lyases that are not on the International Union of Immunological Societies (IUIS, http://www.allergen.org/Allergen.aspx) list of allergens, we included fragments for other related proteins, such as Lycopersicon esculentum (tomato), Zea mays (corn), Oryza sativa (rice), Mangifera indica (mango), Erwinia chrysanthemi, Arabidopsis thaliana (mouseear cress) and Pinus taeda (pine) that corresponded to the three epitopes.
2.4. Design of related peptides
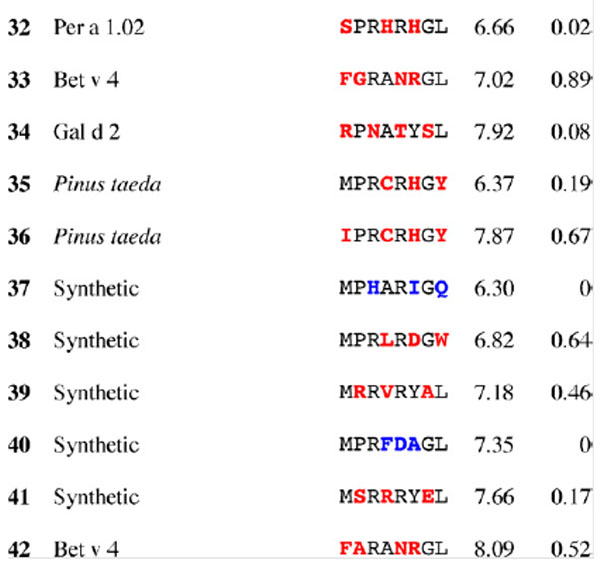
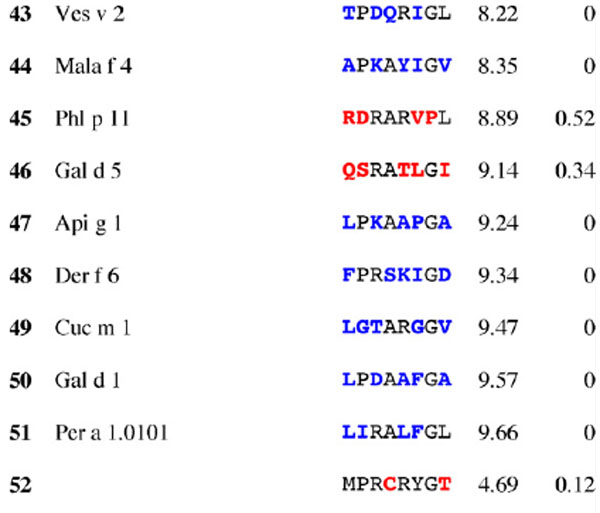
In order to explore in greater detail the peptide space around these epitopes, a number of designed peptides were generated to fill the slots remaining up to 60 per epitope. Starting from each of the Jun a 1 epitopes we introduced random mutations and collected the resulting sequences in such a way to have an even distribution of PD values between 0 and 10. The sequences of the naturally occurring homologues and designed peptides are given in Tables 1-3. Control peptides were designed to be with PD values that ranged between 18 and 20 from each of the three Jun a 1 epitopes thereby reducing the likelihood of cross-reactions with IgE antibodies.
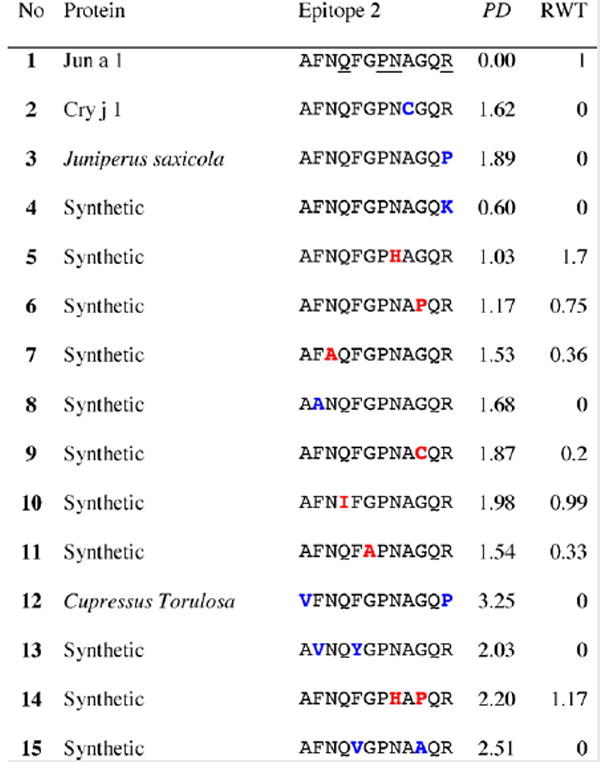
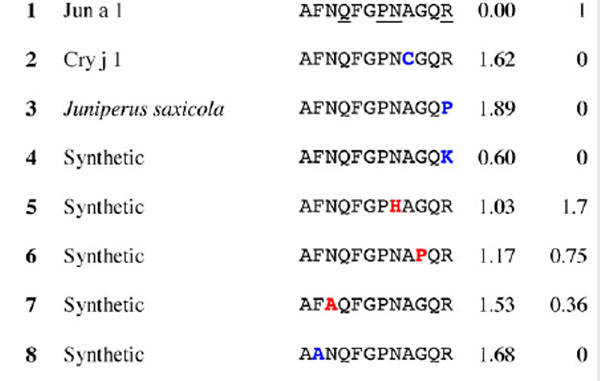
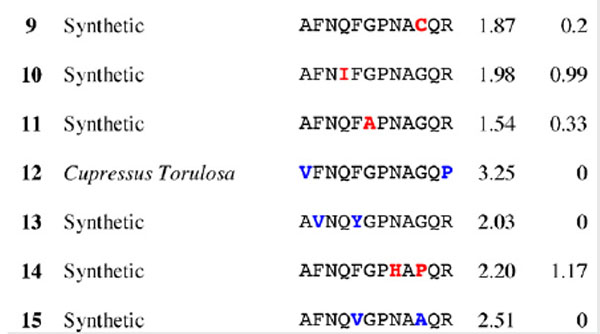
Table 1.
Results for epitope 2 of Jun a 1: peptide provenance and sequence, PD, and ratio to WT (RWT)
 |
|---|
 |
 |
 |
 |
 |
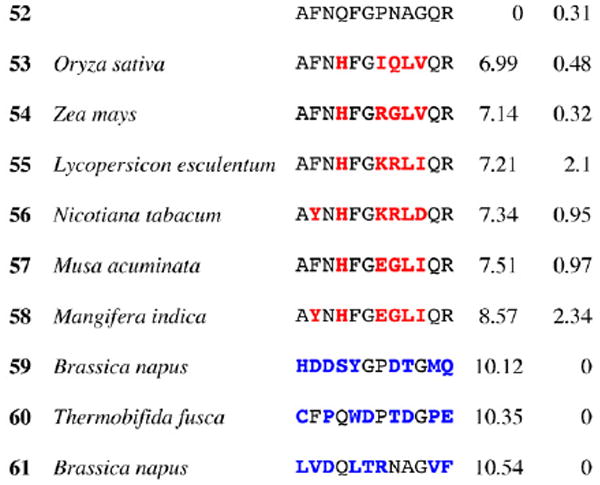 |
Peptides are shown in their order (by row and by column) from the membrane. Substituted residues are shown in color, red for cross-reactive peptides (RWT > 0), and blue for non-reactive peptides (RWT = 0). Surface exposed residues are underlined in the Jun a 1 epitope sequence.
Table 3.
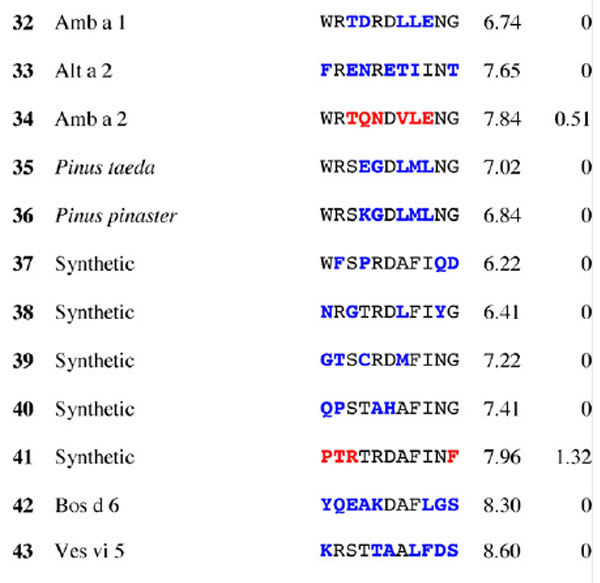
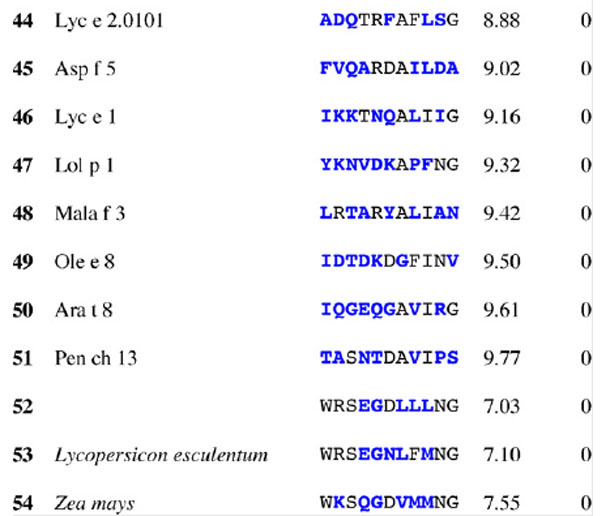
Results for epitope 4 of Jun a 1: peptide provenance and sequence, PD, and ratio to WT (RWT)
 |
|---|
 |
 |
 |
 |
 |
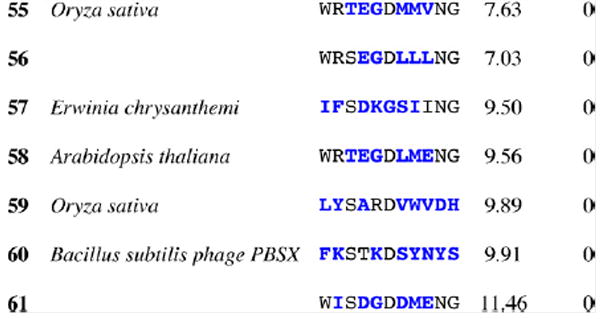 |
Peptides are shown in their order (by row and by column) from the membrane. Surface exposed residues are underlined in the Jun a 1 epitope sequence. Substituted residues are shown in color, red for cross-reactive peptides (RWT > 0), and blue for non-reactive peptides (RWT = 0).
2.5. Dot blot immunoassay for IgE antibody binding to Jun a 1 epitopes and their homologous peptides
Jun a 1 epitope 2–4 (Midoro-Horiuti et al., 2003) and their homologues peptides were synthesized on a derivatized cellulose membrane using N-(9-fluorenyl)methoxycarbonyl (Fmoc) amino acid active esters by Sigma Genosys. Sera from mountain cedar allergic patients were obtained from volunteers from the Austin, Texas, area. Four sera were selected based on the strength of their reactivity with peptides representing the originally identified Jun a 1 epitope (Fig. 2) and pooled, as described previously (Midoro-Horiuti et al., 2006). The binding of IgE from patients’ sera was analyzed as described (Midoro-Horiuti et al., 2003). The pooled sera were used as the source of the first antibody and biotinylated goat anti-human IgE (Vector) as the second antibody. The membranes were developed with HRP–streptavidin and ECL (Pharmacia). The intensity of the IgE binding to individual peptides on photographic images of the membrane was determined using Mat-lab software written locally (Mathworks, Inc., Natick, MA). The program allows the blot images to be cropped and rotated interactively. Adaptive thresholding is used to segment the image into spots and background, by subtracting the background from the spot image.
Fig. 2.
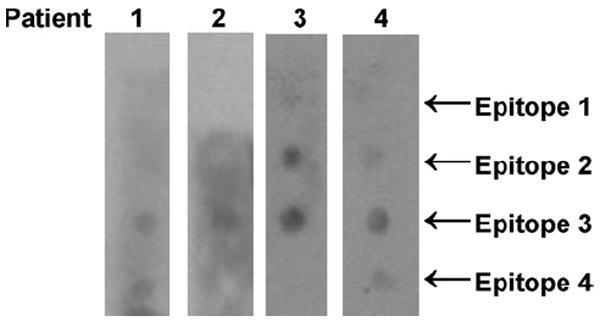
Strips displaying the four linear IgE-epitopes identified for Jun a 1, were reacted with individual sera from four patients allergic to mountain cedar pollen. Based on these results, these four sera were combined for dot blotting of the large membrane array.
2.6. Classification of the peptides based on the IgE antibody binding
For each peptide we define the intensity ratio to wild-type (RWT) as RWT = SIP/SIE, where SIP is the spot intensity of the test peptide and SIE is the spot intensity of the corresponding Jun a 1 epitope in the same column on the membrane. We classified a peptide with a positive ratio as cross-reactive with the IgE epitope (class +1), and those with a ratio of zero as not cross-reactive (class − 1). These class attributions are experimentally determined, and were then subsequently compared with those predicted by the PD classifier.
2.7. Quantitative assessment of the accuracy of a PD-based prediction of IgE binding
To predict a peptide to be cross-reactive from the PD index, We assign a peptide as being cross-reactive with the IgE antibody, if the PD index of this peptide is less than a threshold value PDthr. All peptides with PD < PDthr are thus predicted to be in class +1, whereas all peptides with PD > PDthr are predicted to be in class −1 (non-reactive). To assess the prediction accuracy of this PD based model, we determined standard parameters for the assessment of a prediction model: the number of true positive (TP) peptides, i.e. the number of experimentally classified +1 peptides that are predicted in class +1; false negatives (FN), the number of +1 peptides predicted in class −1; true negatives (TN), the number of −1 peptides predicted in class −1; false positives (FP), the number of −1 peptides predicted in class +1. We also investigated the sensitivity SN, SN = TP/(TP + FN) and the specificity SP, SP = TN/(TN + FP) of the prediction as a function of the threshold value by varying PDthr uniformly in the range between 0 and 10, and the receiver operating characteristic (ROC) curve (namely the plot of 1 – SP vs. SN, Fig. 6).
Fig. 6.
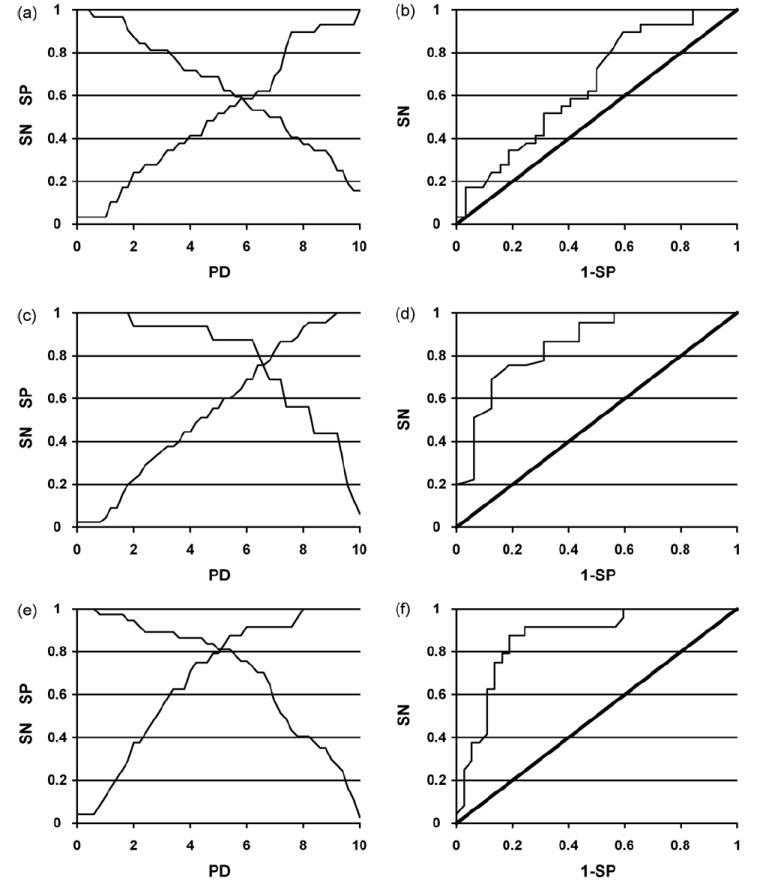
Plot of sensitivity (SN) and specificity (SP) vs. PD and ROC curve for epitopes: (a) and (b), epitope 2; (c) and (d), epitope 3; (e) and (f), epitope 4.
3. Results
Sera for the assays were selected from four mountain cedar-sensitive patients with strong reactivity for the linear IgE epitopes 2–4 that we previously identified in the sequence of Jun a 1 (Midoro-Horiuti et al., 2003). Reactivity was most pronounced to epitope 3, which was recognized by all four sera, whereas the detection of epitopes 2 and 4 was more variable (Fig. 2).
The membrane for the dot blot immunoassay for IgE antibody binding of the peptides was structured into four regions, one for each of the three Jun a 1 epitopes 2–4, and the fourth with control peptides (Fig. 3). To determine the variability in the measurements, the first row in each epitope group contains ten identical copies of the original epitope sequence. The relative signal intensities for these copies, ranged from 1 to 2.4 for epitope 2, and from 1 to 2 for epitopes 3 and 4. The following five rows each contain 10 different peptides whose PD values to the starting epitope are in discrete ranges (0–2, 2–4, 4–6, 6–8, and 8–10). These peptides were selected either from other allergen sequences in SDAP or were designed by randomly altering residues of the original epitope, as described in Section 2. The last row in each epitope group contains 10 different peptides from the same structural region of pectate lyases that have not been characterized as allergens.
Fig. 3.
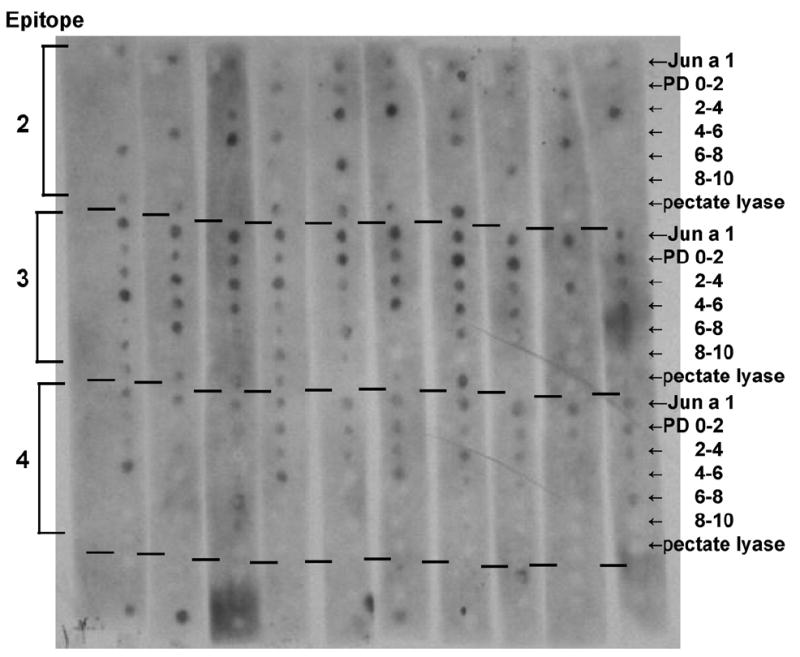
Dot blot showing IgE binding to peptides similar to Jun a 1 epitopes. The top row of each section is 10 repeats of the epitope, followed by peptides designed to have PD values in the indicated range; the last row contains naturally occurring sequences from other pectate lyases. See Tables 1-3 for sequence details and intensities.
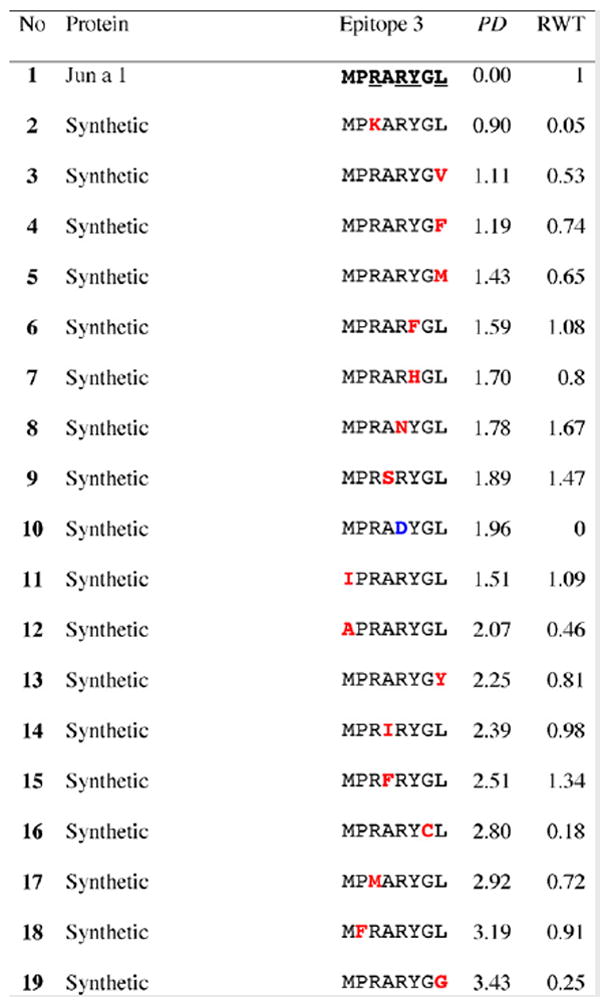
Visual inspection of the membrane (Fig. 3), especially for the universally recognized epitope 3, shows a clear relationship between the spot intensities and PD values, i.e. peptides with low PD values produced more intense spots, and the spot intensities decrease with increasing PD values. Also, the frequency of non-reactive peptides increases as PD increases, thus quantitatively confirming our initial hypothesis that the more similar peptides, i.e., those with lower PD, will bind IgE better than those with higher PD. Several peptides from other uncharacterized pectate lyases (last row of each section) also bind IgE, indicating that they are potentially cross-reactive with IgE against Jun a 1. These include pectate lyases from tomato, tobacco, banana, and mango, which showed a strong cross-reactivity with epitope 2, but not for the other epi-topes (Tables 1-3). Finally, none of the control peptides show any IgE reactivity, thus indicating that PD can be used to design peptides that are unlikely to react with antibodies to known epitopes.
Plots of spot intensities relative to the wild-type (RWT) values vs. PD (Fig. 4a, c and e) for all 60 peptides of each Jun a 1 epitope show more quantitatively that the intensities decrease as PD increases. In addition, the number of non-reactive peptides (i.e. with RWT = 0) increases with increasing PD value. This is clearly seen in the histograms of the percentage of cross-reactive peptides with RWT > 0 and non-reactive peptides with RWT = 0 for each interval of 2 PD units over the entire range of PD values from 0 to 10 (Fig. 4b, d and f). Most of the peptides with PD values less than 6 to epitopes 3 and 4 reacted with the serum IgE. For epitope 4, there is a sharp increase in the number of non-reactive peptides around PD value of 6, and a more gradual increase for epitope 3 over the same range. For epitope 2, non-reactive peptides are distributed along the entire curve, however the trend of a decreasing number of cross-reactive peptides with increasing PD values is also observed.
Fig. 4.
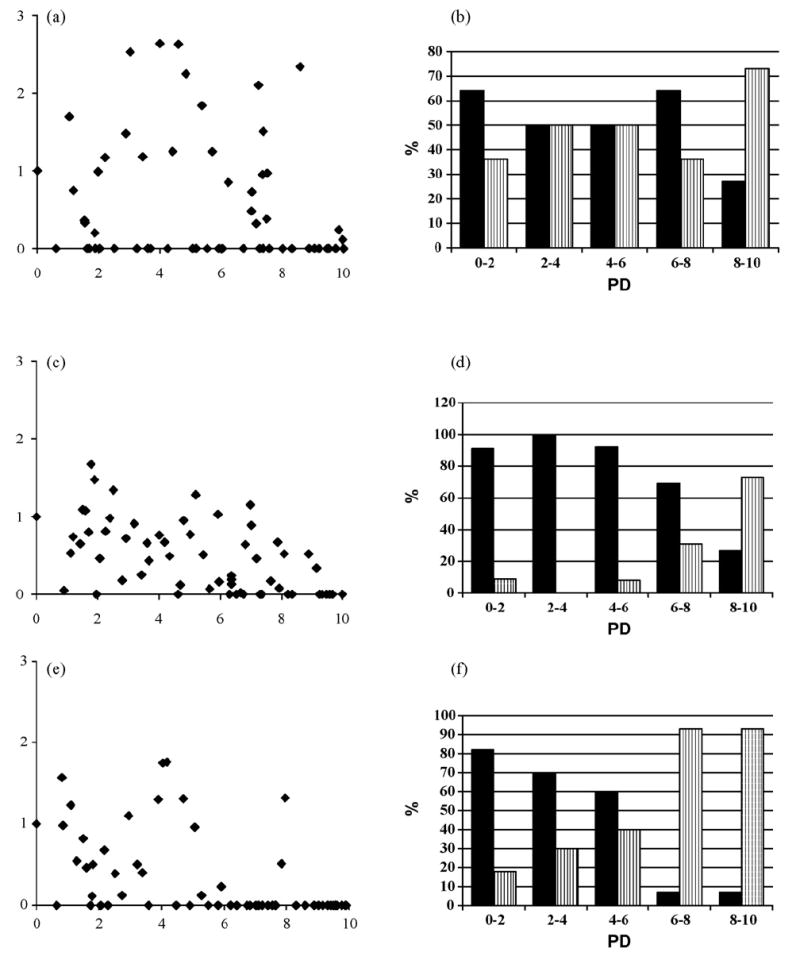
Plots of RWT vs. PD values and histograms for the percentage distribution of cross-reactive (black columns: RWT > 0) and non-reactive (vertical stripes: RWT = 0) peptides. Jun a 1 epitopes: (a) and (b), epitope 2; (c) and (d), epitope 3; (e) and (f), epitope 4.
The predictions of the PD classifier were compared to the experimental IgE binding data to determine the number of correct predictions for each peptide class dependent on the PDthr value. By varying the threshold value between 0 and 10 we obtain the plots for sensitivity and specificity of the classifier (Fig. 6a, c and e). For a given threshold PDthr, “true positive peptides (TP)” have PD < PDthr and RWT > 0. These are illustrated in Fig. 5 for epitope 4, together with the false positives (FP), false negatives (FN) and true negatives (TN). The intersection point of these two plots identifies the most predictive PD classifier. As expected the optimum PD threshold between cross-reactive and non-reactive peptides is close to the middle of the range selected for the dataset of peptides, namely 6 for epitope 2, 6.5 for epitope 3, and 5 for epitope 4. The percentage of correct predictions is 60% for epitope 2 and 80% for epitopes 3 and 4. This finding demonstrates that PD is a reliable index for identifying cross-reactive peptides (see Section 4). Further evidence was obtained from the ROC curves of the PD classifiers (Fig. 6b, d and f) that show that all three models are reliable, with better predictions obtained for the more widely recognized epitopes 3 and 4. We also investigated classifiers with a non-zero threshold for the peptide ratio, without any improvement of the prediction, as measured by the area under the ROC curve (data not shown).
Fig. 5.
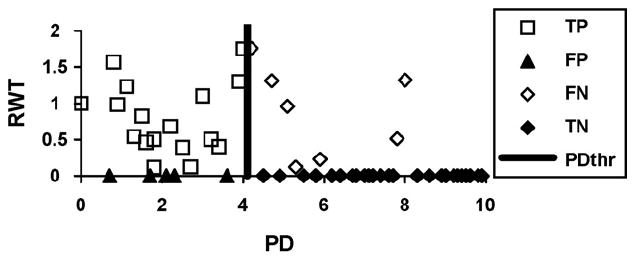
Assessment of a PD-based prediction model for a classifier with the threshold value PDthr = 4 for the Jun a 1 epitope 4. The diagram illustrates the distribution of the true positive (TP), the false negative (FN), the false positive (FP) and the true negative (TN) peptides.
4. Discussion
This work is based on the hypothesis that similarities of physicochemical properties of the amino acids of a peptide, rather than absolute identity, to those of an epitope can be used to predict whether the sequence would bind IgE. Our results are a quantitative validation of the property distance index PD as a tool to rank peptides according to the likelihood that they will cross-react with known linear IgE epitopes (Ivanciuc et al., 2002, 2003b). We previously showed that, starting from a known IgE epitope, PD values can identify and rank similar regions in homologous allergens (Ivanciuc et al., 2003a), and recognize structurally similar IgE epitopes (Schein et al., 2005a). These results establish that peptides with low PD values to a known epitope have a higher probability of binding IgE against that epitope.
We tested our hypothesis by designing a large array of different peptides with PD values between 0 and 10 relative to each of the three linear epitopes previously identified for Jun a 1 (Midoro-Horiuti et al., 2003), and we determined the ability of those peptides to bind to IgE antibodies from patients who are allergic to Jun a 1. As would be expected from the measurement deviations in the immuno-dot blot assays, there is no simple linear relation, i.e. direct quantitative correlation, between the PD value of a peptide and its measured intensity of binding to IgE. However, the peptides can be classified into two groups, i.e. those that bind IgE and non-binders, based only on their PD index alone, with a sensitivity and specificity of 60–80% for a threshold value PDthr of around 6. Qualitatively, the plots and histograms of RWT values vs. PD (Fig. 4) show that low PD peptides have a higher propensity for cross-reactivity than high PD peptides for all three epitopes. However, there are differences in the accuracy of the predictions. Whereas the accuracy of our prediction models reaches 80% for epitopes 3 and 4, we observed a lower accuracy (60%) for epitope 2. This might be explained by the 3D structural features of that epitope where many of the residues within that epitope region are buried within the molecule (Midoro-Horiuti et al., 2006). While the optimum PD threshold between cross-reactive and non-reactive peptides may vary among epitopes, it lies between 5 and 6.5 (within a 0–10 range) for all three epitopes we tested. It seems remarkable that the PD thresholds are so similar for these three epitopes in which the length and surface exposure is quite different. Although we selected the PD range [0,10] for this study based only on computations for epitopes in SDAP (Ivanciuc et al., 2002, 2003b) and on the statistical distribution of the PD values (Fig. 1), it is very reassuring to find that the optimum threshold value for PD is situated near the middle of this interval. Previous work has shown that structural similarities between the linear epitopes of Ara h 1 can be detected by peptides with PD values as high as 8 or 9 (Schein et al., 2005a), so the exact threshold for significance remains to be determined.
A possible reason for the observed differences between the three epitopes is the distinct reactivities of the individual sera from the 4 patients (Fig. 2). Epitope 3, the shortest epitope (seven residues), which is quite conserved among the cedar pollens, is recognized by all four sera, whereas the more variable and longer epitope 4 is recognized only by serum from patients 1 and 4, and epitope 2 by serum from patient 3. The difference in reactivities of the four epitopes may also arise from their different surface exposed area in the whole protein, as determined from the X-ray crystal structure of Jun a 1 (Czerwinski et al., 2005). According to GETAREA (http://pauli.utmb.edu/cgi-bin/get_a_form.tcl), a significant portion of epitope 2 is buried. Using a threshold of 10 Å2 accessible surface area/ residue, epitope 2 has 4 exposed residues out of 12, whereas epitope 4 has 10 out of 11. This could account for their differing RWT and PD values relationships.
The current study indicates that the simple PD similarity index performs remarkably well in predicting the sequence requirements for such complex protein–protein interactions as those involved in the allergen–IgE binding. The number of peptides variations we were able to compare in this experiment was much smaller than the total number, with 20 possible amino acids for each position. Visual inspection of the position of the mutated residues in the sequence (Tables 1-3) revealed no clear pivotal amino acids for IgE binding. Some observations from this study suggest that residues with more surface exposure are more important for binding. For example, among the peptides with low PD to epitope 3, only two peptides do not bind IgE and both have substitutions at surface exposed residues. This may also account for why many peptides with low PD values to the (highly surface exposed) epitope 4 do not bind IgE. Future studies could pinpoint positions that are more surface exposed in allergens for which the 3D structure is known (Aalberse and Stadler, 2006; Bonds et al., 2008; Breiteneder and Mills, 2006; Chapman et al., 2007; Henriksen et al., 2001; Meno et al., 2005; Oezguen et al., 2008). This should give more information about the actual epitope than simple alanine scanning, without requiring significantly more peptide synthesis.
Several noteworthy results were obtained when the homologous peptides derived from other cedar allergens were probed with the sera from patient with mountain cedar allergy. These peptides, derived from the related allergens Cry j 1, Jun o 1, Cup a 1, Cha o 1, are not significantly more cross-reactive than the synthetic peptides with similar PD values (Tables 1-3). These observations, as well as the recognition of areas from fruit and tobacco pectate lyases by IgE in these patient sera, will require further study to determine their clinical relevance in triggering food-pollen cross-reactivity (Bonds et al., 2008).
The new approach presented here can be easily extended to other allergens whose linear IgE epitopes have been determined, such as those from Pen a 1 (shrimp tropomyosin) (Ayuso et al., 2002), Jug r 1 (English walnut) (Robotham et al., 2002), Jun a 3 (mountain cedar) (Midoro-Horiuti et al., 2003), Cry j 2 (Japanese cedar) (Tamura et al., 2003), Par j 1 and Par j 2 (Asturias et al., 2003), Fag e 1 (buckwheat) (Yoshioka et al., 2004), the peanut allergens Ara h 1, Ara h 2, and Ara h 3 (Helm et al., 2000; Rabjohn et al., 2002; Shreffler et al., 2004), and for the IgE and IgG4 epitopes of Ara h 2 (Shreffler et al., 2005). The PD scale could be integrated in a procedure to select proteins of unknown allergenic potential that are most likely to cross-react with characterized allergens (WHO, 2003). Another application of the PD index is in the bioinformatics analysis of emerging proteomic methods to identify allergens and their epitopes (González-Buitrago et al., 2007). We suggest that a statistical analysis of these data and the computational design of synthetic peptides with low PD values to the known IgE epitopes can identify the critical components of IgE epitopes and guide the design of allergen vaccines (Spangfort, 2003; Weber, 2005).
5. Conclusions
The analysis of the results obtained for the library of peptides homologous to Jun a 1 linear epitopes experimentally validates the PD index as a quantitative tool for predicting epitope cross-reactivity. These results suggest that some or all of the physicochemical properties encoded into the PD index are good predictors of the peptide structure–IgE binding relationship, and that PD values or similar indices may allow us to predict the allergenic potential of a protein and to design hypo-allergenic proteins.
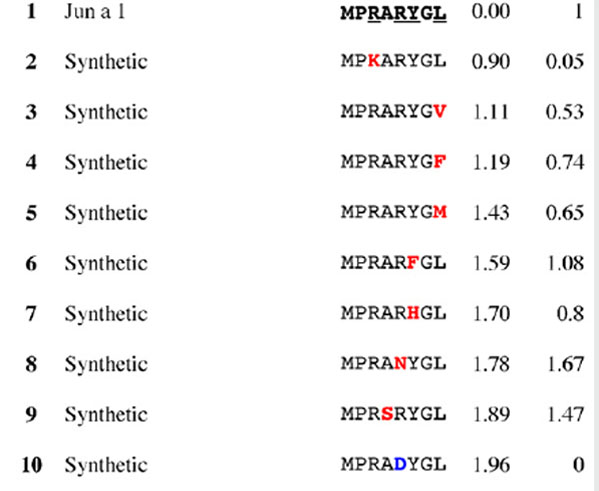
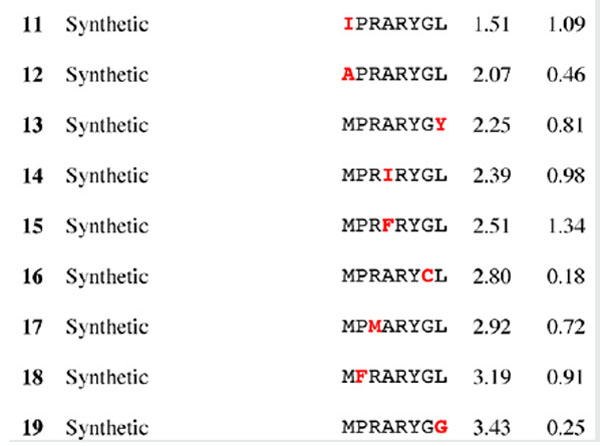
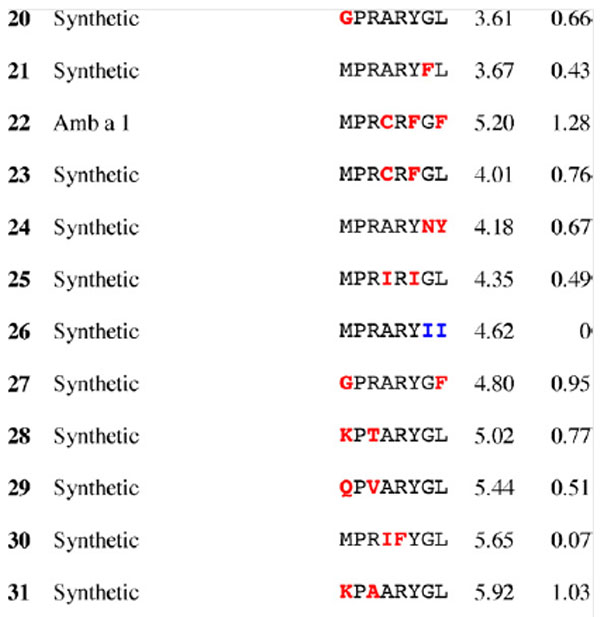
Table 2.
Results for epitope 3 of Jun a 1: peptide provenance and sequence, PD, and ratio to WT (RWT)
 |
|---|
 |
 |
 |
 |
 |
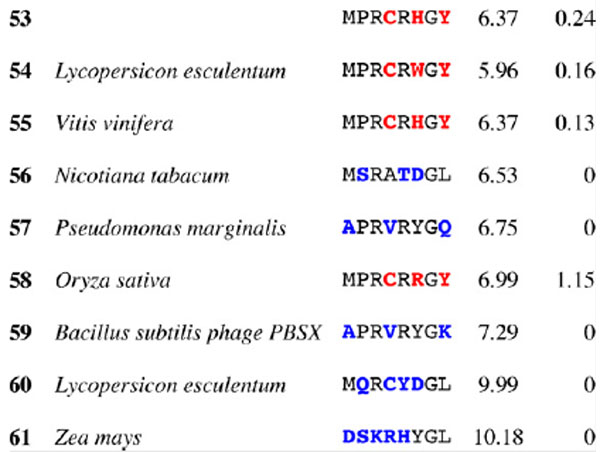 |
Peptides are shown in their order (by row and by column) from the membrane. Surface exposed residues are underlined in the Jun a 1 epitope sequence. Substituted residues are shown in color, red for cross-reactive peptides (RWT > 0), and blue for non-reactive peptides (RWT = 0).
Acknowledgments
TMH acknowledges grant support from NIH (K08 AI055792) and Biomedical Research Award from American Lung Association. RMG acknowledges grant support from NIH (R01 AI052428) and NIEHS Center for Environmental Science (ES06676). WB acknowledges a contract from the U.S. Food and Drug Administration (HHSF223200710011I), and grants from the National Institute of Health (R01 AI 064913), and the U.S. Environmental Protection Agency under a STAR Research Assistance Agreement (No. RD 833137). The article has not been formally reviewed by the EPA, and the views expressed in this document are solely those of the authors.
References
- Aalberse RC. Structural biology of allergens. Journal of Allergy and Clinical Immunology. 2000;106:228–238. doi: 10.1067/mai.2000.108434. [DOI] [PubMed] [Google Scholar]
- Aalberse RC. Assessment of allergen cross-reactivity. Clinical and Molecular Allergy. 2007;5:2. doi: 10.1186/1476-7961-5-2. [DOI] [PMC free article] [PubMed] [Google Scholar]
- Aalberse RC, Stadler BM. In silico predictability of allergenicity: from amino acid sequence via 3-D structure to allergenicity. Molecular Nutrition & Food Research. 2006;50:625–627. doi: 10.1002/mnfr.200500270. [DOI] [PubMed] [Google Scholar]
- Asturias JA, Gomez-Bayon N, Eseverri JL, Martinez A. Par j 1 and Par j 2, the major allergens from Parietaria judaica pollen, have similar immunoglobulin E epitopes. Clinical and Experimental Allergy. 2003;33:518–524. doi: 10.1046/j.1365-2222.2003.01631.x. [DOI] [PubMed] [Google Scholar]
- Ayuso R, Lehrer SB, Reese G. Identification of continuous, allergenic regions of the major shrimp allergen Pen a 1 (tropomyosin) International Archives of Allergy and Immunology. 2002;127:27–37. doi: 10.1159/000048166. [DOI] [PubMed] [Google Scholar]
- Beardslee TA, Zeece MG, Sarath G, Markwell JP. Soybean glycinin G1 acidic chain shares IgE epitopes with peanut allergen Ara h 3. International Archives of Allergy and Immunology. 2000;123:299–307. doi: 10.1159/000053642. [DOI] [PubMed] [Google Scholar]
- Bonds RS, Midoro-Horiuti T, Goldblum R. A structural basis for food allergy: the role of cross-reactivity. Current Opinion in Allergy and Clinical Immunology. 2008;8:82–86. doi: 10.1097/ACI.0b013e3282f4177e. [DOI] [PubMed] [Google Scholar]
- Breiteneder H, Mills C. Structural bioinformatic approaches to understand cross-reactivity. Molecular Nutrition & Food Research. 2006;50:628–632. doi: 10.1002/mnfr.200500274. [DOI] [PubMed] [Google Scholar]
- Breiteneder H, Mills ENC. Plant food allergens–structural and functional aspects of allergenicity. Biotechnology Advances. 2005;23:395–399. doi: 10.1016/j.biotechadv.2005.05.004. [DOI] [PubMed] [Google Scholar]
- Breiteneder H, Radauer C. A classification of plant food allergens. Journal of Allergy and Clinical Immunology. 2004;113:821–830. doi: 10.1016/j.jaci.2004.01.779. [DOI] [PubMed] [Google Scholar]
- Chapman MD, Pomés A, Breiteneder H, Ferreira F. Nomenclature and structural biology of allergens. Journal of Allergy and Clinical Immunology. 2007;119:414–420. doi: 10.1016/j.jaci.2006.11.001. [DOI] [PubMed] [Google Scholar]
- Czerwinski EW, Midoro-Horiuti T, White MA, Brooks EG, Goldblum RM. Crystal structure of Jun a 1, the major cedar pollen allergen from Juniperus ashei, reveals a parallel beta-helical core. Journal of Biological Chemistry. 2005;280:3740–3746. doi: 10.1074/jbc.M409655200. [DOI] [PMC free article] [PubMed] [Google Scholar]
- de Lalla C, Tamborini E, Longhi R, Tresoldi E, Manoni M, Siccardi AG, Arosio P, Sidoli A. Human recombinant antibody fragments specific for a rye-grass pollen allergen: characterization and potential applications. Molecular Immunology. 1996;33:1049–1058. doi: 10.1016/s0161-5890(96)00061-2. [DOI] [PubMed] [Google Scholar]
- de Leon MP, Glaspole IN, Drew AC, Rolland JM, O’Hehir RE, Suphioglu C. Immunological analysis of allergenic cross-reactivity between peanut and tree nuts. Clinical and Experimental Allergy. 2003;33:1273–1280. doi: 10.1046/j.1365-2222.2003.01761.x. [DOI] [PubMed] [Google Scholar]
- Fedorov AA, Ball T, Mahoney NM, Valenta R, Almo SC. The molecular basis for allergen cross-reactivity: crystal structure and IgE-epitope mapping of birch pollen profilin. Structure. 1997a;5:33–45. doi: 10.1016/s0969-2126(97)00164-0. [DOI] [PubMed] [Google Scholar]
- Fedorov AA, Ball T, Valenta R, Almo SC. X-ray crystal structures of birch pollen profilin and Phl p 2. International Archives of Allergy and Immunology. 1997b;113:109–113. doi: 10.1159/000237520. [DOI] [PubMed] [Google Scholar]
- Ferreira F, Ebner C, Kramer B, Casari G, Briza P, Kungl AJ, Grimm R, Jahn-Schmid B, Breiteneder H, Kraft D, Breitenbach M, Rheinberger H, Scheiner O. Modulation of IgE reactivity of allergens by site-directed mutagenesis: potential use of hypoallergenic variants for immunotherapy. FASEB Journal. 1998;12:231–242. doi: 10.1096/fasebj.12.2.231. [DOI] [PubMed] [Google Scholar]
- Flicker S, Vrtala S, Steinberger P, Vangelista L, Bufe A, Petersen A, Ghannadan M, Sperr WR, Valent P, Norderhaug L, Bohle B, Stockinger H, Suphioglu C, Ong EK, Kraft D, Valenta R. A human monoclonal IgE antibody defines a highly allergenic fragment of the major timothy grass pollen allergen, Phl p 5: molecular, immunological, and structural characterization of the epitope-containing domain. Journal of Immunology. 2000;165:3849–3859. doi: 10.4049/jimmunol.165.7.3849. [DOI] [PubMed] [Google Scholar]
- González-Buitrago JM, Ferreira L, Isidoro-García M, Sanz C, Lorente F, Dávila I. Proteomic approaches for identifying new allergens and diagnosing allergic diseases. Clinica Chimica Acta. 2007;385:21–27. doi: 10.1016/j.cca.2007.07.010. [DOI] [PubMed] [Google Scholar]
- Goodman RE. Practical and predictive bioinformatics methods for the identification of potentially cross-reactive protein matches. Molecular Nutrition & Food Research. 2006;50:655–660. doi: 10.1002/mnfr.200500277. [DOI] [PubMed] [Google Scholar]
- Helm RM, Cockrell G, Connaughton C, Sampson HA, Bannon GA, Beilinson V, Nielsen NC, Burks AW. A soybean G2 glycinin allergen. 2. Epitope mapping and three-dimensional modelling. International Archives of Allergy and Immunology. 2000;123:213–219. doi: 10.1159/000024446. [DOI] [PubMed] [Google Scholar]
- Henriksen A, King TP, Mirza O, Monsalve RI, Meno K, Ipsen H, Larsen JN, Gajhede M, Spangfort MD. Major venom allergen of yellow jackets, Ves v 5: structural characterization of a pathogenesis-related protein superfamily. Proteins. 2001;45:438–448. doi: 10.1002/prot.1160. [DOI] [PubMed] [Google Scholar]
- Ivanciuc O, Garcia T, Torres M, Schein CH, Braun W. Characteristic motifs for families of allergenic proteins. Molecular Immunology. 2008 doi: 10.1016/j.molimm.2008.07.034. [DOI] [PMC free article] [PubMed] [Google Scholar]
- Ivanciuc O, Mathura V, Midoro-Horiuti T, Braun W, Goldblum RM, Schein CH. Detecting potential IgE-reactive sites on food proteins using a sequence and structure database, SDAP-food. Journal of Agricultural and Food Chemistry. 2003a;51:4830–4837. doi: 10.1021/jf034218r. [DOI] [PubMed] [Google Scholar]
- Ivanciuc O, Schein CH, Braun W. Data mining of sequences and 3D structures of allergenic proteins. Bioinformatics. 2002;18:1358–1364. doi: 10.1093/bioinformatics/18.10.1358. [DOI] [PubMed] [Google Scholar]
- Ivanciuc O, Schein CH, Braun W. SDAP: database and computational tools for allergenic proteins. Nucleic Acids Research. 2003b;31:359–362. doi: 10.1093/nar/gkg010. [DOI] [PMC free article] [PubMed] [Google Scholar]
- Jenkins JA, Griffiths-Jones S, Shewry PR, Breiteneder H, Mills ENC. Structural relatedness of plant food allergens with specific reference to cross-reactive allergens: an in silico analysis. Journal of Allergy and Clinical Immunology. 2005;115:163–170. doi: 10.1016/j.jaci.2004.10.026. [DOI] [PubMed] [Google Scholar]
- Kanduc D. Correlating low-similarity peptide sequences and allergenic epitopes. Current Pharmaceutical Design. 2008;14:289–295. doi: 10.2174/138161208783413257. [DOI] [PubMed] [Google Scholar]
- Marti P, Truffer R, Stadler MB, Keller-Gautschi E, Crameri R, Mari A, Schmid-Grendelmeier P, Miescher SM, Stadler BM, Vogel M. Allergen motifs and the prediction of allergenicity. Immunology Letters. 2007;109:47–55. doi: 10.1016/j.imlet.2007.01.002. [DOI] [PubMed] [Google Scholar]
- Meno K, Thorsted PB, Ipsen H, Kristensen O, Larsen JN, Spangfort MD, Gajhede M, Lund K. The crystal structure of recombinant proDer p 1, a major house dust mite proteolytic allergen. Journal of Immunology. 2005;175:3835–3845. doi: 10.4049/jimmunol.175.6.3835. [DOI] [PubMed] [Google Scholar]
- Midoro-Horiuti T, Goldblum RM, Kurosky A, Wood TG, Schein CH, Brooks EG. Molecular cloning of the mountain cedar (Juniperus ashei) pollen major allergen, Jun a 1. Journal of Allergy and Clinical Immunology. 1999;104:613–617. doi: 10.1016/s0091-6749(99)70332-5. [DOI] [PubMed] [Google Scholar]
- Midoro-Horiuti T, Mathura V, Schein CH, Braun W, Yu SN, Watanabe M, Lee JC, Brooks EG, Goldblum RM. Major linear IgE epitopes of mountain cedar pollen allergen Jun a 1 map to the pectate lyase catalytic site. Molecular Immunology. 2003;40:555–562. doi: 10.1016/s0161-5890(03)00168-8. [DOI] [PubMed] [Google Scholar]
- Midoro-Horiuti T, Schein CH, Mathura V, Werner B, Czerwinski EW, Togawa A, Kondo Y, Oka T, Watanabe M, Goldblum RM. Structural basis for epitope sharing between group 1 allergens of cedar pollen. Molecular Immunology. 2006;43:509–518. doi: 10.1016/j.molimm.2005.05.006. [DOI] [PMC free article] [PubMed] [Google Scholar]
- Mittag D, Batori V, Neudecker P, Wiche R, Friis EP, Ballmer-Weber BK, Vieths S, Roggen EL. A novel approach for investigation of specific and cross-reactive IgE epitopes on Bet v 1 and homologous food allergens in individual patients. Molecular Immunology. 2006;43:268–278. doi: 10.1016/j.molimm.2005.02.008. [DOI] [PubMed] [Google Scholar]
- Oezguen N, Zhou B, Negi SS, Ivanciuc O, Schein CH, Labesse G, Braun W. Comprehensive 3D-modeling of allergenic proteins and amino acid composition of potential conformational IgE epitopes. Molecular Immunology. 2008;45:3740–3747. doi: 10.1016/j.molimm.2008.05.026. [DOI] [PMC free article] [PubMed] [Google Scholar]
- Petersen A, Schramm G, Schlaak M, Becker WM. Post-translational modifications influence IgE reactivity to the major allergen Phl p 1 of timothy grass pollen. Clinical and Experimental Allergy. 1998;28:315–321. doi: 10.1046/j.1365-2222.1998.00221.x. [DOI] [PubMed] [Google Scholar]
- Rabjohn P, West CM, Connaughton C, Sampson HA, Helm RM, Burks AW, Bannon GA. Modification of peanut allergen Ara h 3: effects on IgE binding and T cell stimulation. International Archives of Allergy and Immunology. 2002;128:15–23. doi: 10.1159/000057999. [DOI] [PubMed] [Google Scholar]
- Radauer C, Breiteneder H. Pollen allergens are restricted to few protein families and show distinct patterns of species distribution. Journal of Allergy and Clinical Immunology. 2006;117:141–147. doi: 10.1016/j.jaci.2005.09.010. [DOI] [PubMed] [Google Scholar]
- Robotham JM, Teuber SS, Sathe SK, Roux KH. Linear IgE epitope mapping of the English walnut (Juglans regia) major food allergen, Jug r 1. Journal of Allergy and Clinical Immunology. 2002;109:143–149. doi: 10.1067/mai.2002.120558. [DOI] [PubMed] [Google Scholar]
- Schein CH, Ivanciuc O, Braun W. Common physical–chemical properties correlate with similar structure of the IgE epitopes of peanut allergens. Journal of Agricultural and Food Chemistry. 2005a;53:8752–8759. doi: 10.1021/jf051148a. [DOI] [PubMed] [Google Scholar]
- Schein CH, Ivanciuc O, Braun W. Bioinformatics approaches to classifying allergens and predicting cross-reactivity. Immunology and Allergy Clinics of North America. 2007;27:1–27. doi: 10.1016/j.iac.2006.11.005. [DOI] [PMC free article] [PubMed] [Google Scholar]
- Schein CH, Zhou B, Oezguen N, Mathura VS, Braun W. Molego-based definition of the architecture and specificity of metal-binding sites. Proteins. 2005b;58:200–210. doi: 10.1002/prot.20253. [DOI] [PubMed] [Google Scholar]
- Scheurer S, Son DY, Boehm M, Karamloo F, Franke S, Hoffmann A, Haustein D, Vieths S. Cross-reactivity and epitope analysis of Pru a 1, the major cherry allergen. Molecular Immunology. 1999;36:155–167. doi: 10.1016/s0161-5890(99)00033-4. [DOI] [PubMed] [Google Scholar]
- Schramm G, Bufe A, Petersen A, Haas H, Schlaak M, Becker WM. Mapping of IgE-binding epitopes on the recombinant major group I allergen of velvet grass pollen, rHol I 1. Journal of Allergy and Clinical Immunology. 1997;99:781–787. doi: 10.1016/s0091-6749(97)80012-7. [DOI] [PubMed] [Google Scholar]
- Shreffler WG, Beyer K, Chu T-HT, Burks AW, Sampson HA. Microarray immunoassay: association of clinical history, in vitro IgE function, and heterogeneity of allergenic peanut epitopes. Journal of Allergy and Clinical Immunology. 2004;113:776–782. doi: 10.1016/j.jaci.2003.12.588. [DOI] [PubMed] [Google Scholar]
- Shreffler WG, Lencer DA, Bardina L, Sampson HA. IgE and IgG4 epitope mapping by microarray immunoassay reveals the diversity of immune response to the peanut allergen, Ara h 2. Journal of Allergy and Clinical Immunology. 2005;116:893–899. doi: 10.1016/j.jaci.2005.06.033. [DOI] [PubMed] [Google Scholar]
- Spangfort MD. Engineering and validation of recombinant proteins for allergen vaccines. Arbeiten aus dem Paul-Ehrlich-Institut (Bundesamt fur Sera und Impfstoffe) zu Frankfurt a M. 2003:151–154. discussion 155. [PubMed] [Google Scholar]
- Spangfort MD, Mirza O, Holm J, Larsen JN, Ipsen H, Lowenstein H. The structure of major birch pollen allergens–epitopes, reactivity and cross-reactivity. Allergy. 1999;54:23–26. doi: 10.1111/j.1398-9995.1999.tb05021.x. [DOI] [PubMed] [Google Scholar]
- Stadler MB, Stadler BM. Allergenicity prediction by protein sequence. FASEB Journal. 2003;17:1141–1143. doi: 10.1096/fj.02-1052fje. [DOI] [PubMed] [Google Scholar]
- Tamura Y, Kawaguchi J, Serizawa N, Hirahara K, Shiraishi A, Nigi H, Taniguchi Y, Toda M, Inouye S, Takemori T, Sakaguchi M. Analysis of sequential immunoglobulin E-binding epitope of Japanese cedar pollen allergen (Cry j 2) in humans, monkeys and mice. Clinical and Experimental Allergy. 2003;33:211–217. doi: 10.1046/j.1365-2222.2003.01579.x. [DOI] [PubMed] [Google Scholar]
- Venkatarajan MS, Braun W. New quantitative descriptors of amino acids based on multidimensional scaling of a large number of physical–chemical properties. Journal of Molecular Modeling. 2001;7:445–453. [Google Scholar]
- Weber RW. Cross-reactivity of pollen allergens: recommendations for immunotherapy vaccines. Current Opinion in Allergy and Clinical Immunology. 2005;5:563–569. doi: 10.1097/01.all.0000191240.28255.ab. [DOI] [PubMed] [Google Scholar]
- WHO. World Health Organization; Yokohama: 2003. Joint FAO/WHO food standards programme. Codex ad hoc intergovernmental task force on foods derived from biotechnology. http://www.codexalimentarius.net/ [PubMed] [Google Scholar]
- Yoshioka H, Ohmoto T, Urisu A, Mine Y, Adachi T. Expression and epitope analysis of the major allergenic protein Fag e 1 from buckwheat. Journal of Plant Physiology. 2004;161:761–767. doi: 10.1016/j.jplph.2004.01.010. [DOI] [PubMed] [Google Scholar]


