


Abstract
The identification of small structural motifs and their organization into larger subassemblies is of fundamental interest in the analysis, prediction and design of 3D structures of large RNAs. This problem has been studied only sparsely, as most of the existing work is limited to the characterization and discovery of motifs in RNA secondary structures. We present a novel geometric method for the characterization and identification of structural motifs in 3D rRNA molecules. This method enables the efficient recognition of known 3D motifs, such as tetraloops, E-loops, kink-turns and others. Furthermore, it provides a new way of characterizing complex 3D motifs, notably junctions, that have been defined and identified in the secondary structure but have not been analyzed and classified in three dimensions. We demonstrate the relevance and utility of our approach by applying it to the Haloarcula marismortui large ribosomal unit. Pending the implementation of a dedicated web server, the code accompanying this article, written in JAVA, is available upon request from the contact author.
INTRODUCTION
We present a new method for the characterization and identification of 3D structural motifs in RNA molecules. We demonstrate the utility of this method with a ‘proof of principle’ analysis of loop motifs in the Haloarcula marismortui large ribosomal unit (HM 23S rRNA) (1). We find that our approach works well for identifying small loop motifs in HM 23S. Indeed we are able to efficiently recognize known 3D motifs, such as tetraloops, E-loops, kink-turns and others, which recur throughout the structure. Furthermore, our approach provides a new way of characterizing larger and more complex motifs, notably junctions. Based on their shape histograms, we provide a new classification for the folding of HM 23S branched loops in three dimensions.
RNA folding is hierarchical (2,3). The intermediate states, differentiated by the extent and type of hydrogen bonding and base-stacking interactions, are characterized by their dimensionality. The 1D or primary structure of an RNA molecule is the nucleotide sequence. When this biochemical chain is treated as a string of symbols, the power of sophisticated computational approaches can be harnessed to identify important functional motifs discernible at the sequence level. The 2D structure of an RNA molecule, the secondary structure, is formed by base-pairing interactions. Base-paired helical segments are interspersed and capped by regions called loops. By now, identifying and characterizing loop motifs in RNA secondary structures is a well-studied problem. However, the same problem in three dimensions has received much less attention in the literature, due in part to the limited number of complete high-resolution 3D structures available. We expect that over the coming years high-quality RNA structures will be increasingly available, and we propose a new method for searching and classifying 3D structural motifs in RNA molecules.
Our approach is based on a geometric signature that enables simple characterization and efficient detection of structurally similar 3D fragments. The key idea is to compute a shape histogram (4) for the specified RNA sequence fragments within a small region of 3D space. The shape histogram is the distribution of Euclidean distances for all the atoms in the identified region from a particular point, such as the centroid of the atoms. In this article, we demonstrate that this yields a motif characterization which is distinctive and robust, yet also easy to compute. This approach has the further advantage that the difficult problem of identifying similar 3D motifs reduces to the comparison of two shape histograms. Thus, once we have computed the shape histogram for two 3D structural fragments, the similarity is evaluated based on a distance measure between histograms. In this way, our method addresses the two-stage process of motif finding, first of characterizing a putative motif and then of searching for other such motifs. We find that shape histograms yield both a simple characterization of even complex structures, such as RNA junctions, and efficient methods for identifying other similar structures.
MATERIALS AND METHODS
In this section, we first give a description of the RNA molecule and its substructures that are involved in our analysis, then we provide a detailed description of the shape descriptors we use, of the method to compute them from 3D structural fragments and of different measures of similarity between such descriptors. Finally we show how to use shape histograms to search for and classify structural motifs.
The Haloarcula marismortui large ribosomal subunit
RNA tertiary structure has been less extensively studied with respect to its primary or secondary structure, with the added challenge that prediction of 3D structure is dependent on, and significantly more difficult than, determining the 2D base pairings. Moreover, just as there are hundreds of thousands of annotated ribosomal RNA sequences available, but less than a thousand known rRNA secondary structures determined by covariation analysis, there are currently atomic coordinates available for only four 3D ribosomal structures. The crystal structure of the Haloarcula marismortui large ribosomal subunit (HM 23S - PDBid:1JJ2) have been determined at 2.4 Å resolution (1). HM 23S is composed by 2914 nt, although it is common in macromolecular crystallography for some residues to be disordered in crystal and so unobservable in the experimental electron density. Indeed the available PDB file reports the complete set of 3D coordinates only for 2745 nt. These residues are those we will take into account in our analysis. Although a complex molecule such as the ribosome represents the best testset, our method can be applied to any RNA structure once its atomic positions have been determined.
RNA motifs
Besides base-paired helical regions, RNA structures are typically interspersed by loop regions with characteristic folding and, for some of them, sequence patterns. To distinguish different classes of loop motifs in three dimensions, we adopt the terminology which differentiates types of loops in nested secondary structures. RNA structures in two dimensions are composed of base-paired segments known as helices interspersed with regions called loops. Although loops are considered ‘single-stranded’ in RNA secondary structures, we recognize that nearly all of these nonhelical residues form some type of base–base interactions in the 3D structure. In 2D, however, these loops are distinguished by the number of Waston–Crick or wobble base pairs in the loop which is the same as the number of nonhelical strands within the loop. In the following we introduce some known characteristic loops.
1-loops
A 1-loop or hairpin includes, as the common name suggests, the contiguous fragment of nonhelical RNA which terminates a single helix. An extensively studied 1-loop motif is the tetraloop. A tetraloop is defined as a small loop composed of four residues, connecting the two anti-parallel chains of an RNA helix. Tetraloops show characteristic conformations and stability, and consensus sequence patterns given by GNRA (5,6), UNCG (7,8) and CUUG (9,10), where N can be any nucleotide and R can be either G or A. In (11) three main types of tetraloops are identified: standard, with deletions (where one residue is omitted, e.g. the fourth one in GAA-) and with insertion (where one residue is added, e.g. the fourth in CAG(A)A). A standard tetraloop is in Figure 1a.
Figure 1.

RNA motifs: (a) the standard tetraloop; (b) the π-turn; (c) the Ω-turn; (d) the S2-motif; (e) the E-loop and (f) the kink-turn.
2-loops
Bulges and internal loops are known as 2-loops, which join two helices and so contain a closing base pair, an enclosed base pair, and the two single-stranded segments connecting those two base pairs. Well-known 2-loop motifs are the kink-turn and the E-loop. The kink-turn consists of 15 nt from two distinct segments which base pair to form two helices and an internal loop. A representation of the kink-turn is in Figure 1f. It is an important structural motif since it mediates RNA tertiary structure interactions making significant interactions with bound proteins. Six kink-turns in HM 23S were revealed in (12). An E-loop is generally defined as an asymmetrical internal loop, where the elements of the loop are usually cross-strand paired (13). In our analysis we specifically refer to E-loop as defined in (10), see Figure 1e, sometimes also referred to as core of the E-loop (14). The E-loop bulged strand presents a consensus pattern AUGA.
Particular cases of 2-loops were introduced in (15) and (16): the S2-motif, the π-turn, and the Ω-turn. These motifs differ from the typical 2-loop motifs since they present only one characteristic fragment coupled with a fragment that has neither fixed length nor characteristic shape. We will refer to these motifs as single-strand 2-loop motifs, while to kink-turns and E-loops as double-strand 2-loop motifs. For these motifs we performed a single-strand search as done before for the 1-loops. The S2-motif is an internal loop, similar to the E-loop, composed by a characteristic strand with the base of the bulged nucleotide completely outside the loop usually involved in tertiary interaction (see Figure 1d). The π-turn is defined as a sequence of five consecutive residues forming a pinched strand such that the backbone folds with an angle of ∼120°. Similarly the Ω-turn is a strand composed by five consecutive residues that changes direction twice: first between the second and the third nucleotide (∼180°), then between the fourth and the fifth (∼90°). The resulting bend is of ∼90°, generating the Ω-shaped conformation.
Examples of π-turn and Ω-turn are given in Figure 1b and 1c, respectively.
k-loops
Finally, k-loops for k ≥ 3 are commonly called junctions, multi-branch or branching loops. Again, as the names suggest, junctions are the loop regions where an RNA structure branches and which involves k ≥ 3 helices and k distinct single-stranded segments. Precisely, in a k-junction we consider the ensemble of fragments that connect the terminal base pairs of the helices, including these pairs and ignore, for the purpose of this analysis, the flanking helices. The connecting fragments have variable length and shape, thus they seem to lack common features. In contrast the whole junction region at a lower level of resolution reveals recurrent 3D conformations. Moreover, junctions remain one of the least well-characterized aspects of minimum free-energy RNA secondary structures (17), although recent thermodynamic studies (18,19) are likely to lead to improvements in prediction accuracy.
Computing motif histograms
A shape histogram is computed for a fragment, which we define as a sequence of consecutive nucleotides. The shape histogram is the distribution of Euclidean distances of the atoms of the fragment from a particular point, such as the centroid of the atoms. We show now how to compute the shape histogram as a simple geometric descriptor. First we compute the centroid C with respect to the phosphate (P) atoms of the fragment. Then for each nucleotide of the fragment we compute the distances of all its backbone atoms from the centroid. Since a nucleotide is composed of 12 backbone atoms, i.e. the P atom and 11 atoms of the ribose group, a fragment of k nucleotides will generate 12 × k distances. In Figure 2a and b, we illustrate this computation for a tetraloop producing 4 × 12=48 distance values. Once this set of distances has been computed, we quantize them, with a step size equal to 1 Å (Figure 2c). Finally, we count the occurrences of each quantized value, i.e. its frequency. This results in a histogram vector h [h1,hellip; ,hn], where the component hi is the frequency of the distance value di, denoted hi = f(di), i.e. the number of points/atoms at distance di from the centroid C. Histograms have a natural two dimensional plot such as displayed in Figure 2d. Shape histograms are invariant under rigid geometric transformations, so fragments in arbitrary orientations can be matched without explicitly taking rotations into account.
Figure 2.

Given a RNA fragment (a), we measure the distances of all the backbone atoms from the centroid computed with respect to the phosphate atoms (b), the set of distances are then quantized (c) and the frequency of each quantized value is plotted in a 2D histogram, i.e. the shape histogram (d).
We stress that we consider only the backbone information. The reason behind this choice is that bases are more flexible and often involved in tertiary interaction within the RNA or with proteins, while the backbone has a more conserved 3D structure. This allowed us to find motif instances that otherwise we would have missed. Our search for a query motif within a whole target structure is based on the shape histograms. As we will describe later, the histograms are computed for the query motif as well as for all fragments of the target structure of the same length as the query.
Comparing the histograms
Once the shape histograms have been computed for the 3D fragments under consideration, we have to address the issue of how to compare them in order to produce a similarity measure. Given two histograms h and g we experimented with four similarity measures. All these measures are applied to a pair of histograms, and are intended to evaluate a similarity between them. The simplest measure is the L2 norm or Euclidean distance, that is the sum of squared differences of the components of h and g: 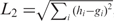 , with i=1,…,n and n the largest index of the nonzero values in the two histograms. The L2 norm can be normalized; in the literature there are different ways of normalizing the Euclidean distance. The one we used is:
 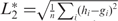 . The third similarity measure is the Pearson correlation coefficient r between two vectors:
 |
1 |
where h and g are the mean values of h and g, respectively. The correlation coefficient ranges from −1 (inverse correlation) to +1 (direct correlation), and 0 means h and g are uncorrelated. Finally we experimented with another measure of similarity between two vectors h and g: the cosine of the angle formed by h and g in the plane they define (Cos). The Cos of h and g is defined as:
| 2 |
When the shape histogram is computed for a loop with more than one strand, the distance values may vary over a wide range, thus the nonzero components in two histograms may have little or no overlap at all. This happens for instance when one loop has two strands close to each other in the 3D space, and the other has strands that are far apart. This fact may affect the value of the Pearson coefficient since two corresponding components with 0 value will positively contribute to the correlation in Equation (1), even if for the purpose of our analysis these components should not be considered in the computation. With respect to the Pearson coefficient, Cos has the additional advantage of taking into account only the nonzero components. Generally, we observed that Cos is the best measure to highly rank the correct motifs instances.
Searching with histograms
The search procedure takes as inputs a query motif and a target structure. It searches for instances of the query motif in the whole target structure. We first consider the case of a query motif that is a 1-loop, i.e it consists of a single strand. This strand is matched against all fragments of the target structure that contain the same number of nucleotides as the query. The detection procedure consists of two steps. In the first step, the 3D similarity of the query with each fragment of the target structure is established based on the similarity of their histograms. The fragments with a similarity exceeding a certain threshold are selected as candidate motifs. On this reduced list a more accurate and costly computation is performed: in the second step, each candidate is superimposed to the query minimizing the root mean square deviation (RMSD) computed among the corresponding backbone atoms. The matching between shape histograms is an essential step in the overall process; indeed if the RMSD was computed on all fragments, and not just on the candidates, a few false positives would be introduced in the results. Thus shape histograms not only speed up the computation but also improve the quality of the results.
For the recognition of the double-stranded 2-loop motif, first the two individual fragments F1 and F2 of the motif are searched into the whole target RNA structure. In other words, each strand of the motif is separately matched with all fragments of the target with the same number of nucleotides as the strand. This search produces two separate lists LF1 and LF2 of candidate matching fragments. It is performed as for the 1-loops with histogram matching and RMSD computation. Then each pair of fragments (C1,C2), C1 ∈ LF1 and C2 ∈ LF2 is matched against the pair (F1, F2) as follows. Two histograms of distances are built, one for the query motif and the second for candidate motif, where each histogram comprises the distances of the backbone atoms of the pair of fragments from its centroid. For the 2-loops a reliable and robust detection is obtained by the use of this simple signature and the RMSD computation is actually not needed. Indeed once the histogram for the query pair of fragments is computed, a candidate pair must have the two strands at approximately the same distance as the query to obtain a good Cos value. This imposes a strict constraint on the pairing of the candidate fragments in LF1 and LF2. As we will see in the next section with a reasonable threshold for the Cos value, we correctly identify all the 2-loop motifs in HM 23S.
In our experiments, queries have been manually selected among the set of known motifs. Where a consensus structure or sequence was available, queries have been chosen as the closest instances to the consensus.
Classifying with histograms
As already pointed out, the shape histogram tool is both simple, i.e able to capture the structure at a low level of resolution, and powerful, i.e. able to identify characteristic structural motifs. Here we investigate the ability of shape histograms to reveal recurrent 3D conformations for more complex structures such as the k-loops (k ≥ 3) or junctions.
These conformations are described by the shape histograms and the sequence of planar angles formed by the set of consecutive fragments of the k-loop. The histogram takes into account the distances from the centroid of the backbone atoms of the whole junction. The angles are those determined by connecting the centroids of consecutive fragments. In more detail, given a k-junction formed by the fragments f1,… ,fk, we connect the centroid ci of the fragment fi with the centroids ci −1 and ci+1 of the fragments fi−1 and fi+1, i=1,… ,k and c0= ck and ck+1 = c1. The three consecutive centroids ci−1, ci, ci+1 determine the angle αi. Note that a sequential order on the fragments is naturally derived from the order of residues of the RNA chain.
We consider first k-junctions with k > 3, in the following denoted as k*-junction; as we discuss in the next section, the case of the 3-junctions needs to be treated separately. The angles induced by triplets of centroids, as defined above, are able to reveal the eccentricity of the junction. If we imagine the junction as a flexible loop it is easy to see that the more this loop resembles a circle, the more uniform will be the angles formed by the centroids. In contrast, if the loop resembles a squeezed ellipse or band, it will generate a set of obtuse angles, along the long sides of the band, and few (2 or 3) small angles at the bends (the two typical cases are shown in Figure 3). Thus from the sequence of inter-fragments angles, we can identify two main conformation: low eccentricity EL which indicates a circular junction and high eccentricity EH which indicates a band. We define also an intermediate state, denoted as EM.
Figure 3.
Angles at the narrow side of the band: (a) if a connecting fragment occurs at the bend, we have a very small angle (∼ 20°/30°), (b) if a helix departs from that side, we have two acute angles (∼ 60°/80°).
Once the angle information is given, shape histograms play a fundamental role in highlighting how the junction is folded in the three-dimensional space. We need to remember that shape histograms have on the x-axis the distance values of the atoms from the centroid of the junction, and on the y-axis the number of atoms of the junction at that distance. The important features of the histograms are the range (i.e. the variability) of the distance values, and the presence of peaks (i.e. the distribution) in the chart.
The observation of range and distribution of values of the histograms allows us to reveal the folding of the junction for the EH and EM types of eccentricity, while a circular junction, EL type, can be only planar since bending a circle in the 3D space would obviously affect its angles. In a later section, we propose a classification for the k*-junctions of HM 23S. The considerations made so far weakly apply to the 3-junctions. As we will see, while the interpretation of the shape histograms to determine the folding generally holds, the correspondence between the sequence of angles and the eccentricity of the junction is less obvious.
RESULTS
Searching with histograms
Tetraloops are important motifs in 3D RNA structures, and many of our searching with histogram results concern the tetraloops of HM 23S. Our simple and completely automated approach was able to recognize standard tetraloops (19 out of 21), tetraloops with insertion (3 out of 3) and tetraloops with deletion (10 out of 10).
The recognition of standard tetraloops in HM 23S was done using a standard tetraloop as query pattern. The tetraloop chosen as query was the GAAA tetraloop starting at position 2412 in HM 23S (position numbering refers to the PDB format), denoted by TL2412, which is an instance of the consensus pattern GNRA. It should be noted that the method obtains the same results using other standard GNRA tetraloops as query. The procedure compared the query tetraloop with all 2742 overlapping fragments of HM 23S of length 4.
With the strict thresholds of TRMSD = 1 Å and TCos = 0.95, we correctly identify the 14 GNRA tetraloops of HM 23S rRNA, without false negatives and two other standard tetraloops which are not GNRA: TL253 (UCAC) and TL1469 (CAAC). In Table 1 we show the results of the overall search algorithm with a less restrictive threshold on the RMSD, TRMSD = 2 Å. All the boldface entries in Table 1 indicate fragments that are standard tetraloops: 19 out of the 21 that were found in (11) are among the top ranked fragments. There are two false negatives: TL734 (UCAA) (Cos = 0.92, RMSD = 1.89 Å), and TL1238 (CGGG) (Cos = 0.97, RMSD = 2.12 Å), which is a nonstandard clipped tetraloop. In TL1238, one of the strands of the helix is not formed by the residues consecutive to the ones of the tetraloop but instead comes from a remote region (11). As reported in Table 1, with TRMSD = 2 Å we obtain eight positive matches besides the standard tetraloops. Only one of these should be considered a false positive; the others are 6 out of the 10 tetraloops with deletion reported in (7) and 1 out of the 3 tetraloops with insertion. Tetraloops with insertion, such as TL1707 which is ranked 18th in the Table 1, usually differ significantly from a standard tetraloop because of the inserted base. As shown in Table 1, this difference in conformation is well detected by the Cos measure. We repeat the same test using two different nonstandard queries: a tetraloop with insertion, TL1276, and a tetraloop with deletion, TL1187. For the insertion case, we obtain the three true positive matches with neither false positives nor false negatives. For the deletion case we correctly identify all the true positives, but we find some false positives among the top ranked (Table 2). With the exception of the fragment starting at position 1967, all the other matches are instances of tetraloops: TL1170 and TL1469 are standard tetraloops, TL1707 has an insertion, TL482 and TL506 have the fourth base switched with the next nucleotide in the sequence. The presence of false positives among the top ranked was not surprising since the three nucleotides in a tetraloop with deletion have high structural similarity with other tetraloops. Note that the column Seq. in both Table 1 and 2 reports the complete sequence of the tetraloop together with its deviations from the standard structure and not the actual compared nucleotides. The number of the compared nucleotides is always the same as the query; thus the first three nucleotides in column Seq. for tetraloops with deletion and the five nucleotides for tetraloops with insertion are those that are matched against the respective queries.
Table 1.
The matching fragments obtained using as query motif a standard tetraloop (TL2412)
| Rank | Frag | RMSD | Cos | Seq. |
|---|---|---|---|---|
| Standard tetraloop | ||||
| 1 | 2412 | 0 | 1 | GAAA |
| 2 | 469 | 0.23 | 0.99 | GUGA |
| 3 | 1794 | 0.28 | 0.99 | GGAA |
| 4 | 577 | 0.29 | 0.99 | GCGA |
| 5 | 2630 | 0.33 | 0.99 | GUGA |
| 6 | 1327 | 0.36 | 0.98 | GAAA |
| 7 | 1055 | 0.43 | 0.99 | GUAA |
| 8 | 691 | 0.56 | 0.99 | GAAA |
| 9 | 253 | 0.63 | 0.98 | UCAC |
| 10 | 2249 | 0.64 | 0.99 | GGGA |
| 11 | 1629 | 0.7 | 0.98 | GAAA |
| 12 | 1863 | 0.72 | 0.97 | GCAA |
| 13 | 2696 | 0.73 | 0.97 | GAGA |
| 14 | 2877 | 0.77 | 0.98 | GUAA |
| 15 | 805 | 0.79 | 0.98 | GAAA |
| 16 | 1469 | 0.82 | 0.99 | CAAC |
| 17 | 1596 | 1.06 | 0.97 | UAA- |
| 18 | 1707 | 1.44 | 0.96 | GCG(A)A |
| 19 | 150 | 1.49 | 0.97 | NaT |
| 20 | 1198 | 1.56 | 0.96 | UAAC |
| 21 | 1500 | 1.72 | 0.98 | UAA- |
| 22 | 1918a | 1.74 | 0.96 | UACA |
| 23 | 2598 | 1.75 | 0.96 | UAA- |
| 24 | 1170 | 1.79 | 0.95 | UAGA |
| 25 | 1809 | 1.82 | 0.98 | GCA- |
| 26 | 1187 | 1.83 | 0.98 | UAA- |
In the table, Rank (column 1) is the rank of the fragment in our 2-step search procedure according to the RMSD (column 3). Recall that the RMSD is only computed for candidate motifs filtered out by the value of Cos (column 4). Note that all the 14 GNRA tetraloops are among the top 15. The true positives are boldface. The notation in Seq. (column 5) denotes the nucleotide sequence and the type of tetraloop: XXXX are standard tetraloop; (X) denotes an inserted base; ‘-’ means a deletion occurs; NaT stands for ‘Not a Tetraloop’.
Despite the fact this tetraloop is classified as standard in (11), it should be considered as a tetraloop with both a deletion and an insertion: U(A)C-.
Table 2.
Results obtained using as a query a tetraloop with deletion (TL1187), and a tetraloop with insertion (TL1276)
| Rank | Frag | RMSD | Cos | Seq. |
|---|---|---|---|---|
| Tetraloop with deletion | ||||
| 1 | 1187 | 0 | 1 | UAA- |
| 2 | 1389 | 1.06 | 0.91 | GAG- |
| 3 | 314 | 1.1 | 0.91 | GGA- |
| 4 | 1500 | 1.12 | 0.95 | UAA- |
| 5 | 1809 | 1.15 | 0.9 | GCA- |
| 6 | 506 | 1.2 | 0.91 |  |
| 7 | 625 | 1.23 | 0.9 | UUG- |
| 8 | 482 | 1.25 | 0.9 |  |
| 9 | 1596 | 1.26 | 0.9 | UAA- |
| 10 | 1707 | 1.36 | 0.91 | GCG(A)A |
| 11 | 1170 | 1.45 | 0.95 | UAGA |
| 12 | 2598 | 1.54 | 0.92 | UAA- |
| 13 | 1992 | 1.61 | 0.91 | UCA- |
| 14 | 1469 | 1.76 | 0.93 | CAAC |
| 15 | 1967 | 1.8 | 0.91 | NaT |
| 16 | 1749 | 1.81 | 0.94 | UCG- |
| Tetraloop with insertion | ||||
| 1 | 1276 | 0 | 1 | UCA(U)A |
| 2 | 1707 | 1.17 | 0.97 | GCG(A)A |
| 3 | 494 | 1.59 | 0.92 | GCG(A)A |
The notation is the same as in Table 1. ‘↔’ indicates that the two bases have been switched in the 3D folding.
Next we searched for the two double-strand 2-loop motifs: the kink-turn and E-loop. We correctly identified all the kink-turns and E-loops of HM 23S without imposing additional constraints on the sequence pattern or on the base-pair types within the motifs. As already pointed out, the RMSD computation is not needed for the 2-loop motifs. For this reason in Table 3 the 2-loop motifs are ranked according to the Cos value; the RMSD is shown for completeness only.
Table 3.
Results for the double-strand 2-loop motifs: the kink-turn and the E-loop
| Rank | Frag | RMSD | Cos |
| Kink-Turn | |||
| 1 | 77/92 | 0 | 1 |
| 2 | 1338/1311 | 1.89 | 0.97 |
| 3 | 936/1025 | 2.89 | 0.95 |
| 4 | 1212/1146 | 1.69 | 0.95 |
| 5 | 1588/1600 | 2.59 | 0.95 |
| 6 | 244/259 | 2.76 | 0.95 |
| E-loop | |||
| 1 | 212/225 | 0 | 1 |
| 2 | 2691/2701 | 0.44 | 0.99 |
| 3 | 174/159 | 0.49 | 0.99 |
| 4 | 587/568 | 0.71 | 0.99 |
| 5 | 1369/2053 | 0.42 | 0.99 |
| 6 | 357/292 | 0.81 | 0.99 |
| 7 | 463/475 | 0.74 | 0.99 |
| 8 | 380/406 | 1.1 | 0.97 |
The notation is the same as in Table 1.
The kink-turn chosen as query is KT77/92, where 77 and 92 are the starting position of the two strands composing the motif. Table 3 shows the six positive matches, the only known kink-turns in HM 23S, found with a threshold TCos = 0.9. It has been shown (20) that HM 23S presents nonstandard kink-turns as well, where the characteristic bulged strand is coupled with two distinct strands instead of a single sequence of consecutive residues. These nonstandard kink-turns are called composite (23), while the standard ones are local. The composite kink-turns (three cases in HM 23S) cannot be found by our method with KT77/92 as query because the search looks for a pair of fragments of the same length as the query's;. To search for composite as well as local kink-turns, we perform a single-strand search using as query only KT92, i.e. the bulged strand of KT77/92, with TCos = 0.9 and TRMSD= 4 Å. The search gives as results the six kink-turns found before, two composite kink-turns and two false positive as reported in Table 4. The false negative is KT2845 (RMSD = 4.89; Cos = 0.91), newly discovered in (20). Despite a decent Cos value, its 3D structure is quite different from the other kink-turns as shown by the high RMSD value. The E-loop selected as query is E212/225 (E212 is the AUGA bulged strand), and the results are shown in Table 3. We correctly identified the eight E-loops of HM 23S with a threshold TCos = 0.95.
Table 4.
Results for the single-strand 2-loop motifs
| Rank | Frag | RMSD | Cos | |
|---|---|---|---|---|
| Kink-Turn (single-strand) | ||||
| 1 | 92 | 0 | 1 | L |
| 2 | 1146 | 1.02 | 0.95 | L |
| 3 | 42 | 1.33 | 0.95 | C |
| 4 | 1600 | 1.61 | 0.94 | L |
| 5 | 1311 | 1.76 | 0.96 | L |
| 6 | 259 | 2.29 | 0.94 | L |
| 7 | 2821 | 2.47 | 0.95 | C |
| 8 | 852 | 3.16 | 0.94 | |
| 9 | 407 | 3.4 | 0.94 | |
| 10 | 1025 | 3.53 | 0.94 | L |
| S2-motif | ||||
| 1 | 892 | 0 | 1 | |
| 2 | 1983 | 0.48 | 0.95 | |
| 3 | 1163 | 1.13 | 0.93 | |
| 4 | 1775 | 1.41 | 0.97 | |
| 5 | 1870a | 1.5 | 0.92 | |
| π-turn | ||||
| 1 | 1873 | 0 | 1 | |
| 2 | 65a | 1.31 | 0.89 | |
| 3 | 451 | 1.44 | 0.83 | |
| 4 | 2847 | 1.58 | 0.76 | |
| 5 | 1854 | 1.75 | 0.85 | |
| Ω-turn | ||||
| 1 | 1416 | 0 | 1 | |
| 2 | 1744 | 0.79 | 0.95 |
L,C denote, respectively, local and composite kink-turns as in (20). The notation is the same as in Table 1.
These motifs were newly discovered by our method.
Finally we searched for the single-strand 2-loop motifs. The results for the S2-motif, the π-turn and the Ω-turn are in Table 4. We used as query the S2-motif corresponding to the fragment starting at position 892 (S892), the π-turn starting at position 1873 (π1873) and the Ω-turn starting at position 1416 (Ω1416). Our method correctly identifies all the S2-motifs, π-turns and Ω-turns in HM 23S with TCos = 0.75 and TRMSD = 2 Å. Thresholds for the analysis presented so far have been determined empirically. However, we expect that once more structures become available, statistical studies will help determine the thresholds in an automatic way.
Classifying with histograms
Here we investigate the ability of shape histograms to characterize more complex 3D motifs such as the k-loops (k ≥ 3) or junctions. We find that shape histograms, in combination with angle sequences, display characteristic features which separate the HM 23S junctions into distinct classes. So far, we have focused on developing our histogram-based classification scheme for k-loops which is described below. Since the number of junctions within each molecule is much lower than other, simpler loop motifs, this method may be most useful for aligning similar junctions between two different but related structures. In future work, we will address the challenge of searching for similar k-loops between two different molecules using this histogram approach.
The shape histograms, together with the sequence of angles formed by connecting the centroids of the fragments, reveal the 3D conformations of the k-loops at a lower level of resolution. We already discussed how such sequences characterize the junction eccentricity so that we can define two cases: high eccentricity, EH, where the junction resembles a band, and low eccentricity, EL, where the junction has a circular conformation. An additional case characterized by a medium eccentricity EM can be identified where a small region is not as eccentric as the rest. However, these cases are rare in HM 23S and they differ only slightly from the EH cases. Furthermore, the range and the distribution of the values of the histograms reveal the folding of the EH or EM junctions (remember that a circular junction cannot be folded).
In HM 23S, we analyzed 10 k*-junctions where k* means k > 3 and 13 3-junctions. We found that all the 10 k*-junctions have an EH, occasionally EM, eccentricity. Among those we observed two main folding conformations: the wrapped band characterized by a small range and the presence of a peak (Figure 5a), and the straight band that presents a more uniform distribution of the histogram values over a wider range of distances (Figure 5b). The most frequent conformation among the k*-junctions of HM 23S is the wrapped band, 7 out 10 junctions have this conformation, while we observed only 3 straight bands.
Figure 5.

Examples of k*-junctions: (a) wrapped band; (b) straight band; (c) semi-wrapped band with a medium-high eccentricity; (d) unbalanced wrapped band (the two peaks are circled); (e) semi-wrapped band with EM eccentricity. Below are examples of 3-junctions: (f) wrapped band; (g) straight band. The colored boxes indicate the small angles on the narrow sides of the band: red, if one small angle occurs green, if two acute angles are formed.
The histogram analysis also revealed two other interesting sub-cases: the unbalanced wrapped band characterized by a non-uniform density of the number of atoms along the band, and the semi-wrapped band where the band is typically folded to form an angle of ∼ 90°. Two of the seven wrapped bands are unbalanced, and two are semi-wrapped. The semi-wrapped band histogram presents a concentrated peak with a lower yet non-negligible tail (Figure 5c). Note that the junction in Figure 5c has a medium–high eccentricity; it presents a small, less eccentric region (circled with a dotted line in Figure 5c). In the unbalanced wrapped band, the non-uniform distribution of the atoms causes the centroid to be closer to the more dense part. The atoms can then be split in two groups such that the atoms of each group are at approximately the same distance from the centroid, but the two groups are at two different distances. This is revealed in the histograms by the relatively small range of distance values and by the presence of two peaks (Figure 5d).
Finally, for the EL eccentricity, the flat circle has all its points/atoms at approximately the same distance. Thus the histogram is characterized by a small range of values and possibly a peak. Interestingly there are not k*-junctions with a flat circle conformation, again highlighting the high eccentricity of the RNA multiway junctions. In Figure 5e we show the only junction with a significant region characterized by a low eccentricity, and a more eccentric region that bends forming an angle of ∼ 90°. For this reason this junction eccentricity can be classified as EM. The semi-wrapped conformation together with the low eccentricity of part of this junction generates a short-range histogram with a small peak over a quite uniform distribution.
Thus, inter-fragment angle sequences allow us to deduce the junction eccentricity. Once this information is given, the observation of range and distribution of the shape histograms are useful to predict the junction folding. Together these data allowed us to derive a possible classification into three main classes: flat circle, straight band and wrapped band. The latter presents two interesting sub-cases: semi-wrapped band and unbalanced wrapped band. Although the results presented so far are mostly observational, we are currently working on a concise measure able to include angles and histograms information towards a completely automated multi-way junctions classification.
As already discussed, the classification made for the k*-junctions only weakly applies to the 3-junctions since we did not find a clear correspondence between the sequence of angles and the eccentricity of the junction. To see this consider the case of three similar angles. In this case, both the circular conformation and the wrapped band are possible. Indeed having only three fragments implies that the centroids of the two fragments at the opposite bends of the band are connected by one of the segments forming the three angles. This produces three similar angles as in the circle conformation (Figure 4).
Figure 4.
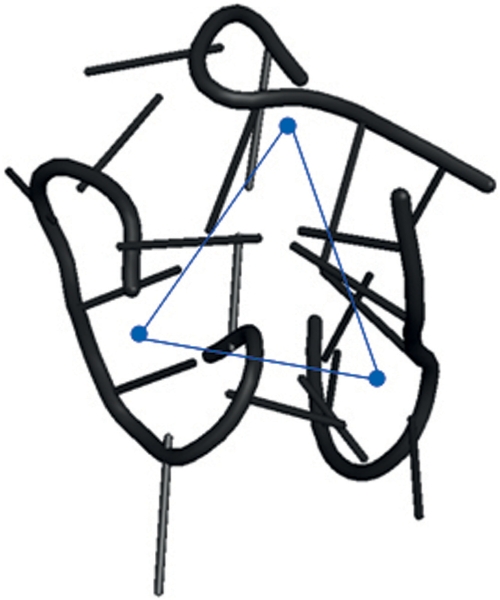
A 3-junction that forms a wrapped band. Note that all angles are similar.
However some of the analyzed 3-junctions, especially the ones comprising more nucleotides, present the characteristic conformations observed before for the k*-junctions and detectable through shape histogram observation. Typical cases are those reported in Figure 5f–g, that are respectively a wrapped band and a straight band.
DISCUSSION
Recent research on RNA 3D structure reveals an interesting trend: when the analysis is performed on a complex and variable structure, such as the ribosome, a coarse level of resolution in the representation of a structure is often preferable to an higher one. A coarser representation not only overcomes the difficulty of recognizing common structural patterns in complex molecules, such as the ribosomes, but also leads to algorithms that are less sensitive to data inaccuracies. The method we presented in this article gives a simple way to look at RNA structure at a coarse level of resolution. It provides an effective tool to search for known structural motifs, and a structural classification for RNA branching loops based on their overall 3D shape. Furthermore, our method makes use of simple geometric descriptors, the shape histograms, that are easy to compute and to compare. This may make our method more efficient by some measure when compared to existing approaches.
Motifs are recurrent sub-structures in the RNA molecule that play a fundamental role as basic building blocks of the RNA architecture (21). For example tetraloops are involved in the folding of RNA molecules and in stabilizing helical stems (11). Kink-turns and E-loops are usually involved in tertiary interaction with proteins, thus they may help in interaction site recognition. We provide here a fast and effective way to extract these motifs from complex RNA molecules, such as those within the ribosomes.
Recently, some approaches have been proposed for the structure comparison and alignment of RNA molecules and for the identification of recurrent 3D motifs (11,14–16, 20–30). It is interesting to compare our method with those that were also tested on HM 23S. All these approaches use a geometric representation of the RNA molecule based on either inter-atom angles or distances or both. In (24), the authors cluster RNA substructures quantizing and comparing the torsion angles that characterize each nucleotide (α, β, γ, δ, ε , ζ and χ). This method revealed 25 tetraloops. A more detailed and complete characterization of the tetraloops in HM 23S was done in (11). The method in (11) decreases the level of resolution by describing the ribosome through the centers of mass and relative orientations of phosphates (P), bases (B) and riboses (R). RNA motifs are then detected by empirically established fingerprints in the PBR space. Using these fingerprints 43 tetraloops were detected and grouped on the basis of their deviations from the standard structure, revealing three main groups: standard tetraloops, 21 instances, tetraloops with insertion, 3 instances, tetraloops with deletion, 10 instances. The remaining nine tetraloops present multiple deviations from the local structure. The method in (11) also incorporates information on molecular interactions, and is aided by visual inspection. In contrast, our method is fully automated and is able to extract all the standard tetraloops, tetraloops with insertion and tetraloops with deletion. Furthermore it automatically distinguishes among different types of tetraloops.
In PRIMOS (15) and COMPADRES (16) a coarse level of resolution is obtained through the use of two pseudo-torsion angles. PRIMOS makes use of single-strand queries composed of consecutive nucleotides, and was tested with two kinds of internal loops: the E-loop where six out of eight were identified on HM 23S, and the S2 motif where three out of four were detected on HM 23S. However, the π-turns and Ω-turns detected in (16) might be classified in alternative groups. For instance, despite a similar 3D conformation, one of the Ω-turns reported in (16) (Ω245) could be considered to be part of the characteristic strand of the kink-turn KT244/259 as identified by (12) and (20), as well as by our method. Similarly the π-turn π408 reported in (16) can be considered to be part of the E-loop E380/406.
A distance-based approach is NASSAM (30) where each nucleotide is represented by the distances between the start and end points of two properly chosen vectors. However, NASSAM still requires strong structural similarity, and it fails to correctly identify motifs such as tetraloops due to the non-unique folding of these motifs.
An effective method to search for RNA motifs is FR3D (20). Here the search for a query motif in a structure is performed by a combination of geometric, symbolic and sequence information. FR3D was tested on tetraloops, kink-turns and E-loops. The search for tetraloops did not consider deviations from the standard structure and it detected only 20 tetraloops. For both E-loops and kink-turns, FR3D proved to be effective at detecting all the instances of these motifs. As already discussed in the previous section we obtain similar results. However, the use of a completely 3D structure-based method and of simple descriptors, i.e. the shape histograms, appears to make our approach more efficient. The tetraloop search with FR3D took 3 s while with our method it took 1 s. The least constrained, i.e. the fastest, search for the E-loop motif performed by FR3D took 5.7 s while our method takes less than a second (∼0.97 s). For the kink-turns, FR3D searches for 6 nt chosen as representatives of the 15 that compose the motif. Two different search strategies were adopted: the first focused on the interaction between the residues and took 14.3 s; the second focused instead on the overall 3D shape and took 154 s (21). In our method both the double-strand search (where 15 nt are considered) and the single-strand search (where 9 nt are considered) are based only on the 3D structure of the motif and they took, respectively, 1.34 s and 1.2 s. It is easy to see that both FR3D and our method have a time complexity that is linear in the size of the input. However, the constants of proportionality in the expression of the time complexity are smaller in our case due to the simplicity of the method. As a result, our execution times are smaller. We note that the time executions of the other methods discussed in this section were not available to us for comparison.
An exhaustive survey on RNA motif characterization and discovery approaches can be found in (31) and (21). A few servers have also recently become available (32–35) that provide various functionalities for the analysis of RNA structures, including alignment, comparison and database search.
As already pointed out, RNA branching loops or junctions are the least well-characterized loop regions of the RNA molecules. To the best of our knowledge, relatively few attempts have been made so far to first characterize and then search for these loops in three dimensions. A database called RNAJunction (36) has been built that contains structure and sequence information for RNA helical junctions including all inter-helical angles. A simple classification for the 3-junctions have been proposed in (37), where junctions are classified based on the length of the connecting fragments. We show that shape histograms together with inter-fragments angles capture the shape of the junction in the 3D space, providing a simple but effective structural classification of these regions. We believe that a structural characterization of the junctions may give good insights into the overall folding of the molecule.
As a final remark, our tests have been conducted on a single ribosome due to the limited availability of high-quality 3D data. However our method can be extended to any new structure.
FUNDING
Scientific Interface from the Burroughs Wellcome Fund (Career Award to C.E.H.); the Italian Ministry of University and Research (FIRB RBIN04BYZ7 to A.A.); the Research Program of Georgia Tech; the University of Padova; and Fondazione Cariparo. Funding for open access charge: University of Padova Research Project CPDA077213/07, and Career Award at Scientific Interface from Burroughs Wellcome Fund.
Conflict of interest statement. None declared.
REFERENCES
- 1.Ban N, Nissen P, Hansen J, Moore PB, Steitz TA. The complete atomic structure of the large ribosomal subunit at 2.4 Å resolution. Science. 2000;289:905–920. doi: 10.1126/science.289.5481.905. [DOI] [PubMed] [Google Scholar]
- 2.Brion P, Westhof E. Hierarchy and dynamics of RNA folding. Annu. Rev. Biophys. Biomol. Struct. 1997;26:113–137. doi: 10.1146/annurev.biophys.26.1.113. [DOI] [PubMed] [Google Scholar]
- 3.Tinoco I, Bustamante C. How RNA folds. J. Mol. Biol. 1999;293:271–281. doi: 10.1006/jmbi.1999.3001. [DOI] [PubMed] [Google Scholar]
- 4.Osada R, Funkhouser T, Chazelle B, Dobkin D. Shape distributions. ACM Trans. Graph. 2002;21:807–832. [Google Scholar]
- 5.Jaeger L, Michel F, Westhof E. Involvement of a GNRA tetraloop in long-range tertiary interactions. J. Mol. Biol. 1994;236:1271–1276. doi: 10.1016/0022-2836(94)90055-8. [DOI] [PubMed] [Google Scholar]
- 6.Correll CC, Swinger K. Common and distinctive features of GNRA tetraloops based on a GUAA tetraloop structure at 1.4 s resolution. RNA. 2003;9:355–363. doi: 10.1261/rna.2147803. [DOI] [PMC free article] [PubMed] [Google Scholar]
- 7.Akke M, Fiala R, Jiang F, Patel D, Palmer AG., IIIrd Base dynamics in a UUCG tetraloop RNA hairpin characterized by 15N spin relaxation: correlations with structure and stability. RNA. 1997;3:702–709. [PMC free article] [PubMed] [Google Scholar]
- 8.Ennifar E, Nikulin A, Tishchenko S, Serganov A, Nevskaya N, Garber M, Ehresmann B, Ehresmann C, Nikonov S, Dumas P. The crystal structure of UUCG tetraloop. J. Mol. Biol. 2000;304:35–42. doi: 10.1006/jmbi.2000.4204. [DOI] [PubMed] [Google Scholar]
- 9.Jucker FM, Pardi A. Solution structure of the CUUG hairpin loop: a novel RNA tetraloop motif. Biochemistry. 1995;34:14416–14427. doi: 10.1021/bi00044a019. [DOI] [PubMed] [Google Scholar]
- 10.Baumruk V, Gouyette C, Huynh-Dinh T, Sun JS, Ghomi M. Comparison between CUUG and UUCG tetraloops: thermodynamic stability and structural features analyzed by UV absorption and vibrational spectroscopy. Nucleic Acids Res. 2001;29:4089–4096. doi: 10.1093/nar/29.19.4089. [DOI] [PMC free article] [PubMed] [Google Scholar]
- 11.Hsiao C, Mohan S, Hershkovitz E, Tannenbaum A, Williams LD. Single nucleotide RNA choreography. Nucleic Acids Res. 2006;34:1481–1491. doi: 10.1093/nar/gkj500. [DOI] [PMC free article] [PubMed] [Google Scholar]
- 12.Klein DJ, Schmeing TM, Moore PB, Steitz TA. The kink-turn: a new RNA secondary structure motif. EMBO J. 2001;20:4214–4221. doi: 10.1093/emboj/20.15.4214. [DOI] [PMC free article] [PubMed] [Google Scholar]
- 13.Leontis NB, Westhof E. A common motif organizes the structure of multi-helix loops in 16 S and 23 S ribosomal RNAs. J. Mol. Biol. 1998;283:571–583. doi: 10.1006/jmbi.1998.2106. [DOI] [PubMed] [Google Scholar]
- 14.Cannone JJ, Subramanian S, Schnare MN, Collett JR, D’Souza LM, Du Y, Feng B, Lin N, Madabusi LV, Müller K, et al. The Comparative RNA Web (CRW) Site: an online database of comparative sequence and structure information for ribosomal, intron, and other RNAs. BMC Bioinformatics. 2002;3:2. doi: 10.1186/1471-2105-3-2. [DOI] [PMC free article] [PubMed] [Google Scholar]
- 15.Duarte CM, Wadley LM, Pyle AM. RNA structure comparison, motif search and discovery using a reduced representation of RNA conformational space. Nucleic Acids Res. 2003;31:4755–4761. doi: 10.1093/nar/gkg682. [DOI] [PMC free article] [PubMed] [Google Scholar]
- 16.Wadley LM, Pyle AM. The identification of novel RNA structural motifs using COMPADRES: an automated approach to structural discovery. Nucleic Acid Res. 2004;32:6650–6659. doi: 10.1093/nar/gkh1002. [DOI] [PMC free article] [PubMed] [Google Scholar]
- 17.Doshi KJ, Cannone JJ, Cobaugh CW, Gutell RR. Evaluation of the suitability of free-energy minimization using nearest-neighbor energy parameters for RNA secondary structure prediction. BMC Bioinformatics. 2004;5:105. doi: 10.1186/1471-2105-5-105. [DOI] [PMC free article] [PubMed] [Google Scholar]
- 18.Diamond JM, Turner DH, Mathews DH. Thermodynamics of three-way multibranch loops in RNA. Biochemistry. 2001;23:40. doi: 10.1021/bi0029548. [DOI] [PubMed] [Google Scholar]
- 19.Mathews DH, Turner DH. Experimentally derived nearest-neighbor parameters for the stability of RNA three- and four-way multibranch loops. Biochemistry. 2002;3:869–880. doi: 10.1021/bi011441d. [DOI] [PubMed] [Google Scholar]
- 20.Sarver M, Zirbel CL, Stombaugh J, Mokdad A, Leontis NB. FR3D: finding local and composite recurrent structural motifs in RNA 3D structures. J. Math. Biol. 2006;56:1–2. doi: 10.1007/s00285-007-0110-x. 215–252. [DOI] [PMC free article] [PubMed] [Google Scholar]
- 21.Leontis NB, Lescoute A, Westhof E. The building blocks and motifs of RNA architecture. Curr. Opin. Struct. Biol. 2006;16:279–287. doi: 10.1016/j.sbi.2006.05.009. [DOI] [PMC free article] [PubMed] [Google Scholar]
- 22.Dror O, Nussinov R, Wolfson H. ARTS: alignment of RNA tertiary structures. Bioinformatics. 2005;21:37. doi: 10.1093/bioinformatics/bti1108. ii47–ii53. [DOI] [PubMed] [Google Scholar]
- 23.Gendron P, Lemieux S, Major F. Quantitative analysis of nucleic acid three-dimensional structures. J. Mol. Biol. 2001;308:919–936. doi: 10.1006/jmbi.2001.4626. [DOI] [PubMed] [Google Scholar]
- 24.Hershkovitz E, Tannenbaum E, Howerton SB, Sheth A, Tannenbaum A, Williams LD. Automated identification of RNA conformational motifs: theory and application to the HM LSU 23S rRNA. Nucleic Acids Res. 2003;31:6249–6257. doi: 10.1093/nar/gkg835. [DOI] [PMC free article] [PubMed] [Google Scholar]
- 25.Lemieux S, Major F. Automated extraction and classification of RNA tertiary structure cyclic motifs. Nucleic Acids Res. 2006;4:2340–2346. doi: 10.1093/nar/gkl120. [DOI] [PMC free article] [PubMed] [Google Scholar]
- 26.Mokdad A, Leontis NB. Ribostral: an RNA 3D alignment analyzer and viewer based on basepair isostericities. Bioinformatics. 2006;22:2168–2170. doi: 10.1093/bioinformatics/btl360. [DOI] [PMC free article] [PubMed] [Google Scholar]
- 27.Murray LJ, Richardson JS, Arendall WB, Richardson DC. RNA backbone rotamers-finding your way in seven dimensions. Biochem. Soc. Trans. 2005;33 (Pt 3):485–487. doi: 10.1042/BST0330485. [DOI] [PubMed] [Google Scholar]
- 28.Tamura M, Hendrix DK, Klosterman PS, Schimmelman NR, Brenner SE, Holbrook SR. Scor: Structural Classification of RNA, Version 2.0. Nucleic Acids Res. 2004;32:182–184. doi: 10.1093/nar/gkh080. [DOI] [PMC free article] [PubMed] [Google Scholar]
- 29.Huang H-C, Nagaswamy U, Fox GE. The application of cluster analysis in the intercomparison of loop structures in RNA. RNA. 2005;11:412–423. doi: 10.1261/rna.7104605. [DOI] [PMC free article] [PubMed] [Google Scholar]
- 30.Harrison A-M, South DR, Willett P, Artymiuk PJ. Representation, searching and discovery of patterns of bases in complex RNA structures. J. Comput.-Aided Mol. Des. 2003;17:537–549. doi: 10.1023/b:jcam.0000004603.15856.32. [DOI] [PubMed] [Google Scholar]
- 31.Leontis NB, Westhof E. Analysis of RNA motifs. Curr. Opin. Struct. Biol. 2003;13:300–308. doi: 10.1016/s0959-440x(03)00076-9. [DOI] [PubMed] [Google Scholar]
- 32.Dror O, Nussinov R, Wolfson HJ. The ARTS web server for aligning RNA tertiary structures. Nucleic Acids Res. 2006;34:W412–W415. doi: 10.1093/nar/gkl312. [DOI] [PMC free article] [PubMed] [Google Scholar]
- 33.Ferré F, Ponty Y, Lorenz WA, Clote P. DIAL: a web server for the pairwise alignment of two RNA three-dimensional structures using nucleotide, dihedral angle and base-pairing similarities. Nucleic Acids Res. 2007;35:W659–W668. doi: 10.1093/nar/gkm334. [DOI] [PMC free article] [PubMed] [Google Scholar]
- 34.Havgaard JH, Lyngso RB, Gorodkin J. The FOLDALIGN web server for pairwise structural RNA alignment and mutual motif search. Nucleic Acids Res. 2005;33:W650–W653. doi: 10.1093/nar/gki473. [DOI] [PMC free article] [PubMed] [Google Scholar]
- 35.Khaladkar M, Bellofatto V, Wang JTL, Tian B, Shapiro BA. RADAR: a web server for RNA data analysis and research. Nucleic Acids Res. 2007;35:W300–W304. doi: 10.1093/nar/gkm253. [DOI] [PMC free article] [PubMed] [Google Scholar]
- 36.Bindewald E, Hayes R, Yingling YG, Kasprzak W, Shapiro BA. RNAJunction: a database of RNA junctions and kissing loops for three-dimensional structural analysis and nanodesign. Nucleic Acids Res. 2007;36:D392–D397. doi: 10.1093/nar/gkm842. [DOI] [PMC free article] [PubMed] [Google Scholar]
- 37.Lescoute A, Westhof E. Topology of three-way junctions in folded RNAs. RNA. 2006;12:83–93. doi: 10.1261/rna.2208106. [DOI] [PMC free article] [PubMed] [Google Scholar]