

Abstract
Our previously reported cDNA array datasets from neonatal wildtype and Cx43−/− mouse brains were further analyzed to identify underlying interlinkages in the brain transcriptome. The analysis revealed that no gene cohort sharing either the primary function or chromosomal location was significantly altered (up- and down regulations were roughly balanced) in Cx43−/− brains, but each cohort exhibited significant perturbation of transcript abundance proportions and reduced expression variability and coordination. By comparing pairwise expression correlations of all genes with one another in wildtype brains, we found genes exhibiting remarkable similarity or opposition to the coordination profile (set of synergistically, antagonistically and independently expressed partners) of Cx43, one of the most similar being pannexin1, a vertebrate homolog of invertebrate gap junction proteins. This study indicates striking redundancy of expression controls over functional pathways and suggests that certain genes may play roles similar or opposite to that of Cx43 in organizing the brain transcriptome.
Keywords: gap junction, Cx43, Panx1, connexin, pannexin
INTRODUCTION
Of the more than twenty gap junction genes in the mammalian genome (for review see [1,2]), the gene encoding connexin43 (Cx43) is among the most highly and ubiquitously expressed by cells in most tissues. It is the most abundant gap junction protein in heart [3], skin [4] and brain [5] where it connects ventricular myocytes, epidermal cells and astrocytes, respectively.
We previously reported that expression level and variability of an enormous number of functionally diverse genes are significantly affected in hearts, brains and cultured astrocytes of Cx43−/− mice [5–12]. Moreover, we identified genes that were coordinately expressed (either synergistically or antagonistically) or statistically independent and found a remarkably high correlation when the lists of coordinated genes in wildtype hearts and brains were compared to those up- or down-regulated in the Cx43−/− tissues. Thus, down- or up-regulation in the Cx43−/− samples was accurately predicted for 81% of the genes significantly synergistically or antagonistically expressed with Cx43 in the wildtype and lack of expression change in the Cx43−/− was accurately predicted for 86% of the independently expressed genes with Cx43 in the wildtype. Overall prediction accuracy increased to 93% when the analysis was restricted to the genes that were both significantly regulated in Cx43−/− and coordinately expressed with Cx43 in the wildtype.
These findings suggest that gene expression alterations in Cx43−/− mice may reflect the extreme of normal patterns of gene expression interlinkage, with the Cx43 gene representing a node in regulation of expression levels of other genes.
We have extended the initial analysis of this large dataset to examine whether expression profile, variability and coordination of disjoint groups of genes in wildtype and Cx43 null brain co-segregated with either chromosomal location or primary function of the encoded protein (hereafter denoted cohorts, see Methods for the description of functional cohorts) and to examine the extent to which other genes displayed coordination patterns of gene expression that were similar or opposite to that of Cx43 in wildtype brain. Our findings from the cohort analysis of the wildtype and Cx43 null brain transcriptomes indicate a complex relationship by which Cx43 is a “command gene” in that it regulates the patterns of expression level, variability and coordination of the brain transcriptome. Moreover, identification of genes with similar or opposite patterns of coordination led to the hypothesis that functional consequences of gene deletion may be partially compensated by up-regulation of a similarly coordinated gene or even down-regulation of an oppositely coordinated gene.
RESULTS
Regulation of expression level of cohorts of genes
We found that no cohort of genes sharing the same chromosomal location (Fig. 1A, open bars), functional category (Fig. 1B) or subcategory (Fig. 1C) was significantly regulated as a whole (up- and down-regulations of individual genes were roughly balanced within each cohort). However, all cohorts were significantly perturbed since the standard deviation (solid bars) approached or exceeded the 1.5 cut-off (even higher values were calculated for chromosome 6 and TWC function). The most highly represented terms in all gene ontology (GO) categories (biological process, molecular function or cellular location) of the regulated genes in Cx43−/− brain are presented in Supplementary Table 1.
Figure 1. Average and standard deviation of the fold change (>1 for up- and < −1 for down-regulation) of cohorts of genes sharing the same chromosomal location (A), category (B) or selected subcategory (C) of function performed by the encoded protein in the Cx43−/− brains.
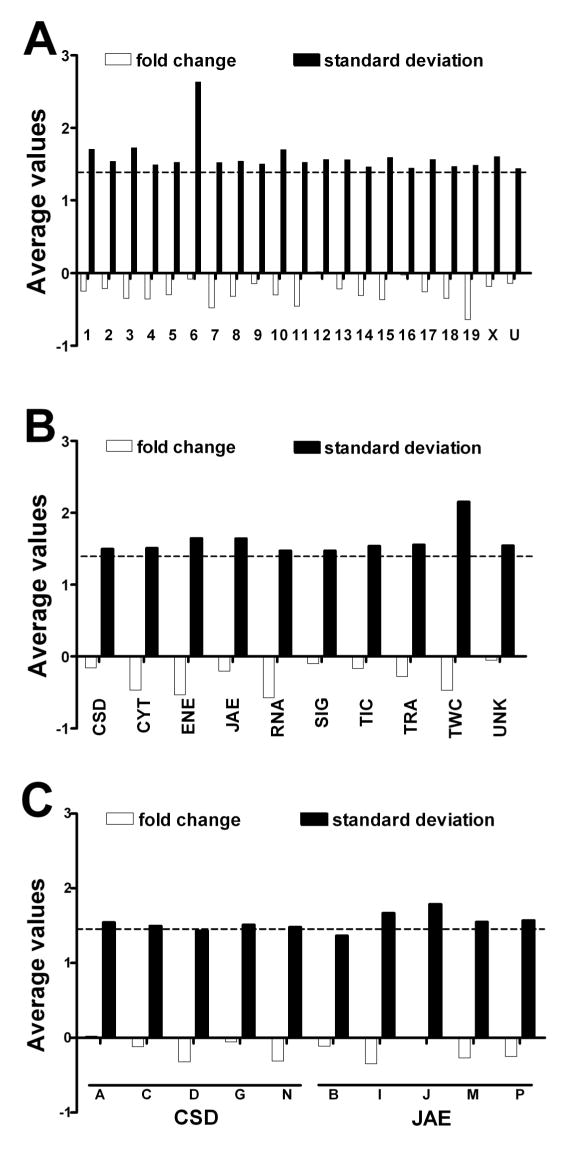
Note that although no cohort grouping genes with the same functional category or chromosomal location was significantly regulated (all absolute average fold changes less than 1.5), the ≥ 1.5 values of the standard deviations indicate considerable perturbation of each functional category (or subcategory) and chromosomal location.
Regulation of expression variability
As illustrated in Figure 2A, expression levels of individual genes were not uniform among the mice of the same genotype. When the Relative Expression Variability (REV) was averaged for gene cohorts, we found close values for all cohorts in each genotype but values were strikingly lower in Cx43−/− brains as compared to wildtype (Figure 2B). Similar observations were valid also for all chromosomal locations (not shown) as well as for functional subcategories (Figure 2C).
Figure 2. Expression variability. A. Expression heatmap of 22 JAE-J genes.
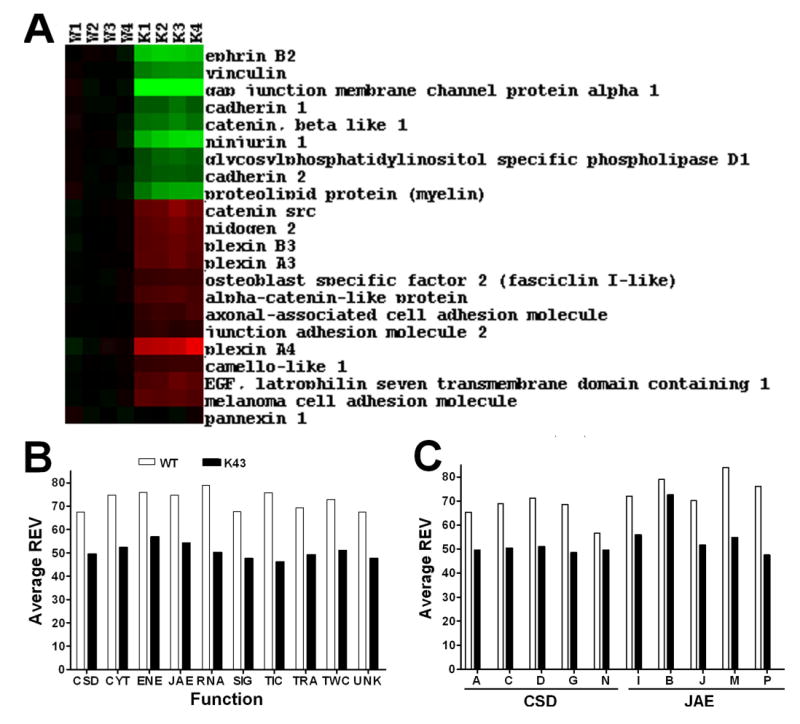
Red/green color of each rectangle represents up-/down-regulation of the gene labeling the raw (right side panel) in the brain of the mouse indicated by the column label (e.g. K1 = Cx43−/− mouse #1) as respect to the average expression level in the wildtype. Note both the biological variability (different nuances) and the reproducibility (similar colors) of the expression profile among the animals of the same genotype. B. Average Relative Expression Variability of functional classes. Note the reduction of variability in all classes for Cx43−/− the brains of genetically manipulated mice. C. Average Relative Expression Variability of some CSD and JAE subclasses. Note the higher variability of JAE-G (globulins and blood) and JAE-A (antigens and integrins).
The uniformity of cohort average REV values led to the uniformity of Gene Expression Stability (GES) among functional categories and subcategories and with respect to chromosomal locations (data not shown) in both genotypes, indicating that no cohort was favored as transcription control and that the hierarchy of transcription control was not altered by disrupting expression of Cx43.
GenMapp analysis of the most stably expressed genes (GES > 95) in wildtype revealed participation in protein transport (z = 3.44), UDP-glycosyltransferase activity (z = 4.42), osteoblast and monocyte differentiation factors (z = 6.00), carboxypeptidase activity (z = 4.89), and negative regulation of cell cycle. Categories of most unstably expressed genes (GES < 5) included cytoskeleton (z = 3.36) and terms related to hydrogen ion transporter activity (z = 2.99). By contrast, in Cx43−/− brains, most stable genes were in categories of cysteine protease inhibition, phosphoinositide 3 kinase, proton transporter ATPase and cell junction, whereas most unstable genes were involved in glycolysis, lyase activity, oxidative metabolism, hexose metabolism and complement activation.
Overall properties of pairwise gene expression coordination in wildtype, Cx43−/− and Cx43+/− brains
The Pearson correlation analysis of all (>13 million) distinct pairs that can be formed with the 3730 selected genes in both genotypes revealed the complexity of the expression coordination within the brain transcriptome. Figure 3A-C presents the histograms of the percentages of significantly independent, antagonistic and synergistic pairs that were found for each quantified distinct gene in the wildtype brain. As indicated in these histograms (arrows), the average gene was found to be synergistically expressed with 9.7% of all other genes, antagonistically expressed with 8.8% and independently expressed with 6.7%. We previously reported that Cx43 is synergistically expressed with 11.7% of the genes, antagonistically expressed with 7.5% and independently expressed with 4.0% [5] of the other genes in the wildtype brain (examples of genes synergistically or antagonistically expressed with Cx43 in the wildtype brain are presented in Supplementary Figure 1A). In comparison to the sampled transcriptome, Cx43 is in the 62.3th percentile with regard to number of synergistic pairs formed, in the 38.6th percentile with regard to antagonistic pairs and in the 16.4th percentile with regard to independent pairs.
Figure 3. Histograms of synergistic, antagonistic and independent pairs that can be formed with the selected 3730 genes in the brains of wildtype (A) and in Cx43−/− (B) mouse.
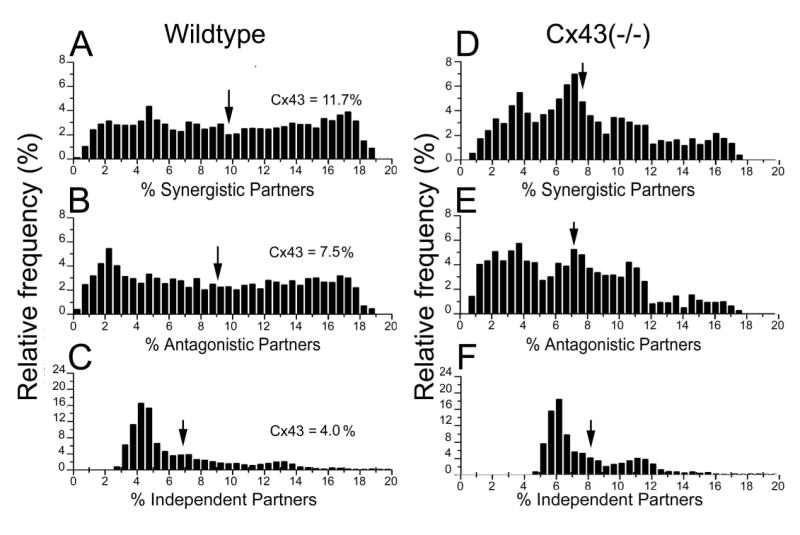
Note the percent of synergistic, antagonistic and independent partners of Cx43 in each genotype (indicated by arrows in A, B, C) as compared to the mean percents of the rest of the genes.
In the Cx43−/− brain, the analysis revealed a shift in the histograms with regard to significant synergistic, antagonistic and independent expression correlations for gene pairs. As illustrated in Figure 3D-F, the average number of synergistic pairs was reduced to 7.9% of the total and antagonistic to 7.1%. Conversely, the number of independent partners was increased to 8.1%.
In order to determine whether there was a relationship between the variability in a gene’s expression level and the degree of expression coordination of that gene with all others, we plotted the change in both parameters in Cx43 null brains as a function of each other. This graph indicated a proportional reduction of the coordination degrees to that of the expression variability, as shown in Figure 4. The slope of the linear regression curve was significantly (p>0.0001) different from zero, indicating a monotonic positive relationship between coordination degree and expression variability.
Figure 4. Change of Relative Estimated Variability plotted against change of coordination percent when comparing Cx43−/− and wildtype brains.
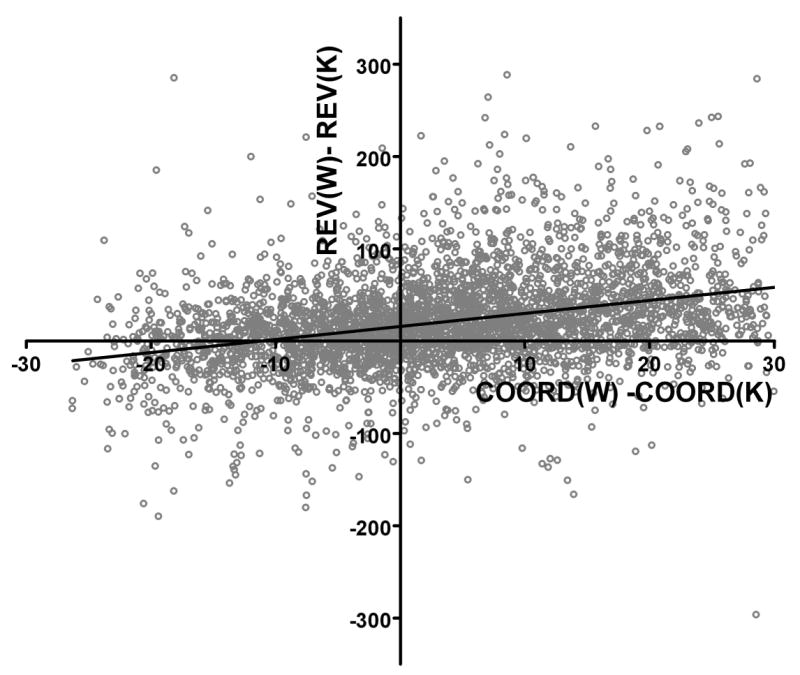
Note the significant proportionality between reduction of (synergistic + antagonistic) expression coordination and reduction of expression variability. The slope of the linear regression curve of significantly (p < 0.0001) non-zero.
The average percent of coordination partners of Cx43 was not uniform among cohorts (Supplementary Figure 1B), the highest percent of synergistic partners being with RNA genes, that of antagonistic partners with CSD genes and that of independent partners with TRA genes. For all cohorts but CSD, the percentage of synergistic partners was higher than that of antagonistic partners. In addition, each cohort contained both genes coordinately expressed with more than 30% of the sampled transcriptome and genes coordinately expressed with fewer than 2% of other genes (representative examples for CSD and JAE subcategories in Supplementary Table 2).
As previously reported [5–11] and illustrated in Supplementary Figure 1C, the coordination analysis in the wildtype brain has a remarkable predictive power of expression regulation in Cx43 null brain. Supplementary Table 3 presents examples of synergistic, antagonistic and independent CSD partners of Gja1 in wildtype brain whose regulation type in Cx43 null brain was accurately predicted by their correlation with Gja1 in wildtype brain.
More detailed analysis revealed that genes synergistically expressed in wildtype were significantly more likely to be similarly regulated in Cx43−/− brains and that genes antagonistically expressed in wildtype were significantly more likely to be oppositely regulated in Cx43−/−. Examples are shown in Supplementary Figure 1D for significantly regulated JAE-J genes in Cx43−/−, where the 57 out of 62 (i.e. 91.2%) significant synergistic and antagonistic coordinations in the wildtype brain accurately predicted the similar or opposite regulations in the Cx43−/− brain.
Genes with similar, neutral and opposite coordination profiles
The extensive expression coordination revealed by our analysis raised the question of whether there might be similarities among the coordination profiles of various genes. To examine this issue, we computed a similarity score (see Mthods), where two genes were considered as having similar coordination profiles when there was significant overlap of their synergistically, antagonistically and independently expressed partners; genes were considered as having opposite coordination profiles when most of the synergistically expressed partners of one gene were antagonistically expressed partners for the other and most of the independently expressed partners of one gene were synergistically or antagonistically expressed for the other. These similarity scores revealed that virtually all genes with similar coordination profiles were synergistically expressed among themselves and all genes with opposite coordination profiles were antagonistically expressed among themselves. As expected, the average similarity of the coordination profiles of the 3729 selected genes with Cx43 was in the neutral range (2.7%).
With regard to Cx43, we identified 128 genes that displayed strikingly similar and 44 with strikingly opposite profiles in wildtype brain (listed in Supplementary Tables 4 and 5), which were distributed in all functional cohorts except TIC. Figure 5 presents examples of CSD, JAE and TRA genes with similar, neutral and opposite coordination profiles to that of Cx43 in the wildtype brain. It is interesting to note from this figure that for genes with similar and opposite coordination profiles the proportionality between Pearson coefficients with other genes extended through the entire range of these coefficients. Surprisingly, 86% of the genes with similar or opposite coordination profile to Cx43 in the wildtype brain were not regulated in the Cx43 null brain, even though each of these genes was synergistically or antagonistically expressed with Cx43 in the wildtype brain. These findings suggest the existence of multiple and independently regulated controllers serving to maintain integrity of specific functional pathways, in contrast to an alternative hypothesis that the genes with similar or opposite coordination profiles are up- or downstream from each other.
Figure 5. Examples of CSD, JAE and TRA genes with similar (A, B, C), opposite (D, E, F) and neutral (G, H, I) coordination profile to Cx43 in WT brains.
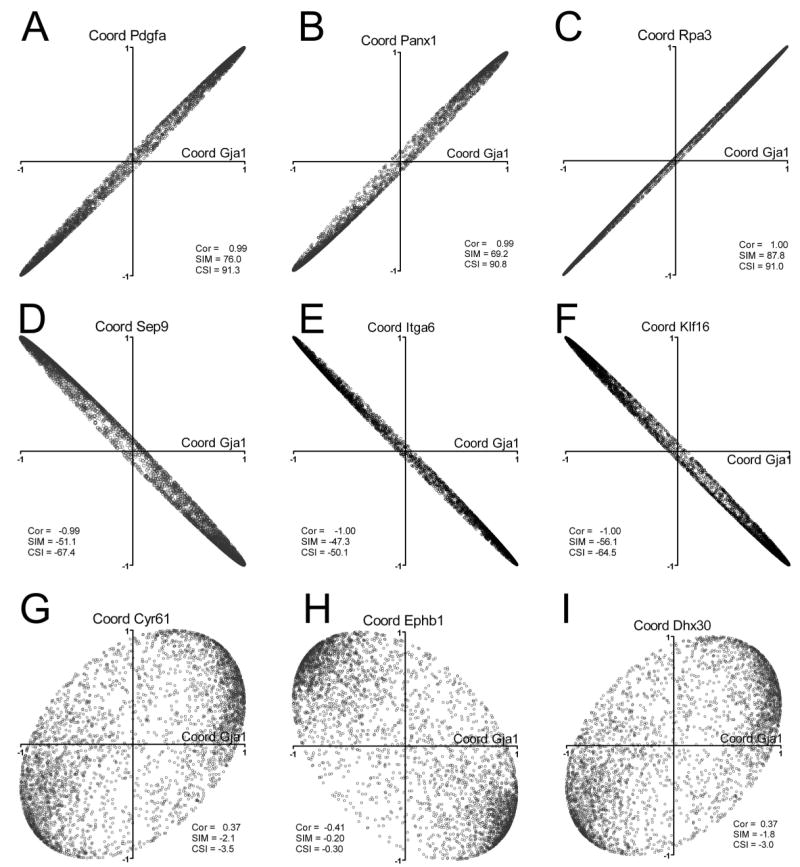
Correlation coefficients of the indicated gene, i.e.: platelet derived growth factor alpha (Pdgfa), pannexin1 (Panx1), replication protein A3 (Rpa3), septin 9 (Sep9), integrin alpha 6 (Itga6), Kruppel-like factor 16 (Klf16), cysteine rich protein 61 (Cyr61), Eph receptor B1 (Ephb1), and DEAH (Asp-Glu-Ala-His) box polypeptide 30 (Dhx30) with each other of the 3730-1 selected genes were plotted against correlation coefficients of connexin43 (Gja1) with the other genes. “Cor” is the Pearson correlation coefficient (ρ) of the relative expression levels of the considered gene and Cx43, while “SIM” and “CSI” are the similarity and the condition similarity scores of the coordination profiles of the considered gene and Cx43 in the wildtype brain Note that all genes with similar coordination profile (CSI>50) were synergistically expressed with Cx43 (Cor>0.9) and all with opposite coordination profile (CSI < − 50) were antagonistically expressed with Cx43 (Cor < −0.9) in the wildtype brain. Genes with neutral coordination profiles when compared to that of Cx43 (|CSI| < 10) were not significantly coordinated (|ρ| < 0.9) with Cx43 in wildtype brain.
The similarity or opposition of comparison of coordination profiles is statistically significant; for instance, pannexin1 (Panx1, CSI = 90.8) shares 287 (97%) of the 296 antagonistic, 454 (95%) of the 478 synergistic and 108 (68%) of the 160 independent partners of Cx43 in the wildtype brain, while 267 (90%) of the antagonistic partners of Cx43 are synergistic partners to paired immunoglobin-like type 2 receptor alpha (Pilra, CSI = −68.7) and 436 (91%) of the synergistic partners of Cx43 are antagonistic partners to Pilra.
Expression coordination among functional cohorts
We found similar percentages of coordinated pairs in all functional categories in both genotypes, even though the overall degree of coordination was significantly lower in Cx43−/− brains. Remarkably, although coordination of gene cohorts with Cx43 was not uniform among the categories, the synergism, antagonism and independence among both homogeneous (e.g.: CSD:CSD) and heterogeneous (e.g.: CSD:CYT) pairs of functional categories was rather uniform. Figure 6 presents the percentages of synergistic, antagonistic and independent pairs formed when considering all genes from any two functional categories in wildtype and Cx43−/− brains.
Figure 6. Percentages of gene expression intercoordinations among functional categories in wildtype and Cx43 null mouse brain.
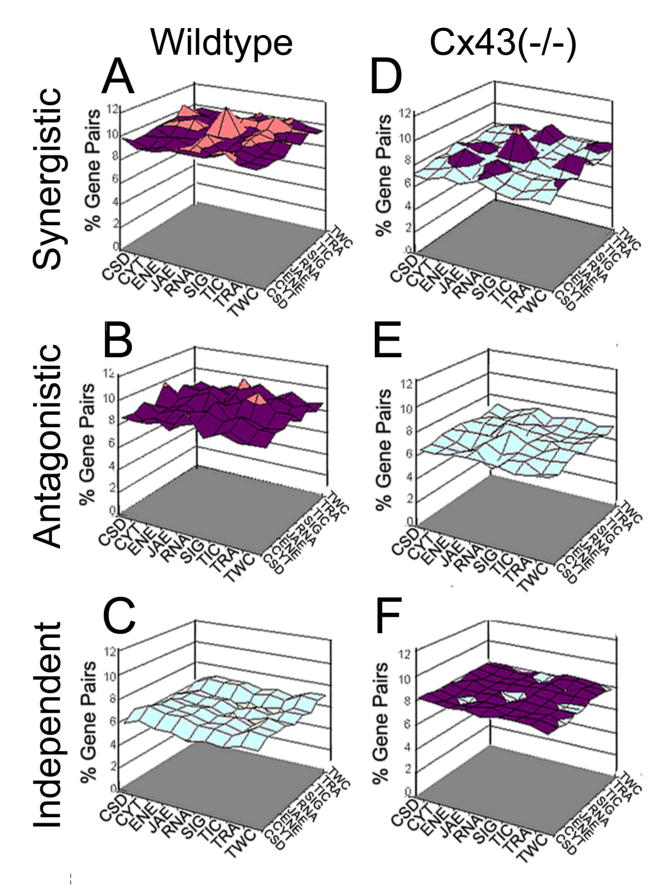
Note the uniformity of synergism, antagonism and independence among pairs of functional categories in both wildtype and Cx43−/− brains, the robust reduction of synergism and antagonism and the increase of independence among pairs of functional categories in the Cx43−/− brain. Pseudocolors correspond to z-axis values.
This finding of uniform coordination percentages between functional cohorts indicates that overall effects on the transcriptome are balanced, rather than directed at one or another function. However, significant reduction of synergism and antagonism and increase of independence appear for all pairs when comparing Cx43−/− brain with wildtype brain, suggesting that disruption of Cx43 had a considerable decoupling effect not only at the level of the average individual gene (as shown above) but for each of the functional categories as well.
Gene dominance
The “dominance” (DOM, see Methods) of each gene was computed to establish a hierarchy with regard to its resistance to expression alteration under the pressure of expression coordination with other genes. Higher positive DOM values (up to 100) indicate the “dominant” genes that were coordinately expressed with higher numbers of other genes yet maintaining low variability, while higher negative DOM values (up to −100) indicate more “dominated” genes that although with fewer coordinations showed high expression variability. Supplementary Table 6 presents the 25 most dominant and 25 most dominated genes of the selection in the wildtype brain (and the dominance of Cx43 for reference). Cx43 was within the 64th percentile (with the most dominant gene, here WW domain-containing protein 1 in the 100th percentile) in the wildtype. Disruption of Cx43 changed overall hierarchy of dominance, and in several cases (e.g.: proteaseome (prosome, macropain) 28 subunit 3, NIMA (never in mitosis gene a)-related expressed kinase 2, Mblk1-related protein-1, or cytochrome P450-family 11-subfamily a-polypeptide 1) even converted the genes between being highly dominant and highly dominated.
Discussion
The function of gap junction proteins is generally believed to be in the formation of intercellular channels through which ions and signaling molecules can diffuse between cells. For many of the twenty or so mammalian gap junctions (connexin) genes, both mutations causing human disease are known and mouse mutants and knockout models exist. Although “phenotypes” of connexin null mice have been almost exclusively interpreted in the context of compromised intercellular communication in tissues where the individual connexins are expressed, data reported in this paper and in our previous studies [5–12] indicate large-scale global transcriptomic alterations in Cx43 null cells and tissues.
Findings from the analysis of expression level
Continuing a previous report showing a very large number of significantly regulated genes in Cx43−/− brain [5], we found that ablation of Cx43 did not significantly underexpress or overexpress an entire cohort of genes sharing either the primary function of the encoded protein or chromosomal location. Instead, Cx43 deficiency significantly perturbed the "stoichiometry" of transcripts within functional pathways due to altered proportions of transcript abundances. Presumably, these “stoichiometric” changes contribute to phenotype modifications in Cx43−/− mice, including alterations in migration of neural crest cells [13,14] and of neural progenitors at certain time points in brain development [15], changes in purinergic receptor expression [16], innervation of the heart [10], and proliferation of astrocytes [17].
Findings of the analysis of expression variability
In previous papers [5–11], we reported existence of very stably and very unstably expressed genes among animals. Other authors suggested that important information is contained in the "gene expression noise" [18,19] originated in the stochastic nature of the biochemical reactions of gene expression that provides targets for evolutionary change [20]. We have interpreted the wide expression variability of certain genes as favoring environmental adaptation, while the tight control of the expression of others (resulting in a small variability) as essential to ensure cell survival and to preserve the phenotype. Remarkably, in all our studies on various tissues of genetically manipulated mice (Cx43 null heart: [10, 11], Cx32 null, Cx43 null and Cx43+/− brains: [5]), as well as in tissues of mice subjected to various major stresses (chronically constant and intermittent hypoxic heart [21] and kidney: [22], we found a significant reduction of expression variability. Presumably, such reduced expression variability represents a compensatory mechanism to limit phenotypic change.
Extending the expression variability analysis to gene cohorts we observed similar average REV values among cohorts in both genotypes but significant reduction of cohort REV in Cx43−/−. The robust smaller cohort variability observed for the Cx43−/− brains (as well as for Cx43+/− brain, not shown) as compared to wildtype brains indicates a higher control in the altered genotypes presumably to limit transcription damages at the cohort level. Another remarkable finding is the uniformity of the cohort GES scores, suggesting that the transcript abundance control itself is uniform although there are major differences among the genes composing each cohort (e.g.: [11]). The non-significant change of cohort GESs in Cx43−/− brains as compared to wildtype indicates that the hierarchy of expression stability is preserved even though overall variability is reduced.
Overall properties of gene expression coordination
Recent studies (e.g.: [23]) have revealed the wide extent and dynamic nature of gene expression networks. Almost 1300 genes with 10 or more links (termed “interacting modules”) were identified in yeast, C. elegans, drosophila and man (e.g.: [24,25]). Calvano et al., [26] computed an interactome for mammalian (human, rat, mouse) genes in which genes on average had 11.5 interaction partners (median 4.0) with 7.2 being direct physical interactions (median 3.0). Our study indicates that such interlinkage is much more extensive in the mouse brain, with certain genes coordinately expressed with over one third of the sampled genome, the average gene being significantly coordinated with the expression of 18.5% (median 17.8%) of the other genes. Cx43 is in the midrange as percentage of coordinately (synergistically + antagonistically) expressed partners within the selection of 3730 genes and has a low number of independently expressed partners. Together with the observation that disruption of Cx43 significantly decreased the overall expression correlation of genes, these findings indicate a complex role of Cx43 in regulating functional pathways. The change in number of coordination partners for each gene in the Cx43−/− with respect to wildtype brain is linearly related to the change in REV from wildtype to Cx43−/− (Fig. 4), suggesting a possible linkage between the control exerted over expression level of a given gene and its coordination with other genes.
2). Genes with similar and opposite coordination profiles
Examination of the functional categories and gene ontology classification for the most similar and most opposite coordinated profiles with respect to Cx43 indicates that these genes encode proteins spanning a wide functional range. However, it is perhaps worthwhile to note that 10 of these genes are either involved in the processes of cell or substrate adhesion or are transmembrane domain proteins believed to be involved in forming signaling complexes at the cell surface. Interestingly, the constituent of lipid rafts, caveolin, displaying a high degree of similarity with Cx43, has been reported to interact with Cx43 [27]. Cell cycle studies of yeast Saccharomyces cerevisiae provided evidence “that genes with similar expression profiles are more likely to encode interacting proteins” [28]; the present results indicate that such a relationship may exist in the mammalian brain as well. As more extensive data sets for Cx43-interacting proteins become available (see [29]), it will be possible to evaluate this hypothesis.
A particularly intriguing high degree of similarity was observed between the coordination profiles of Cx43 and pannexin1 (Panx1). Although these proteins have very different amino acid sequences, they have similar tetra-transmembrane topology, and it has recently been proposed that the pannexins are vertebrate homologues of the gap junction proteins of invertebrates, the innexins (see [30,31]). Both Panx1 and Cx43 are widely distributed in the brain [32] and both have been speculated to form both intercellular and non-junctional channels [33–36].
Our finding that genes with highly similar or opposite coordination profiles in wildtype brain tend not be regulated in the Cx43−/− brain indicates that these interaction networks are parallel rather than serial processes. It is possible that such parallel coordination profiles play a major role in the process of “proof-reading”, to insure that individual gene expression alterations have minimal impact on the entire transcriptome. The parallel nature of these interaction networks also allows speculation that up-regulation of a gene with highly similar coordination profile or down-regulation of a gene with opposite coordination profile might partially restore wildtype phenotype in conditions where one gene’s expression is reduced. It was recently reported that over-expression of Cx43 alters the mutant phenotype of midgestational Wnt-1 null mice, resulting in recovery of the midbrain and cerebellum [14]. In the context of our evaluation of parallel networks, we would hypothesize that the basis for such compensation might include the regulation of genes coordinately expressed by Wnt-1 and Cx43, perhaps linked through beta catenin [37].
3). Coordination within cohorts
In the wildtype brain, GenMapp analysis indicated that the categories of genes with highest numbers of synergistic partners were those involved in cellular catabolism, glycolysis, protein kinase activation and RNA binding, while the highest numbers of antagonistic partners occurred for genes with kinase activity, transferase activity, protein metabolism (especially of hormones), and TGFβ and Wnt signaling. The most independent genes were those related to ligase activity, bone mineralization, N-linked glycosylation, amino acid catabolism, negative regulation of development, carbohydrate binding and signal transduction. In Cx43 null brain, categories of most synergistic genes included the ribonucleoprotein complex, protein biosynthesis, signal transducer activity, chromatin and pericentriolar material and aminoacid biosynthesis, most antagonistic genes encode nucleotide excision repair T helper 2 immune response, male gamete generation, pyrimidine metabolism, cell migration and TGFβ binding, while most independent genes encode collagen, negative regulation of transcripts, protein kinase activation, ubiquitin, cellular lipid metabolism, neurite morphogenesis and mitochondrial electron transport.
4). Expression coordination predicts expression regulation
Because Cx43 is down-regulated under a variety of pathological conditions (see [38]), it is expected that these disease states will be found to share patterns of gene regulation seen in Cx43 null mice. To our knowledge, our studies are the first to use pair-wise coordination analysis of wildtype expression patterns to predict transcriptomic changes resulting from gene deletion in mice, although Pearson’s coefficients were used to identify such linkages in simpler organisms [39,40]. Findings from such analyses in S. cervisiae and C. elegans include identification of “relevance networks” in gene-gene linkages [40], corresponding to “hub nodes” in protein-protein interaction networks or “interactomes” [41,42]. These “hub nodes” were more likely to be essential proteins [41], and genes encoding proteins involved in similar processes tended to be regulated coordinately [40].
As in the case of Cx43 null heart [7,9,10], the coordination analysis confirmed its predictive power, suggesting that the null genotype is primarily amplifying the normally occurring pattern of interdependent gene expression. Extending the analysis to all gene pairs, we have robustly found that co-expression in control/physiological state predicts co-regulation in experimental/pathological state presumably because the coordinately expressed genes concur to various functional pathways. However, the large number of genes regulated in Cx43 null tissues most likely results not only from the absence of Cx43 from the networks it which it normally participates but also from alterations in other networks due to interlinkages.
5). Expression coordination among functional cohorts
The uniformity of inter-cohort coordination indicates that each cohort is equally involved in modulating the expression profile of each other cohort. Remarkably, the uniformity of inter-cohort coordination was maintained in Cx43−/−. Another striking robust effect is that ablation of Cx43 uniformly decreased the percentages of inter-cohort expression synergism and antagonism and uniformly increased the percentage of inter-cohort expression independence, indicating that the role of Cx43 in coordinating gene expressions is extended to large groups of functionally similar genes.
Gene dominance
We introduced a score to quantify the influence of expression coordination on gene’s expression stability. Thus, genes succeeding to be stably expressed in spite of their high degree of coordination with the other genes of the sample were considered as dominant while genes with low expression stability although less coordinately expressed with the other genes of the sample were categorized as dominated. This calculation revealed that protein kinases (e.g. Rock2, Nucks, Nek2, Cdk2, Plaur, Pip5k3, Cks1) were highly represented in the 50 most dominant genes (7/50); in addition, a phosphatase (Mtmr1) was among the most dominated genes. It has been speculated that protein kinase activity, in particular that of MAP kinases, is among the most ancient and robust signaling systems [43]; it is generally believed that the protein kinases (and phosphatases) are mainly involved in post-translational processing. Eleven JAE genes were ranked in the highly 50 dominated genes with Purinergic receptor P2X, ligand-gated ion channel 4 (P2rx4) as the most dominated gene in the wildtype brain.
Dominance hierarchy was dramatically altered in the Cx43−/− brains. A major cause for this change was the significant decrease in coordinated (and increase in independent) expression that we observed in these genotypes, with uniform decoupling in cohorts but wide ranges of effects on individual genes. One remarkable example of such a change is that of P2rx4, which in wildtype brain was highly dominated (SYN = 1%, ANT = 1.2%, IND = 18%) but in Cx43−/− brain became a dominant gene. It is interesting in this regard that P2 receptor expression is altered in Cx43−/− astrocytes [45–47] and in response to IL1β treatment, which reduces Cx43 [48], thereby largely compensating for alterations in Ca2+ wave propagation [49]. An opposite example is that of Nek2 protein kinase: a novel regulator of centrosome structure [50] that from dominant (DOM = 84.2) in wildtype became dominated in Cx43−/− brain (DOM = −43.7).
Although the dominance analysis is a new tool for transcriptomic analysis, we expect that extension to tissues under normal and pathological conditions may reveal new aspects of gene expression networks. Identification of the genes with high transcription control and large impact on the expression of other genes in physiological conditions might be essential for understanding the regulation pattern under pathological conditions and for developing and predicting the effects of novel gene therapies.
Overall conclusion
Together, the findings reported here suggest a model in which the transcriptome is organized in parallel hierarchical modules of coordinatelly expressed genes that are also coordinated among themselves, thereby regulating and stabilizing the overall transcriptome. We propose that such a network of networks not only serves to limit major alterations in functional pathways, but also compensates for changes that can occur under extreme conditions, optimizing the transcriptome for both flexibility and functional preservation.
MATERIALS AND METHODS
Data set
We further analyzed previously reported data [5] obtained through an experiment in which 27k AECOM mouse cDNA microarrays (http://microarray1k.aecom.yu.edu) were used to compare the brain trancriptomes of four neonatal wildtype and four Cx43−/− C57BL/6j mice from the same litters through an in-house prepared universal mouse RNA reference [10]. Data used in this study were deposited in the National Center for Biotechnology Information Gene Expression Omnibus database (http://www.ncbi.nlm.nih.gov/geo, series GSE1954, samples GSM34855, 34858–34860, 34869–34872). The study was performed on newborn animals because Cx43 null mice do not survive long after birth; offspring genotype was screened by PCR of tail DNA [5], and Gja1 level was close to the detection limit in Cx43−/− brains.
Data analysis
The valid spots in all arrays were organized into “redundancy groups” (RGs), each group probing a distinct gene. The expression ratio of a gene in Cx43−/− or Cx43+/− brains as compared to wildtype was the weighted average of the expression ratios within its RG [5], with a p-value derived from Bonferroni adjusted t-test [10]. Finally, 3,730 distinct genes were selected to be further analyzed in both genotypes. The average ratios between the normalized background-subtracted fluorescence signals [51,52] in the two channels for each RG were further used to analyze the expression variability and coordination.
In addition to using GenMapp and MappFinder software (www.genmapp.org) to relate the significantly regulated (or, as also evaluated here, the very stably/unstably expressed, or synergistically/antagonistically/independently expressed) genes to overlapping functional and structural pathways, we analyzed the characteristics and intercoordination of disjoint cohorts of genes sharing either the same chromosomal location or primary function of the encoding proteins, as an approach for finding patterns in data [53]. Following a previously published scheme, we considered the functional cohorts: CSD = Cell cycle, shape, differentiation, death, CYT = cytoskeleton, ENE = Energy metabolism, JAE = Cell junction, Adhesion, Extracellular matrix, RNA = RNA Processing, SIG = Cell Signaling, TIC = transport of small molecules and ions into the cells, TRA = Transcription, TWC = transport of ions/molecules within the cells, UNK = function not yet assigned. In addition, we used the following subcategories of CSD genes: A = apoptosis, C = cell cycle, D = development, differentiation, organogenesis, G = growth factors, hormones, cytokines, N = oncogenes, S = shape, and JAE genes: B = globulins and blood, I = antigens, integrins, J = junction and associated proteins, M = extracellular matrix, laminin, P = proteases (such as metalloproteinases).
The Relative Expression Variability (REV) and the Gene Expression Stability (GES) were determined as previously described [5] for each quantified gene then averaged for each cohort and each genotype to study whether there is a cohort pattern of variability and how this pattern is changed following disruption of Cx43.
Pearson’s correlation coefficients “Cor” between the sets of four binary logarithms of relative expression levels were computed for all pairs of quantified distinct genes in each genotype; positive correlation indicates synergistic expression of paired genes (simultaneous increase and decrease among mice), negative correlation indicates antagonistic expression (inverse expression tendencies), while a value close to zero indicates independent expression. The 5% cutoff values for four replicas are: Cor>0.9 for synergism, Cor<−0.9 for antagonism and │Cor│< 0.05 for independence. Moderate correlations (0.05 ≥ │Cor│ ≥ 0.90) were eliminated from the analysis because of questionable significance.
Coordination similarity
We now introduce two scores to compare the coordination profiles of the distinct genes j and k in the genotype G (= wildtype, Cx43−/−), the similarity SIM(j,k) and the conditional similarity CSI(j,k):
| (1) |
= number of distinct elements in set .
where: S, A and I are the sets of antagonistic, synergistic and independent partners of the indicated gene with the other genes of the selection. Both SIM and CSI values range between −100% (completely opposite coordination profiles) to 100% (identical coordination profiles). SIM and CSI values increase with each shared synergism, antagonism or independence of both j and k with other genes and decrease with each opposite (i.e. synergistic for one and antagonistic for other or independent for one and synergistic or antagonistic for other). The difference between SIM and CSI is that while SIM refers to all genes in a significant synergistic, antagonistic or independent relation with any of j and k, CSI is restricted to the genes that are partners only to gene j and therefore |CSI| ≥ |SIM|. In this report, we considered two genes as having similar coordination profiles if SIM > 40, opposite coordination profiles if SIM < −40, all other scores indicating neutral coordination profiles.
Coordination dominance
The Dominance DOM of gene j in the genotype G was computed as:
| (2) |
DOM takes values within the interval (−100, 100), with positive scores indicating dominant genes and negative ones indicating dominated genes.
Supplementary Material
Acknowledgments
This work was partially supported by NIH grants NS41282, MH65495, and DK060037.
Appendix A. Supplementary data
Supplementary data associated with this article can be found in the online version at doi:…
Footnotes
Publisher's Disclaimer: This is a PDF file of an unedited manuscript that has been accepted for publication. As a service to our customers we are providing this early version of the manuscript. The manuscript will undergo copyediting, typesetting, and review of the resulting proof before it is published in its final citable form. Please note that during the production process errors may be discovered which could affect the content, and all legal disclaimers that apply to the journal pertain.
References
- 1.Willecke K, et al. Structural and functional diversity of connexin genes in the mouse and human genome. Biol Chem. 2002;383:725–737. doi: 10.1515/BC.2002.076. [DOI] [PubMed] [Google Scholar]
- 2.Cruciani V, Mikalsen SO. The connexin gene family in mammals. Biol Chem. 2005;386(4):325–32. doi: 10.1515/BC.2005.039. [DOI] [PubMed] [Google Scholar]
- 3.Schulz R, Heusch G. Connexin43 and ischemic preconditioning. Adv Cardiol. 2006;42:213–27. doi: 10.1159/000092571. Review. [DOI] [PubMed] [Google Scholar]
- 4.Kretz M, Maass K, Willecke K. Expression and function of connexins in the epidermis, analyzed with transgenic mouse mutants. Eur J Cell Biol. 2004;83(11–12):647–54. doi: 10.1078/0171-9335-00422. [DOI] [PubMed] [Google Scholar]
- 5.Iacobas DA, Iacobas S, Urban-Maldonado M, Spray DC. Sensitivity of the brain transcriptome to connexin ablation. Biochimica et Biofisica Acta. 2005;1711:183–196. doi: 10.1016/j.bbamem.2004.12.002. [DOI] [PubMed] [Google Scholar]
- 6.Iacobas DA, Urban-Maldonado M, Iacobas S, Scemes E, Spray DC. Array analysis of gene expression in connexin43 null astrocytes. Physiol Genomics. 2003;15(3):177–190. doi: 10.1152/physiolgenomics.00062.2003. [DOI] [PMC free article] [PubMed] [Google Scholar]
- 7.Iacobas DA, Urban M, Iacobas S, Spray DC. Transcriptomic characterization of four classes of cell-cell/matrix genes in brains and hearts of wild type and connexin43 null mice. Rom J Physiology. 2003;40:68–85. [PubMed] [Google Scholar]
- 8.Iacobas DA, Urban M, Iacobas S, Spray DC. Transcription regulation and coordination of some cell signaling genes in brain and heart of connexin 43 null mouse. Rev Med Chir Soc Med Nat Iasi. 2003;107(3):534–9. [PubMed] [Google Scholar]
- 9.Iacobas DA, Scemes E, Spray DC. Gene expression in connexin43 null astrocytes extended beyond the gap junction. Neurochem Intl. 2004;45(2–3):243–250. doi: 10.1016/j.neuint.2003.12.008. [DOI] [PubMed] [Google Scholar]
- 10.Iacobas DA, Iacobas S, Li WE, Zoidl G, Dermietzel R, Spray DC. Genes controlling multiple functional pathways are transcriptionally regulated in connexin43 null mouse heart. Physiol Genomics. 2005;20:211–223. doi: 10.1152/physiolgenomics.00229.2003. [DOI] [PubMed] [Google Scholar]
- 11.Iacobas DA, Iacobas S, Spray DC. Use of cDNA arrays to explore gene Expression in genetically manipulated mice and cell lines. In: Dhein S, Mohr FW, Delmar M, editors. Practical Methods in Cardiovascular Research. Springer-Verlag; Berlin: 2005. pp. 907–915. [Google Scholar]
- 12.Iacobas DA, Urban M, Iacobas S, Spray DC. Control and variability of gene expression in mouse brain and in a neuroblastoma cell line. Rom J Physiol. 2002;39–40:71–90. [PubMed] [Google Scholar]
- 13.Reaume AG, et al. Cardiac malformation in neonatal mice lacking connexin43. Science. 1995;267:1831–1834. doi: 10.1126/science.7892609. [DOI] [PubMed] [Google Scholar]
- 14.Melloy PG, Kusnierczyk MK, Meyer RA, Lo CW, Desmond E. Overexpression of connexin43 alters the mutant phenotype of midgestational wnt-1 null mice resulting in recovery of the midbrain and cerebellum. Anat Rec A Discov Mol Cell Evol Biol. 2005;283(1):224–38. doi: 10.1002/ar.a.20158. [DOI] [PubMed] [Google Scholar]
- 15.Fushiki S, et al. Changes in neuronal migration in neocortex of connexin43 null mutant mice. J Neuropathol Exp Neurol. 2003;62(3):304–14. doi: 10.1093/jnen/62.3.304. [DOI] [PubMed] [Google Scholar]
- 16.Scemes E, Suadicani SO, Spray DC. Intercellular communication in spinal cord astrocytes: fine tuning between gap junctions and P2 nucleotide receptors in calcium wave propagation. J Neurosci. 2000;20(4):1435–45. doi: 10.1523/JNEUROSCI.20-04-01435.2000. [DOI] [PMC free article] [PubMed] [Google Scholar]
- 17.Dermietzel R, et al. Connexin43 null mice reveal that astrocytes express multiple connexins. Brain Res Brain Res Rev. 2000;32(1):45–56. doi: 10.1016/s0165-0173(99)00067-3. [DOI] [PubMed] [Google Scholar]
- 18.Raser JM, O'Shea EK. Control of Stochasticity in Eukaryotic Gene Expression. Science. 2004;304(5678):1811–4. doi: 10.1126/science.1098641. [DOI] [PMC free article] [PubMed] [Google Scholar]
- 19.Raser JM, O'Shea EK. Noise in gene expression: origins, consequences, and control. Science. 2005;309(5743):2010–3. doi: 10.1126/science.1105891. Review. [DOI] [PMC free article] [PubMed] [Google Scholar]
- 20.Kepler TB, Elston TC. Stochasticity in transcriptional regulation: origins, consequences, and mathematical representations. Biophys J. 2001;81(6):3116–36. doi: 10.1016/S0006-3495(01)75949-8. [DOI] [PMC free article] [PubMed] [Google Scholar]
- 21.Fan C, Iacobas DA, Zhou D, Chen Q, Gavrialov O, Haddad GG. Gene expression and phenotypic characterization of mouse heart after chronic constant and intermittent hypoxia. Physiol Genomics. 2005;22:292–307. doi: 10.1152/physiolgenomics.00217.2004. [DOI] [PMC free article] [PubMed] [Google Scholar]
- 22.Iacobas DA, Fan C, Iacobas S, Spray DC, Hadad GG. trancriptomic changes in developing kidney exposed to chronic hypoxia. Biochem Biophys Res Commun. doi: 10.1016/j.bbrc.2006.08.056. (in press) [DOI] [PubMed] [Google Scholar]
- 23.Barrios-Rodiles M, et al. High-throughput mapping of a dynamic signaling network in mammalian cells. Science. 2005;307:1621–1625. doi: 10.1126/science.1105776. [DOI] [PubMed] [Google Scholar]
- 24.Kim SK, et al. A gene expression map for Caenorhabditis elegans. Science. 2001;293(5537):2087–92. doi: 10.1126/science.1061603. [DOI] [PubMed] [Google Scholar]
- 25.Stuart JM, Segal E, Koller D, Kim SK. A gene-coexpression network for global discovery of conserved genetic modules. Science. 2003;302:249–255. doi: 10.1126/science.1087447. [DOI] [PubMed] [Google Scholar]
- 26.Calvano SE, et al. A network-based analysis of systemic inflammation in humans. Nature Letters. 2005:1–6. [Google Scholar]
- 27.Schubert AL, Schubert W, Spray DC, Lisanti MP. Connexin family members target to lipid raft domains and interact with caveolin-1. Biochemistry. 2002;41(18):5754–64. doi: 10.1021/bi0121656. [DOI] [PubMed] [Google Scholar]
- 28.Ge H, Liu Z, Church GM, Vidal M. Correlation between transcriptome and interactome mapping data from Saccharomyces cerevisiae. Nat Genet. 2003;33:15–16. doi: 10.1038/ng776. [DOI] [PubMed] [Google Scholar]
- 29.Duffy HS, Delmar M, Spray DC. Formation of the gap junction nexus: binding partners for connexins. J Physiol Paris. 2002;96(3–4):243–9. doi: 10.1016/s0928-4257(02)00012-8. [DOI] [PubMed] [Google Scholar]
- 30.Panchin YV. Evolution of gap junction proteins--the pannexin alternative. J Exp Biol. 2005;208(Pt 8):1415–9. doi: 10.1242/jeb.01547. Review. [DOI] [PubMed] [Google Scholar]
- 31.Sohl G, Maxeiner S, Willecke K. Expression and functions of neuronal gap junctions. Nat Rev Neurosci. 2005;6(3):191–200. doi: 10.1038/nrn1627. Review. [DOI] [PubMed] [Google Scholar]
- 32.Ray A, Zoidl G, Weickert S, Wahle P, Dermietzel R. Site-specific and developmental expression of pannexin1 in the mouse nervous system. Eur JNeurosci. 2005;21(12):3277–90. doi: 10.1111/j.1460-9568.2005.04139.x. [DOI] [PubMed] [Google Scholar]
- 33.Baranova A, et al. The mammalian pannexin family is homologous to the invertebrate innexin gap junction proteins. Genomics. 2005;83(4):706–16. doi: 10.1016/j.ygeno.2003.09.025. [DOI] [PubMed] [Google Scholar]
- 34.Bruzzone R, Barbe MT, Jakob NJ, Monyer H. Pharmacological properties of homomeric and heteromeric pannexin hemichannels expressed in Xenopus oocytes. J Neurochem. 2005;92(5):1033–43. doi: 10.1111/j.1471-4159.2004.02947.x. [DOI] [PubMed] [Google Scholar]
- 35.Bruzzone R, Hormuzdi SG, Barbe MT, Herb A, Monyer H. Pannexins, a family of gap junction proteins expressed in brain. Proc Natl Acad Sci U S A. 2003;100(23):13644–9. doi: 10.1073/pnas.2233464100. [DOI] [PMC free article] [PubMed] [Google Scholar]
- 36.Saez JC, Retamal MA, Basilio D, Bukauskas FF, Bennett MV. Connexin-based gap junction hemichannels: gating mechanisms. Biochim Biophys Acta. 2005;1711(2):215–24. doi: 10.1016/j.bbamem.2005.01.014. [DOI] [PMC free article] [PubMed] [Google Scholar]
- 37.Ai Z, Fischer A, Spray DC, Brown AM, Fishman GI. Wnt-1 regulation of Cx43 in cardiac myocytes. J Clin Invest. 2000;105:161–171. doi: 10.1172/JCI7798. [DOI] [PMC free article] [PubMed] [Google Scholar]
- 38.Spray DC, Scemes E, Rozental, Dermietzel R. Cell to cell signaling: An overview emphasizing gap junctions. In: Byrne J, Roberts J, editors. From Molecules to Networks. An Introduction to Cellular and Molecular Neuroscience. Academic Press; 2004. pp. 431–458. [Google Scholar]
- 39.Butte AJ, Tamayo P, Slonim D, Golub TR, Kohane IS. Discovering functional relationships between RNA expression and chemotherapeutic susceptibility using relevance networks. Proc Natl Acad Sci USA. 2000;97:12182–12186. doi: 10.1073/pnas.220392197. [DOI] [PMC free article] [PubMed] [Google Scholar]
- 40.Carter SL, Brechbuhler CM, Griffinm M, Bond AT. Gene co-expression network topology provides a framework for molecular characterization of cellular state. Bioinformatics. 2004;20:2242–2250. doi: 10.1093/bioinformatics/bth234. [DOI] [PubMed] [Google Scholar]
- 41.Jeong H, Mason SP, Barabasi AL, Oltvai ZN. Lethality and centrality in protein networks. Nature. 2001;411:41–41. doi: 10.1038/35075138. [DOI] [PubMed] [Google Scholar]
- 42.Tewari M, et al. Systematic interactome mapping and genetic perturbation analysis of a C. elegans TGF-beta signaling network. Mol Cell. 2004;13(4):469–82. doi: 10.1016/s1097-2765(04)00033-4. [DOI] [PubMed] [Google Scholar]
- 43.Martin GM. Genetic modulation of senescent phenotypes in Homo sapiens. Cell. 2005;120(4):523–32. doi: 10.1016/j.cell.2005.01.031. Review. [DOI] [PubMed] [Google Scholar]
- 44.Sung HY, Francis SE, Crossman DC, Kiss-Toth E. Regulation of expression and signalling modulator function of mammalian tribbles is cell-type specific. Immunol Lett. 2005 doi: 10.1016/j.imlet.2005.11.010. [Epub ahead of print] [DOI] [PubMed] [Google Scholar]
- 45.Scemes E. Components of astrocytic intercellular calcium signaling. Mol Neurobiol. 2000;22(1–3):167–79. doi: 10.1385/MN:22:1-3:167. Review. [DOI] [PubMed] [Google Scholar]
- 46.Scemes E, Duval N, Meda P. Reduced expression of P2Y1 receptors in connexin43-null mice alters calcium signaling and migration of neural progenitor cells. J Neurosci. 2003;23(36):11444–52. doi: 10.1523/JNEUROSCI.23-36-11444.2003. Erratum in: J Neurosci. (2004) 24(1):302. [DOI] [PMC free article] [PubMed] [Google Scholar]
- 47.Suadicani SO, De Pina-Benabou MH, Urban-Maldonado M, Spray DC, Scemes E. Acute downregulation of Cx43 alters P2Y receptor expression levels in mouse spinal cord astrocytes. Glia. 2003;42:160–171. doi: 10.1002/glia.10197. [DOI] [PMC free article] [PubMed] [Google Scholar]
- 48.John GR, et al. C.F. IL-1beta differentially regulates calcium wave propagation between primary human fetal astrocytes via pathways involving P2 receptors and gap junction channels. Proc Natl Acad Sci U S A. 1999;96(20):11613–8. doi: 10.1073/pnas.96.20.11613. [DOI] [PMC free article] [PubMed] [Google Scholar]
- 49.Iacobas DA, Suadicani SO, Spray DC, Scemes E. A stochastic 2D model of intercellular Ca2+ wave spread in glia. Biophys J. 2006;90(1):24–41. doi: 10.1529/biophysj.105.064378. [DOI] [PMC free article] [PubMed] [Google Scholar]
- 50.Fry AM. The Nek2 protein kinase: a novel regulator of centrosome structure. Oncogene. 2002;21(40):6184–94. doi: 10.1038/sj.onc.1205711. Review. [DOI] [PubMed] [Google Scholar]
- 51.Iacobas DA, Urban M, Massimi A, Spray DC. Improved procedure to mine the spotted cDNA arrays. J Biomol Tech. 2002;13(1):5–19. [PMC free article] [PubMed] [Google Scholar]
- 52.Iacobas DA, Urban M, Massimi A, Iacobas S, Spray DC. Hits and misses from gene expression ratio measurements in cDNA microarray studies. J Biomol Tech. 2002;13(3):143–157. [PMC free article] [PubMed] [Google Scholar]
- 53.Quackenbush J. Extracting meaning from functional genomics experiments. Toxicol Appl Pharmacol. 2005;207(2 Suppl):195–9. doi: 10.1016/j.taap.2005.04.029. [DOI] [PubMed] [Google Scholar]
Associated Data
This section collects any data citations, data availability statements, or supplementary materials included in this article.