

Abstract
Background:
Structural magnetic resonance imaging (MRI) reveals widespread brain damage manifest as tissue shrinkage and complementary ventriculomegaly in human alcoholism. For an animal model to parallel the human condition, high alcohol exposure should produce similar radiologically detectable neuropathology. Our previous structural MRI study demonstrated only modest brain dysmorphology of the alcohol-preferring (P) rat with average blood alcohol levels (BALs) of 125 mg/dl achieved with voluntary consumption. Here, we tested the hypothesis that wild-type Wistar rats, exposed to vaporized alcohol ensuring higher BALs than typically achieved with voluntary consumption in rodents, would model MRI findings in the brains of humans with chronic alcoholism.
Methods:
The longitudinal effects of vaporized alcohol exposure on the brains of 10 wild-type Wistar rats compared with 10 sibling controls were investigated with structural MRI, conducted before (MRI 1) and after (MRI 2) 16 of alcohol exposure and after an additional 8 weeks at a higher concentration of alcohol (MRI 3).
Results:
Two rats in the alcohol group died prior to MRI 2. The remaining vapor-exposed rats (n = 8) achieved BALs of 293 mg/dl by MRI 2 and 445 mg/dl by MRI 3. Whereas the controls gained 17% of their body weight from MRI 1 to MRI 3, the alcohol-exposed group lost 6%. MRI, quantified with atlas-based parcellation, revealed a profile of significant ventricular expansion, after alcohol vapor exposure, in 9 contiguous slices, extending from the dorsolateral to ventrolateral ventricles. In particular, from MRI 1 to MRI 2, this ventricular volume expanded by an average of 6.5% in the controls and by 27.1% in the alcohol-exposed rats but only an additional 1.5% in controls and 2.4% in alcohol-exposed rats from MRI 2 to MRI 3. The midsagittal volume of the full anterior-to-posterior extent of the corpus callosum grew between the first 2 MRIs in both groups followed by regression in the alcohol group by MRI 3. Although group differences were statistically significant, among animals there was substantial variability of the effects of alcohol exposure on brain morphology; some animals showed profound effects, whereas others were essentially unaffected.
Conclusions:
The ventricular dilatation and callosal shrinkage produced in wild-type rats following involuntary alcohol exposure yielded a modestly successful model of neurodysmorphology phenotypes of human alcoholism. As is the case for the human condition, however, in which some individuals express greater alcoholism-related neuropathology than others, some rats may be more susceptible than others to extreme alcohol exposure.
Keywords: Alcohol, Rat, Magnetic Resonance Imaging, Vaporized Alcohol, Brain, Corpus Callosum, Ventricles
Magnetic resonance imaging (MRI) of the brains of chronically dependent alcoholic human adults commonly reveals a robust phenotype of widespread tissue damage and complementary ventriculomegaly (for review, Oscar-Berman and Marinkovic, 2007; Sullivan and Pfefferbaum, 2005). Specific brain regions affected by chronic alcohol exposure and described by structural MRI include cortical gray and white matter (Jernigan et al., 1991; Pfefferbaum et al., 1992), particularly prefrontal areas in older alcoholic individuals (Cardenas et al., 2007; Pfefferbaum et al., 1997), mammillary bodies (Davila et al., 1994; Shear et al., 1996; Sullivan et al., 2000b), anterior hippocampus (Agartz et al., 1999; Sullivan and Marsh, 2003; Sullivan et al., 1995), thalamus (Sullivan et al., 2003), pons (Pfefferbaum et al., 2002; Sullivan, 2003), and cerebellum (Sullivan et al., 2000a). These findings are typically documented in treatment-seeking alcoholics but may not necessarily characterize nontreatment seeking ones (Fein and Landman, 2005). A further source of variance stems from history and pattern of drinking over a lifetime, with some studies reporting dose effects of greater or more frequent drinking as resulting in greater evidence for brain damage (e.g., Pfefferbaum et al., 1998). Thus, the heterogeneity of effects possible with excessive alcohol drinking provides further justification for the desirability of developing an animal model to aid in identifying sources of heterogeneity in disruption of brain structure and function.
A valid animal model of human alcoholism should exhibit signs of neuropathology in selective brain regions, circuits, and systems affected in human alcoholism. In response to alcohol exposure, focal changes to frontal cortex, corpus callosum (Savage et al., 2000), cerebellum (e.g., Dlugos and Pentney, 1997; Pentney and Dlugos, 2000; Pentney and Quackenbush, 1990; Rintala et al., 1997), and locus coeruleus (Lu et al., 1997) have been verified by cross-sectional, postmortem analysis of rodent brains. MRI, however, enables longitudinal whole-brain imaging, thereby permitting the testing of hypotheses about the specificity of regional abnormalities within the context of the entire brain. Animal models are essential in controlling factors, such as age of alcohol exposure onset, duration of dependence, nutrition, metabolism, and genetics, which will lead to identification of mechanisms and predictors of damage with alcohol exposure and recovery with alcohol cessation.
The rich literature on human in vivo neuroimaging studies of alcoholism contrasts with the few such published neuroimaging studies in rodents. Initial MRI studies, conducted at 1.5T, used thiamine deficiency models of Wernicke's encephalopathy (Pentney et al., 1993) and reported increased volume of lateral ventricles followed by normalization with a thiamine-enriched diet (Acara et al., 1995). Glucose administration to rats previously made thiamine deficient with pyrithiamine treatment produced impairment of the blood–brain barrier, observed qualitatively on T1-weighted images (Zelaya et al., 1995), and hyperintensities in the hippocampus as well as in the thalamus, hypothalamus, and collicular bodies, observed on T2-weighted images (Jordan et al., 1998).
The selectively bred alcohol-preferring (P) rat has been extensively studied and satisfies many of the requirements for a suitable animal model of alcoholism (Rodd et al., 2004). In an attempt to validate in vivo MRI in the rat as a model of alcohol's effect on brain structure, our initial structural MR studies focused on the effects of high doses of alcohol, voluntarily consumed by P rats for about 1 year (Pfefferbaum et al., 2006a). The paradigm involved a 3-bottle choice with 0, 15 (or 20%), and 30% (or 40%) alcohol available in several different exposure schemes: continuous exposure, cycles of 2 weeks on followed by 2 weeks off alcohol, and binge drinking in the dark. As observed in control animals (Sullivan et al., 2006), the brain structures of alcohol exposed adult P rats showed significant growth, attenuated in a few measures by alcohol exposure, with the greatest demonstrable effect on the corpus callosum (Pfefferbaum et al., 2006a). Indeed, only modest brain dysmorphology was revealed by structural MRI of the P rat voluntary consuming alcohol to BALs of ∼125 mg/dl.
Given the subtle brain changes produced by high voluntary alcohol consumption in P rats, we have now repeated the MR experiment using the vapor chamber method of alcohol delivery. Exposure to alcohol by vapor is under experimental control, will reduce individual differences in drinking patterns (Carlson and Drew Stevens, 2006), and can accelerate and increase the timing and amount of alcohol exposure and thus better mimic the excessively high alcohol levels experienced by many human alcoholics (Kang et al., 2004; O'Dell et al., 2004).
We expected that higher doses of alcohol would produce more dramatic changes in the brains of exposed rats than did voluntary exposure. Thus, controlled involuntary alcohol exposure would serve as a better model of alcoholism than did uncontrolled voluntary exposure in that these MRI findings would mimic those observed in the brain of human alcoholism, including widespread tissue shrinkage, notable in the corpus callosum, and complementary ventriculomegaly.
METHODS
Subjects
Ten sibling pairs (from 10 different dams) of healthy, adult male wild-type Wistar rats (Charles River, Raleigh, NC) were singly housed in a reverse light/dark cycle with free access to water and food (vitamin- and mineral-enriched mouse and rat diet, #7001; Teklad, Madison, WI) and handled according to procedures approved by the SRI International and Stanford University Administrative Panels on Laboratory Animal Care. Animals were maintained in the SRI International facilities fully accredited by the Association for the Assessment and Accreditation of Laboratory Animal Care. The rats were acclimated to their laboratory environment and weighed once per week for 16 weeks before the first imaging session.
Alcohol Exposure
At the first imaging session, the average weight of all 20 rats was 627.44 ± 87.14 g. After MRI 1 (prealcohol baseline scanning), all rats were singly housed in a vapor chamber; 1 rat from each sibling pair was exposed to alcohol, and the other was a control exposed to air, using the rodent alcohol-inhalation system (La Jolla Alcohol Research Inc., La Jolla, CA). At baseline, the alcohol group weighed an average of 625.88 ± 97.4 g and the control group weighed 629 ± 76.9 g and thus was matched in body weight and heritage.
Ethanol vapor was created by dripping 95% ethanol into 4000-ml Erlenmeyer vacuum flasks kept at 50°C on a warming tray. Air was blown over the bottom of the flask at 11 l/min to vaporize the ethanol. Concentrations of ethanol vapor were adjusted by varying the rate at which ethanol was pumped into the flask and ranged from 22 to 27 mg/l. Chambers administering intermittent vapor were connected to a timer that turned the chambers on and off every day so that the animals received ethanol vapor for 14 hours during their light cycle between MRI 1 and MRI 2. Between MRI 2 and MRI 3, alcohol exposure was increased by raising the concentration of alcohol vapor delivered to the chamber. Previous work has demonstrated that ethanol vapor exposure is a reliable technique, allows animals to be freely moving, and can maintain BALs at predetermined levels (O'Dell et al., 2004; Roberts et al., 2000).
Alcohol exposure began 3 weeks after MRI 1 and was slowly adjusted over the next 16 weeks so that blood alcohol levels (BALs) reached ∼200 mg/dl for each animal. As exposure was for 14 hours a day, every day, the total exposure time between MRI 1 and MRI 2 was 112 days. Another 8 weeks (56 days) of alcohol exposure was used to escalate the BALs to ∼400 mg/dl per animal, with the intention of testing whether higher BALs for a longer period of time would result in further brain dysmorphology. BALs were measured at least once a month. Tail blood (∼0.5 ml), sampled for BAL determination, was collected into heparinized Eppendorf tubes (GE Healthcare, Piscataway, NJ). After centrifugation, the plasma was extracted and assayed for ethanol content based on direct reaction with the enzyme alcohol oxidase (Analox Instruments, Ltd., London, England).
MRI Scanning Procedures
Anesthesia and Monitoring
As previously described (Adalsteinsson et al., 2004; Pfefferbaum et al., 2004a), animals were held in an MR-invisible structure, which provided support for the radio frequency (RF) coil and a nose cone for delivery of isoflurane anesthesia (2 to 3.5%) and oxygen (1.5 l/min). Rectal temperature and oxygen saturation from the hind limb were monitored throughout the experiment. Heating was provided by prewarmed bags of saline solution placed under the animal tray. Rats were scanned in sessions of ∼2 hours each.
MRI Acquisition
The experiments were conducted on a clinical 3 T GE Signa clinical MR scanner equipped with a high-strength insert gradient coil [peak strength = 600 mT/m; peak slew rate = 3200 T/m/s (Chronik et al., 2000)]. The gradient system was operated at a maximum amplitude of 500 mT/m with a slew rate of 1800 mT/m/ms. A custom-made rat brain quadrature head coil (∅ = 44 mm) was used for both RF excitation and signal reception. A gradient-recalled echo localizer scan [echo time (TE)/repetition time (TR) = 2.4/24.6 ms, field of view (FOV) = 80 × 80 mm2, 256 × 128 matrix, 2.5 mm slices per plane] was used to position the animals in the scanner and for graphical prescription of the subsequent scans. High resolution, dual echo, fast spin-echo images were acquired in the coronal plane, transaxial to the magnet system bore (TE1/TE2/TR = 11.3/56.7/7000 ms, FOV = 60 × 60 mm2, 256 × 256 matrix, echo train length = 8, 70 slices, 0.5-mm thick, 0 skip). Nominal acquisition resolution was 0.234 × 0.234 × 0.500 mm.
Image Postprocessing
MRI data were quantified with atlas-based parcellation computations based on delineation of the lateral ventricles on the baseline images of 1 untreated, reference animal. For registration, the data were reformatted into near-isotropic voxels (0.117 × 0.117 × 0.125 mm) using cubic interpolation. Each animal's time 1 image was registered to the reference animal's time 1 data with affine followed by nonrigid registration algorithms (Rohlfing and Maurer, 2003; Rohlfing et al., 2006, 2008). Each animal's time 2 and time 3 images were similarly registered to its own time 1 data.
The lateral ventricles were identified bilaterally on the reference animal's time 1 data using a semi-automatic histogram segmentation operator, beginning 20 slices (each 0.125-mm thick) rostral to the anterior commissure (AC) and extending 40 slices caudal to the AC. Parcellations of all images were then obtained by label propagation from the segmented reference animal. For baseline images of the remaining animals, label propagation used the inter-animal non-rigid transformation. For the time 2 and time 3 images of all animals, label propagation used a concatenation of the applicable inter-animal non-rigid transformation, followed by the within-animal nonrigid transformation. The propagated parcellation data for each animal was an image of the ventricular system in native space for each animal and was quantified on a slice-by-slice basis. A similar region-of-interest propagation was performed for the entire length of the corpus callosum, from genu to splenium, as defined on the midsagittal and 4 parasagittal slices bilaterally. The resultant callosal volume was 1.06-mm wide. Affine registrations, preserving relative within-animal size, were retained for individual and group average display.
Neurological Examination
We measured neurological signs associated with withdrawal, although the rats were never allowed to endure a prolonged withdrawal period, as the cycle of alcohol exposure was 14 hours on and 10 hours off. Examination was conducted by 2 investigators (NMZ and SV), who noted the presence or absence of 33 signs (Becker, 2000; Pitkin and Savage, 2001). To test for potential differences in behavior at different times relative to alcohol exposure, neurological testing was administered within 1 hour after alcohol exposure and again 13 hours after alcohol exposure (1 hour before re-exposure), before MRI 2 and MRI 3.
Statistical Analysis
Group differences were tested with repeated-measures analysis of variance (ANOVA), 2-group t-tests, and paired t-tests, where appropriate. Alcohol effects were subject to 1-tailed tests because we hypothesized that alcohol exposure would have adverse effects on brain structure, such that the ventricles would enlarge and the corpus callosum would shrink with alcohol exposure.
RESULTS
Blood Alcohol Levels and Weight
In the first 16 weeks of intermittent alcohol exposure (14 hours on during the light cycle and 10 hours off), 2 rats died; the remaining 8 rats in the alcohol group reached mean ± SD BALs of 292.98 ± 42.12 mg/dl (range = 240.5 to 385.6) and weighed a mean ± SE of 606.0 ± 83.2 g (control group weighed 713.7 ± 94.0 g). After 24-week alcohol exposure (again 14 hours on during the light cycle and 10 hours off), the alcohol group achieved average BALs of 444.6 ± 59.1 mg/dl (range 324.3 to 514.1) weighed 567.1 ± 107.6 g and the control group weighed 733.5 ± 96.9 g (Figure 1). Group differences in weight over time were examined with a repeated-measures ANOVA, which yielded a group-by-time interaction [F(1,16) = 28.611, p = 0.0001]. Whereas the control group showed a steady and significant increase in body weight across the 3 MRI sessions, the alcohol group showed no weight gain between MRI 1 and MRI 2 and a weight loss at MRI 3 [t(7) = 1.895, p = 0.049, 1-tailed]. At MRI 3, higher BALs correlated with lower body weights (ρ = −0.67, p = 0.029, 1-tailed).
Fig. 1.
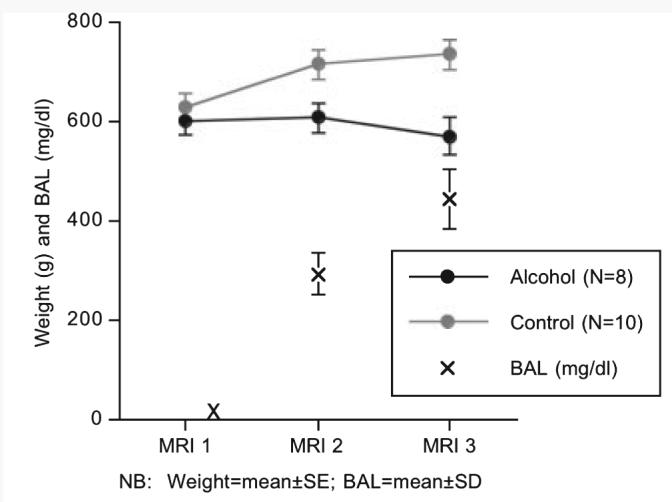
Mean ± SE of the body weights (g) of the alcohol exposed (black) and control (gray) groups at each MRI session. The X's mark the mean ± SD of the blood alcohol levels (BALs) of the alcohol-exposed group soon after the onset of alcohol vapor exposure and also at MRI 2 and MRI 3. Note that weight (g) and BAL (mg/dl) are on the same scale.
Neurological Examination
At MRI 2, testing within 1 hour of alcohol exposure revealed alcohol-associated neurological signs in 4 of the 8 rats examined; 3 of the 4 exhibited impairment in righting reflex. At the testing 13 hours after alcohol exposure, 6 of these 8 rats exhibited neurological signs: 5 exhibited gait disturbance and 3 righting reflex impairment. At MRI 3, all 8 alcohol rats demonstrated neurological signs, expressed as agitation, aggressiveness, and impairment of righting reflex, within 1 hour of alcohol exposure. At 13 hours after alcohol exposure, all 8 alcohol rats continued to show neurological signs; 4 developed tremor.
Ventricular System
To identify the regions of maximum effect, profiles of the volume changes [(time 2 − time1)/time 1 and (time 3 − time 1)/time 1] on a slice-by-slice basis of the ventricular system for each animal at each time were created. The profiles were smoothed with a 5-point boxcar function to reduce high-frequency (slice-to-slice) positioning variability across animals (Figure 2).
Fig. 2.
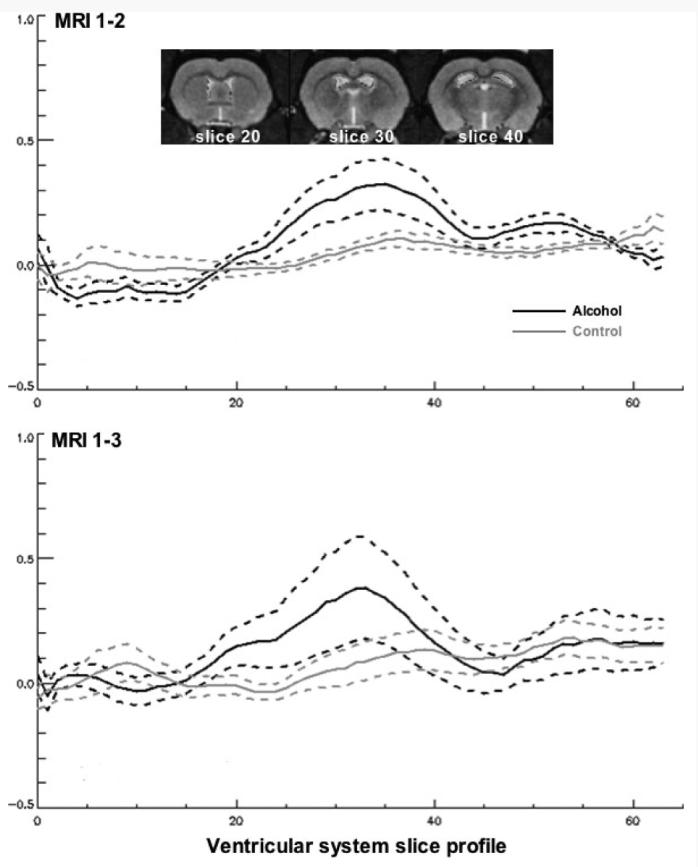
Profile of differences in slice areas between MRI 1 and MRI 2 (top) and between MRI 1 and MRI 2 (bottom) in the alcohol-exposed (black lines) and control (gray lines) groups. The solid lines are the means and the dotted lines are 1 standard deviation for each difference of each group. Anterior slices are at the far left. The images are taken from the reference rat at slices 20, 30, and 40. Note that the maximal group differences were present from about slices 25 to 30, and volume of these slices were created for group analyses.
For time 1 to 2, maximum group differences were observed from slice 25 to 40, which subtends the region 0.625 to 2.5 mm posterior to the AC, and were subject to repeated-measures ANOVA, which revealed significant group [F(1,17) = 5.512, p = 0.0313] and slice [F(15,225) = 5.111, p = 0.0001] effects with no interaction [F(1,17) = 5.512, p = 0.2495]. Individual t-tests for 13 of the 16 slices were larger (p < 0.05, 1-tailed) for the alcohol treated than the control animals. The ventricles in this region expanded by an average of 6.5% in the controls and by 27.1% in the alcohol treated.
For the time 1 to 3 analysis of the same slices, the ventricles of the control group expanded by an average of 8.0% and those of the alcohol-treated group by 29.5%, but the group effect was not significant [F(1,16) = 1.611, p = 0.2225]. Analysis of a second, more anterior, region guided by the profile identified slices 20 to 24 (anatomy) as areas of maximal effect. Repeated-measures ANOVA revealed a group effect [F(1,16) = 4.543, p = 0.0489] with 17% average expansion for the alcohol treated and −3% change for the controls. Individual t-tests revealed that all 5 of the slices in this region were larger (p < 0.05, 1-tailed) for the alcohol-treated than the control animals.
The slice profile of the ventricles revealed 2 regions of maximal group difference. The more anterior region included slices 25 to 30, which subtends the region 0.625 to 1.25 mm posterior to the AC, from which a volume was made for each rat. A repeated-measures ANOVA across the 3 sessions revealed a significant effect across MRI sessions [F(2,32) = 3.61, p = 0.0387] and an interaction [F(2,32) = 4.31, p = 0.0219] but not a simple group effect (F(1,16) = 1.198, p = 0.29). Post hoc t-tests indicated trend group differences (1-tailed) at MRI 2 [t(16) = 1.419, p = 0.0875] and at MRI 3 [t(16) = 1.659, p = 0.0583]. The interaction (Figure 3) indicated similar ventricular volumes at the baseline MRI in the 2 groups with expansion in the alcohol group while the control group exhibited no change (Figure 4). A follow-up set of analyses took advantage of the sib-pair design (Figure 5), which can reduce variance but, in this case, also reduced power because both the rat that died and its sib-pair had to be removed from the analysis. (Note that Figure 5 includes 9 sib-pairs because we were able to scan the second rat that died postmortem; however, given the differences that occur in the MR signal between in vivo and postmortem (Pfefferbaum et al., 2004b), we did not include the postmortem data in the formal data analysis.) The results, based on 8 sib-pairs, were similar to the between-subjects ANOVA and yielded a signifi-cant interaction [F(2,23) = 4.294, p = 0.0351]. The post hoc paired t-tests, however, yielded stronger differences (also 1-tailed) for both session comparisons: MRI 1 to MRI 2 [t(7) = 2.461, p = 0.0217] and MRI 1 to MRI 3 [t(7) = 2.052, p = 0.0396]. The MRI 2 to MRI 3 ventricular expansion in the alcohol-exposed group, however, showed only a trend toward significance [t(7) = 1.48, p = 0.0912, 1-tailed].
Fig. 3.
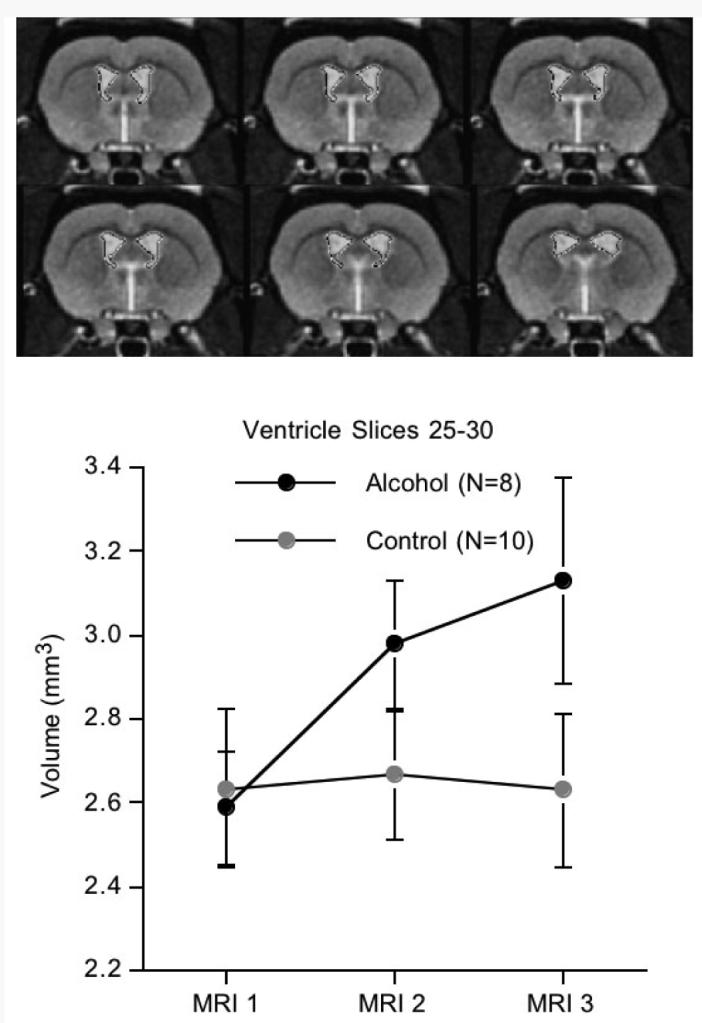
Top: Images are the ventricular slices 25 to 30, taken from the reference brain. Bottom: Mean ± SE of the ventricular volumes for the alcohol and control groups. Compare the ventricular expansion in the alcohol rats with the lack of change in the control rats.
Fig. 4.

Examples of 2 sibling pairs of rats at each of the 3 MRIs. Note the progressive enlargement of the ventricles from baseline (MRI 1) to MRI 3 in the alcohol rats compared with their control mates.
Fig. 5.

Body weights, ventricle volumes for slices 25 to 30, and corpus callosum volumes plotted by sib-pairs (alcohol exposed is in black; control is in gray) at each MRI session for the 9 pairs that were available for at least the first 2 scanning sessions. Note that Figure 5 includes 9 sib-pairs because we were able to scan the second rat that died postmortem; however, given the differences that occur in the MR signal between in vivo and postmortem (Pfefferbaum et al., 2004b), we did not include the postmortem data in the formal data analysis.
Corpus Callosum
For the corpus callosum, the area measures from all 9 slices were summed to create a single midsagittal volume for each animal and for each time. A repeated-measures ANOVA across the 3 sessions revealed a significant effect across MRI sessions [F(2,32) = 4.07, p = 0.0266] but neither a group effect [F(1,16) = 0.005, p = 0.94] nor interaction (F(2,32) = 1.30, p = 0.29). Re-analysis of these data using a sibling-pair model (Figure 5) yielded a significant treatment effect [F(2,23) = 5.4807, p = 0.0175]. Inspection of Figure 6 indicated that corpus callosum volumes of both groups grew from MRI 1 to MRI 2 [t(17) = 2.88, p = 0.0104] with no significant growth observed at MRI 3 in the controls [t(9) = 0.37, p = 0.72]. Follow-up paired t-test revealed volume decline in the alcohol group from MRI 2 to MRI 3 [t(7) = 2.314, p = 0.027, 1-tailed].
Fig. 6.
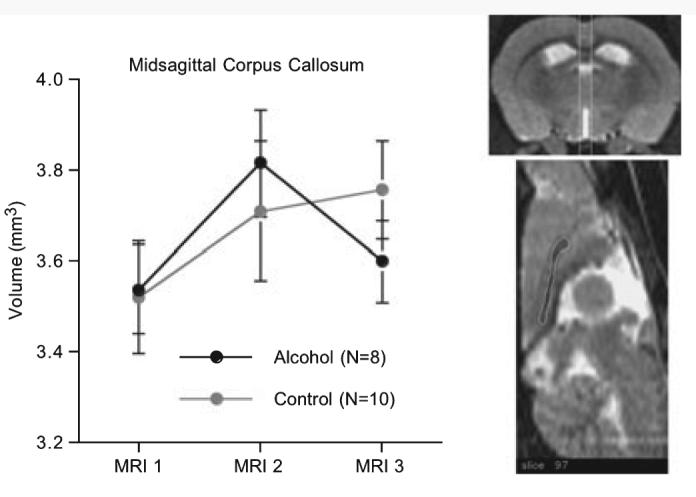
Mean ± SE of the volumes of the corpus callosum of the alcohol-exposed and control groups of rats. The white vertical lines on the coronal image (top) span the volume measured on 9 contiguous callosal slices. An example of the callosal outlining on the reference rat is presented on the midsagittal image.
DISCUSSION
This longitudinal study indicated that chronic, involuntary exposure to alcohol by vaporized delivery (Lee et al., 2000; O'Dell et al., 2004) resulted in high BALs—above 400 mg/dl—in wild-type Wistar rats. In step with these high blood levels of alcohol was modest brain dysmorphology detectable with quantitative structural MRI. In particular, despite a common baseline (prealcohol exposure) volume of a sample of the dorsolateral and ventrolateral ventricles in the alcohol and control groups, the alcohol group exhibited ventricular expansion over the 4 months between MRI 1 (baseline) and MRI 2 with no further expansion over the 2 months between MRI 2 and MRI 3, despite increase in enforced BALs from an average of 293 mg/dl at MRI 2 to 445 mg/dl at MRI 3, continued chronic exposure, and weight loss.
Replicating our prior longitudinal study of selectively bred Wistar P rats (Sullivan et al., 2006), we observed growth of the corpus callosum in both groups of wild-type Wistar rats. At the third MRI, the controls showed no further growth, whereas the alcohol-exposed group showed regression. Previously, we had demonstrated attenuated growth in P rats, which had drunk alcohol voluntarily for about a year (Pfefferbaum et al., 2006a).
It is likely that such high levels of blood alcohol (∼400%) could be achieved in wild-type Wistar rats only with involuntary alcohol exposure. Even rats selectively bred to consume vast amounts of alcohol voluntarily usually only achieve BALs under 200 mg/dl. With voluntary drinking, rats can achieve BALs of 60 to 70% with continuous alcohol exposure paradigms but upwards of 120 to 130% with a multiple-schedule access protocol (Bell et al., 2006). Whether this ceiling is due to physiological limits of self-preservation—indeed, with involuntary alcohol exposure our cohort sustained 20% attrition—or to other factors remains unknown, but the lower BALs achievable with voluntary drinking limit the research questions that can be answered with the rodent animal model. Thus, despite the translational advantages of employing rodents that drink voluntarily as models of the human condition (cf., Li et al., 1979; McBride and Li, 1998), the implementation of involuntary exposure techniques may extend the utility of rodent models for human alcoholism, which can be marked by exceptionally high voluntary consumption over decades.
Considering the extensive structural brain damage—both regional and widespread—observed especially in older human alcoholics, it is surprising that more obvious and profound volume changes were not present in the rats following very high alcohol exposure. The smooth cortex of the rodent with its absence of marked infoldings and convolutions of a human cortical mantle reduce the conspicuity of salient regions of dysmorphology, such as widening of fissures and cortical sulci, evident even without quantitative analysis in single cases of uncomplicated human alcoholism. Figure 7 presents a comparison of structural MRI studies on a 53-year-old, alcoholic man and an age-matched, low-drinking control man. Visually evident in the alcoholic compared with the control man is a thin corpus callosum, ventricular expansion, and sulcal and fissure widening, alcoholism-related dysmorphology commonly reported in groups of recovering alcoholics. Factors that may exacerbate alcohol's untoward effects on brain structure, at least in humans, include advancing age (Pfefferbaum et al., 1992, 1997, 2006b), nutritional deficiency (typically, B1 vitamin) (Harper and Butterworth, 1997; Thomson et al., 2002), and vulnerability to withdrawal effects (Lopez and Becker, 2005). In the current paradigm, the animals were exposed for 14 hours a day every day and therefore did not have extended periods during which time-protracted withdrawal could occur. Other factors, including nutritional sufficiency and genetic selection, may mitigate alcohol's neurotoxic effects in any species, serve as inherent characteristics of subprimate species, and could be considered as potential mechanisms of protection in human alcoholism. In any case, the current experiment provides longitudinal, quantitative evidence for alcohol exposure as the antecedent and likely cause of ventricular dilatation and attenuated callosal growth in wild-type rats, thus at least partially successful in modeling these robust morphological phenotypes of human alcoholism. Indeed, some alcohol-exposed animals did not show brain pathology in spite of high BALs and the failure to gain weight compared with their sibling, whereas 2 others died presumably under the same conditions. This individual variation in response to high and protracted alcohol exposure was evident in the structural brain data (Figure 5) and highlights the variance possible even within a rat strain, in this case, Wistar. It may be that the rat model is not fully adequate to express signs of human chronic alcoholism, possibly because of the rodent's lack of cortical and white matter complexity, high metabolism, or other genetic protective factors, which if identified have the potential of providing clues to mechanisms of therapeutic action. Alternatively, there are many individuals who meet criteria for alcohol use disorders in whom neurodysmorphology is not apparent (Fein and Landman, 2005; Fein et al., 2002). Indeed, as is the case for the human condition, in which some individuals express greater alcoholism-related neuropathology than others, some rats may be more susceptible than others to extreme alcohol exposure.
Fig. 7.

Examples of volumetric MRIs (left to right: sagittal, coronal, and axial views) of a 53-year-old nonalcoholic control man (top) and a 53-year-old man with alcoholism (bottom). Note the thinning of the corpus callosum, ventricular expansion, and sulcal and fissure widening in the alcoholic man compared with the control.
ACKNOWLEDGMENTS
We would like to thank Richard L. Bell, PhD, and Amanda Roberts, PhD, for consultation in implementing the vapor chamber procedure. This work was supported by AA013521-INIA and AA005965.
REFERENCES
- Acara M, Alletto JJ, Dlugos C, Pentney R. Small animal MRI. Alcohol Health Res World. 1995;19:321–324. [PMC free article] [PubMed] [Google Scholar]
- Adalsteinsson E, Hurd RE, Mayer D, Sailasuta N, Sullivan EV, Pfefferbaum A. In vivo 2D J-resolved magnetic resonance spectroscopy of rat brain with a 3T clinical human scanner. NeuroImage. 2004;22:381–386. doi: 10.1016/j.neuroimage.2003.12.046. [DOI] [PubMed] [Google Scholar]
- Agartz I, Momenan R, Rawlings RR, Kerich MJ, Hommer DW. Hippocampal volume in patients with alcohol dependence. Arch Gen Psychiatry. 1999;56:356–363. doi: 10.1001/archpsyc.56.4.356. [DOI] [PubMed] [Google Scholar]
- Becker HC. Animal models of alcohol withdrawal. Alcohol Res Health. 2000;24:105–113. [PMC free article] [PubMed] [Google Scholar]
- Bell RL, Rodd ZA, Lumeng L, Murphy JM, McBride WJ. The alcohol-preferring P rat and animal models of excessive alcohol drinking. Addict Biol. 2006;11:270–288. doi: 10.1111/j.1369-1600.2005.00029.x. [DOI] [PubMed] [Google Scholar]
- Cardenas VA, Studholme C, Gazdzinski S, Durazzo TC, Meyerhoff DJ. Deformation-based morphometry of brain changes in alcohol dependence and abstinence. NeuroImage. 2007;34:879–887. doi: 10.1016/j.neuroimage.2006.10.015. [DOI] [PMC free article] [PubMed] [Google Scholar]
- Carlson JN, Drew Stevens K. Individual differences in ethanol self-administration following withdrawal are associated with asymmetric changes in dopamine and serotonin in the medial prefrontal cortex and amygdala. Alcohol Clin Exp Res. 2006;30:1678–1692. doi: 10.1111/j.1530-0277.2006.00203.x. [DOI] [PubMed] [Google Scholar]
- Chronik B, Alejski A, Rutt BK. Design and fabrication of a three-axis multilayer gradient coil for magnetic resonance microscopy of mice. MAGMA. 2000;10:131–146. doi: 10.1007/BF02601848. [DOI] [PubMed] [Google Scholar]
- Davila MD, Shear PK, Lane B, Sullivan EV, Pfefferbaum A. Mammillary body and cerebellar shrinkage in chronic alcoholics: an MRI and neuropsychological study. Neuropsychology. 1994;8:433–444. [Google Scholar]
- Dlugos CA, Pentney RJ. Morphometric evidence that the total number of synapses on Purkinje neurons of old F344 rats is reduced after long-term ethanol treatment and restored to control levels after recovery. Alcohol Alcohol. 1997;32:161–172. doi: 10.1093/oxfordjournals.alcalc.a008250. [DOI] [PubMed] [Google Scholar]
- Fein G, Di Sclafani V, Cardenas VA, Goldmann H, Tolou-Shams M, Meyerhoff DJ. Cortical gray matter loss in treatment-naive alcohol dependent individuals. Alcohol Clin Exp Res. 2002;26:558–564. [PMC free article] [PubMed] [Google Scholar]
- Fein G, Landman B. Treated and treatment-naive alcoholics come from different populations. Alcohol. 2005;35:19–26. doi: 10.1016/j.alcohol.2004.10.007. [DOI] [PubMed] [Google Scholar]
- Harper C, Butterworth R. In: Nutritional and metabolic disorders, in Greenfield's Neuropathology. Graham DI, Lantos PL, editors. Arnold; London: 1997. pp. 601–642. [Google Scholar]
- Jernigan TL, Butters N, DiTraglia G, Schafer K, Smith T, Irwin M, Grant I, Schuckit M, Cermak L. Reduced cerebral grey matter observed in alcoholics using magnetic resonance imaging. Alcohol Clin Exp Res. 1991;15:418–427. doi: 10.1111/j.1530-0277.1991.tb00540.x. [DOI] [PubMed] [Google Scholar]
- Jordan LR, Zelaya FO, Rose SE, Bower AJ, Galloway G, Wholohan T, Nixon PF. Changes in the hippocampus induced by glucose in thiamin deficient rats detected by MRI. Brain Res. 1998;791:347–351. doi: 10.1016/s0006-8993(98)00203-0. [DOI] [PubMed] [Google Scholar]
- Kang SS, Cole M, Lee S, Rivier C. Development of individual alcohol inhalation chambers for mice: validation in a model of prenatal alcohol. Alcohol Clin Exp Res. 2004;28:1549–1556. doi: 10.1097/01.alc.0000141639.79278.5e. [DOI] [PubMed] [Google Scholar]
- Lee S, Schmidt D, Tilders F, Cole M, Smith A, Rivier C. Prolonged exposure to intermittent alcohol vapors blunts hypothalamic responsiveness to immune and non-immune signals. Alcohol Clin Exp Res. 2000;24:110–122. [PubMed] [Google Scholar]
- Li TK, Lumeng L, McBride WJ, Waller MB. Progress toward a voluntary oral consumption model of alcoholism. Drug Alcohol Depend. 1979;4:45–60. doi: 10.1016/0376-8716(79)90040-1. [DOI] [PubMed] [Google Scholar]
- Lopez MF, Becker HC. Effect of pattern and number of chronic ethanol exposures on subsequent voluntary ethanol intake in C57BL/6J mice. Psychopharmacology (Berl) 2005;181:688–696. doi: 10.1007/s00213-005-0026-3. [DOI] [PubMed] [Google Scholar]
- Lu W, Jaatinen P, Rintala J, Sarviharju M, Kiianmaa K, Hervonen A. Effects of lifelong ethanol consumption on rat locus coeruleus. Alcohol Alcohol. 1997;32:463–470. doi: 10.1093/oxfordjournals.alcalc.a008281. [DOI] [PubMed] [Google Scholar]
- McBride WJ, Li TK. Animal models of alcoholism: neurobiology of high alcohol-drinking behavior in rodents. Crit Rev Neurobiol. 1998;12:339–369. doi: 10.1615/critrevneurobiol.v12.i4.40. [DOI] [PubMed] [Google Scholar]
- O'Dell LE, Roberts AJ, Smith RT, Koob GF. Enhanced alcohol self-administration after intermittent versus continuous alcohol vapor exposure. Alcohol Clin Exp Res. 2004;28:1676–1682. doi: 10.1097/01.alc.0000145781.11923.4e. [DOI] [PubMed] [Google Scholar]
- Oscar-Berman M, Marinkovic K. Alcohol: effects on neurobehavioral functions and the brain. Neuropsychol Rev. 2007;17:239–257. doi: 10.1007/s11065-007-9038-6. [DOI] [PMC free article] [PubMed] [Google Scholar]
- Pentney RJ, Alletto JJ, Acara MA, Dlugos CA, Fiel RJ. Small animal magnetic resonance imaging: a means of studying the development of structural pathologies in the rat brain. Alcohol Clin Exp Res. 1993;17:1301–1308. doi: 10.1111/j.1530-0277.1993.tb05245.x. [DOI] [PubMed] [Google Scholar]
- Pentney RJ, Dlugos CA. Cerebellar Purkinje neurons with altered terminal dendritic segments are present in all lobules of the cerebellar vermis of ageing, ethanol- treated F344 rats. Alcohol Alcohol. 2000;35:35–43. doi: 10.1093/alcalc/35.1.35. [DOI] [PubMed] [Google Scholar]
- Pentney RJ, Quackenbush LJ. Dendritic hypertrophy in Purkinje neurons of old Fischer 344 rats after long-term ethanol treatment. Alcohol Clin Exp Res. 1990;14:878–886. doi: 10.1111/j.1530-0277.1990.tb01831.x. [DOI] [PubMed] [Google Scholar]
- Pfefferbaum A, Adalsteinsson E, Sood R, Mayer D, Bell R, McBride WJ, Li T-K, Sullivan EV. Part II: Longitudinal brain MRI study of the alcohol-preferring rat: effects of voluntary chronic alcohol consumption. Alcohol Clin Exp Res. 2006a;30:1248–1261. doi: 10.1111/j.1530-0277.2006.00146.x. [DOI] [PubMed] [Google Scholar]
- Pfefferbaum A, Adalsteinsson E, Sullivan EV. In vivo structural imaging of the rat brain with a 3T clinical human scanner. 2004a;20:779–785. doi: 10.1002/jmri.20181. 1053-1807. [DOI] [PubMed] [Google Scholar]
- Pfefferbaum A, Adalsteinsson E, Sullivan EV. Dysmorphology and microstructural degradation of the corpus callosum: interaction of age and alcoholism. Neurobiol Aging. 2006b;27:994–1009. doi: 10.1016/j.neurobiolaging.2005.05.007. [DOI] [PubMed] [Google Scholar]
- Pfefferbaum A, Lim KO, Zipursky RB, Mathalon DH, Rosenbloom MJ, Lane B, Ha CN, Sullivan EV. Brain gray and white matter volume loss accelerates with aging in chronic alcoholics: a quantitative MRI study. Alcohol Clin Exp Res. 1992;16:1078–1089. doi: 10.1111/j.1530-0277.1992.tb00702.x. [DOI] [PubMed] [Google Scholar]
- Pfefferbaum A, Rosenbloom MJ, Serventi K, Sullivan EV. Corpus callosum, pons and cortical white matter in alcoholic women. Alcohol Clin Exp Res. 2002;26:400–405. [PubMed] [Google Scholar]
- Pfefferbaum A, Sullivan EV, Adalsteinsson E, Garrick T, Harper C. Postmortem MR imaging of formalin-fixed human brain. NeuroImage. 2004b;21:1585–1595. doi: 10.1016/j.neuroimage.2003.11.024. [DOI] [PubMed] [Google Scholar]
- Pfefferbaum A, Sullivan EV, Mathalon DH, Lim KO. Frontal lobe volume loss observed with magnetic resonance imaging in older chronic alcoholics. Alcohol Clin Exp Res. 1997;21:521–529. doi: 10.1111/j.1530-0277.1997.tb03798.x. [DOI] [PubMed] [Google Scholar]
- Pfefferbaum A, Sullivan EV, Rosenbloom MJ, Mathalon DH, Lim KO. A controlled study of cortical gray matter and ventricular changes in alcoholic men over a five year interval. Arch Gen Psychiatry. 1998;55:905–912. doi: 10.1001/archpsyc.55.10.905. [DOI] [PubMed] [Google Scholar]
- Pitkin SR, Savage LM. Aging potentiates the acute and chronic neurological symptoms of pyrithiamine-induced thiamine deficiency in the rodent. Behav Brain Res. 2001;119:167–177. doi: 10.1016/s0166-4328(00)00350-8. [DOI] [PubMed] [Google Scholar]
- Rintala J, Jaatinen P, Lu W, Sarviharju M, Eriksson CJ, Laippala P, Kiianmaa K, Hervonen A. Effects of lifelong ethanol consumption on cerebellar layer volumes in AA and ANA rats. Alcohol Clin Exp Res. 1997;21:311–317. [PubMed] [Google Scholar]
- Roberts AJ, Heyser CJ, Cole M, Griffin P, Koob GF. Excessive ethanol drinking following a history of dependence: animal model of allostasis. Neuropsychopharmacology. 2000;22:581–594. doi: 10.1016/S0893-133X(99)00167-0. [DOI] [PubMed] [Google Scholar]
- Rodd ZA, Bell RL, Sable HJ, Murphy JM, McBride WJ. Recent advances in animal models of alcohol craving and relapse. Pharmacol Biochem Behav. 2004;79:439–450. doi: 10.1016/j.pbb.2004.08.018. [DOI] [PubMed] [Google Scholar]
- Rohlfing T, Maurer CR. Nonrigid image registration in shared-memory multiprocessor environments with application to brains, breasts, and bees. IEEE Trans Inf Technol Biomed. 2003;7:16–25. doi: 10.1109/titb.2003.808506. [DOI] [PubMed] [Google Scholar]
- Rohlfing T, Sullivan EV, Pfefferbaum A. Deformation-based brain morphometry to track the course of alcoholism: differences between intra-subject and inter-subject analysis. Psychiatry Res: Neuroimag. 2006;146:157–170. doi: 10.1016/j.pscychresns.2005.12.002. [DOI] [PubMed] [Google Scholar]
- Rohlfing T, Zahr NM, Sullivan EV, Pfefferbaum A. The SRI24 multichannel brain atlas: construction and applications. In: Reinhardt JM, Pluim JPW, editors. Medical Imaging 2008: Image Processing. Vol. 6914. Bellingham, WA: 2008. Proceedings of SPIE. [Google Scholar]
- Savage LM, Candon PM, Hohmann HL. Alcohol-induced brain pathology and behavioral dysfunction: using an animal model to examine sex differences. Alcohol Clin Exp Res. 2000;24:465–475. [PubMed] [Google Scholar]
- Shear PK, Sullivan EV, Lane B, Pfefferbaum A. Mammillary body and cerebellar shrinkage in chronic alcoholics with and without amnesia. Alcohol Clin Exp Res. 1996;20:1489–1495. doi: 10.1111/j.1530-0277.1996.tb01153.x. [DOI] [PubMed] [Google Scholar]
- Sullivan EV. Compromised pontocerebellar and cerebellothalamocortical systems: speculations on their contributions to cognitive and motor impairment in nonamnesic alcoholism. Alcohol Clin Exp Res. 2003;27:1409–1419. doi: 10.1097/01.ALC.0000085586.91726.46. [DOI] [PubMed] [Google Scholar]
- Sullivan EV, Adalsteinsson E, Sood R, Mayer D, Bell RL, McBride WJ, Li T-K, Pfefferbaum A. Part I: Longitudinal brain MRI brain study of the alcohol-preferring (P) rat: adult brain growth. Alcohol Clin Exp Res. 2006;30:1234–1247. doi: 10.1111/j.1530-0277.2006.00145.x. [DOI] [PubMed] [Google Scholar]
- Sullivan EV, Deshmukh A, Desmond JE, Lim KO, Pfefferbaum A. Cerebellar volume decline in normal aging, alcoholism, and Korsakoff's syndrome: relation to ataxia. Neuropsychology. 2000a;14:341–352. doi: 10.1037//0894-4105.14.3.341. [DOI] [PubMed] [Google Scholar]
- Sullivan EV, Deshmukh A, Desmond JE, Mathalon DH, Rosenbloom MJ, Lim KO, Pfefferbaum A. Contribution of alcohol abuse to cerebellar volume deficits in men with schizophrenia. Arch Gen Psychiatry. 2000b;57:894–902. doi: 10.1001/archpsyc.57.9.894. [DOI] [PubMed] [Google Scholar]
- Sullivan EV, Marsh L. Hippocampal volume deficits in alcoholic Korsakoff's syndrome. Neurology. 2003;61:1716–1719. doi: 10.1212/01.wnl.0000098940.31882.bb. [DOI] [PubMed] [Google Scholar]
- Sullivan EV, Marsh L, Mathalon DH, Lim KO, Pfefferbaum A. Anterior hippocampal volume deficits in nonamnesic, aging chronic alcoholics. Alcohol Clin Exp Res. 1995;19:110–122. doi: 10.1111/j.1530-0277.1995.tb01478.x. [DOI] [PubMed] [Google Scholar]
- Sullivan EV, Pfefferbaum A. Neurocircuitry in alcoholism: a substrate of disruption and repair. Psychopharmacology (Berl) 2005;180:583–594. doi: 10.1007/s00213-005-2267-6. [DOI] [PubMed] [Google Scholar]
- Sullivan EV, Rosenbloom MJ, Serventi KL, Deshmukh A, Pfefferbaum A. The effects of alcohol dependence comorbidity and anti-psychotic medication on volumes of the thalamus and pons in schizophrenia. Am J Psychiatry. 2003;160:1110–1116. doi: 10.1176/appi.ajp.160.6.1110. [DOI] [PubMed] [Google Scholar]
- Thomson AD, Cook CC, Touquet R, Henry JA. The Royal College of Physicians report on alcohol: guidelines for managing Wernicke's encephalopathy in the accident and Emergency Department. Alcohol Alcohol. 2002;37:513–521. doi: 10.1093/alcalc/37.6.513. [DOI] [PubMed] [Google Scholar]
- Zelaya FO, Rose SE, Nixon PF, Wholohan BT, Bower AJ, Zimitat C, Schoutrop J, Doddrell DM. MRI demonstration of impairment of the blood-CSF barrier by glucose administration to the thiamin-deficient rat brain. Magn Reson Imaging. 1995;13:555–561. doi: 10.1016/0730-725x(95)00020-h. [DOI] [PubMed] [Google Scholar]