

Abstract
Background
Exposure to alcohol during gestation is associated with CNS alterations, cognitive deficits, and behavior problems. This study investigated microstructural aspects of putative white matter abnormalities following prenatal alcohol exposure.
Methods
Diffusion tensor imaging was used to assess white matter microstructure in 27 youth (age range: 8 to 18 years) with (n = 15) and without (n = 12) histories of heavy prenatal alcohol exposure. Voxelwise analyses, corrected for multiple comparisons, compared fractional anisotropy (FA) and mean diffusivity (MD) between groups, throughout the cerebrum.
Results
Prenatal alcohol exposure was associated with low FA in multiple cerebral areas, including the body of the corpus callosum and white matter innervating bilateral medial frontal and occipital lobes. Fewer between-group differences in MD were observed.
Conclusions
These data provide an account of cerebral white matter microstructural integrity in fetal alcohol spectrum disorders and support extant literature showing that white matter is a target of alcohol teratogenesis. The white matter anomalies characterized in this study may relate to the neurobehavioral sequelae associated with gestational alcohol exposure, especially in areas of executive dysfunction and visual processing deficits.
Keywords: alcohol, diffusion tensor imaging, FAS, frontal lobe, prenatal alcohol exposure
Introduction
The continuum of effects following heavy prenatal alcohol exposure can range from perinatal mortality to Fetal Alcohol Syndrome (FAS) (Jones and Smith, 1973; Lemoine et al., 1968) to more subtle cognitive and physical growth detriments. Cognitive dysfunction associated with prenatal alcohol exposure may occur independently of the physical growth deficiency and craniofacial features required to diagnose FAS (e.g., Mattson et al., 1998; Streissguth and O'Malley, 2000). Accordingly, use of the term Fetal Alcohol Spectrum Disorders (FASDs) reflects the variable and continuous nature of the sequelae associated with fetal alcohol exposure (Bertrand et al., 2005). The incidence of FASDs has been estimated at 9 per 1000 live births (Sampson et al., 1997).
Alcohol can exert teratogenic effects on the central nervous system (CNS) via multiple mechanisms, which may be influenced by maternal and fetal characteristics, and pattern of exposure (for review, see Goodlett et al., 2005). Structural magnetic resonance imaging (MRI) has revealed that not all brain structures are equally vulnerable to the effects of prenatal alcohol exposure; for example, the corpus callosum, caudate nucleus, and cerebellum appear to be disproportionately affected (for review, see Riley and McGee, 2005). Despite this complex pathology, data converge across multiple disciplines to suggest that white matter is a specific target of alcohol teratogenesis. A study of premature infants found a 9.5-fold increase in the odds of observing white matter damage, as indexed by cranial ultrasound, in subjects born to mothers who drank heavily, compared to those born to mothers who abstained or used moderate amounts of alcohol (Holzman et al., 1995). Magnetic resonance spectroscopy techniques have revealed CNS metabolic abnormalities in children with FASDs, attributable to increases in glial markers choline and creatine in several brain regions, including frontal lobe white matter and the corpus callosum (Fagerlund et al., 2006). In addition to regional vulnerabilities within the brain, there is evidence that volumetric reductions may vary by tissue type, as one volumetric MRI study of children with FASDs showed that cerebral white matter volumes were decreased beyond grey matter volume reductions (Archibald et al., 2001).
Preclinical models of prenatal alcohol exposure have identified white matter damage as well. White matter lesions have been induced in the developing sheep brain by binge exposure to alcohol in early gestation (Watari et al., 2006). The microglia-macrophage rich lesions observed in this study likely indicate inflammation and cell death. At least some of the white matter damage associated with prenatal alcohol exposure appears to specifically target axons. Rat models of fetal alcohol exposure have observed decreases in axon size, with concomitant increases in packing density, thinner myelin sheaths (Miller and Al-Rabiai, 1994), increased growth rate (Lindsley et al., 2003), and reduced conduction velocity (Miller et al., 1990). In addition to axonal damage, glial cells are vulnerable to the effects of prenatal alcohol exposure. For example, oligodendrocytes from alcohol-exposed rats were morphologically aberrant, decreased in number, and showed lower expression levels of markers important for myelination, including myelin basic protein (Chiappelli et al., 1991).
Diffusion tensor imaging (DTI) is an MRI technique that can be used to study white matter pathology. Within white matter of the brain, diffusion of water molecules is restricted by microstructural barriers (Moseley et al., 2002). The directional dependence of this diffusion can be estimated by acquiring a collection of images with different diffusion sensitivities, and then modeling the directional dependence of the signal in each voxel, based on a Gaussian model for diffusion. Though there are several measurements that can be derived from DTI analysis, two of the most common are 1) mean diffusivity (MD), which is the average of the eigenvalues of the diffusion tensor and 2) fractional anisotropy (FA). MD is an estimate of local diffusion of water molecules, averaged across space, while FA is a normalized variance of the eigenvalues of the diffusion tensor. FA ranges from 0 to 1, with values closer to 0 characterizing more isotropic diffusion and values closer to 1 characterizing more anisotropic diffusion (Basser and Pierpaoli, 1996). Thus, within white matter, which is expected to be highly organized, high MD and low FA values are typically interpreted as reflecting compromised tissue integrity. Research on both chronic alcoholism (Pfefferbaum and Sullivan, 2002; Pfefferbaum et al., 2000) and prenatal alcohol exposure (Ma et al., 2005) have suggested that, at least in some cases, microstructural integrity as revealed by DTI may be more sensitive to alcohol-induced white matter damage than traditional structural neuroimaging.
DTI studies of FASDs have revealed poor fiber integrity in the corpus callosum (CC), the brain's largest white matter tract, providing further support that alcohol exerts damaging effects on developing white matter. CC diffusion alterations have been localized to the lateral splenium (Sowell et al., 2008a), isthmus (Wozniak et al., 2006), and to the genu and splenium (Ma et al., 2005; Lebel et al., 2008). Differences across studies in participant age and amount and pattern of alcohol exposure may account for the discrepancy within subregional localization, though the consensus of findings suggests that fiber integrity within the CC is altered following gestational alcohol exposure. Global investigation of white matter microstructure is warranted to further characterize diffusion-related changes, as one recent DTI study in this population showed FA deficits in white matter innervating posterior cortical regions (Sowell et al., 2008a) and an initial tractography study is suggestive of microstructural abnormalities extending well beyond the CC (Lebel et al., 2008). Therefore, the aim of the present study was to use a voxelwise approach to characterize cerebral white matter microstructure (as indexed by FA and MD) in a sample of youth with FASDs. In addition, based on previous literature identifying the CC as a specific target of alcohol teratogenesis, we evaluated the CC using an ROI approach. We expected that prenatal alcohol exposure would be associated with low FA and high MD in cerebral white matter compared with typical development.
Methods
Subject Recruitment and Inclusion
Study participants were children with histories of heavy prenatal alcohol exposure (ALC; n=15) and typically developing controls (CON; n=12). The sample was recruited from a cohort of children being followed by the Center for Behavioral Teratology, San Diego State University. Study inclusion criteria were: age range 8 to 18, right-handed, and English fluency. Exclusion criteria were: history of head trauma, contraindication for MRI, or medical conditions that could interfere with the neuroimaging procedure.
All subjects in the ALC group had histories of heavy prenatal alcohol exposure. Because the sample was recruited retrospectively, exact dose and timing of maternal alcohol consumption is not known. However, in order to be included in the study, documentation of an abusive pattern of maternal alcohol consumption was required, and mothers consumed a minimum of 4 drinks per occasion at least once per week or 14 drinks per week during pregnancy. Children in the alcohol-exposed group were evaluated by a dysmorphologist with expertise in alcohol teratogenesis (Kenneth Lyons Jones, MD). Multimodal examination was based on physical measurements (e.g., pre- and or postnatal growth measures), craniofacial structure analysis (e.g., evaluation of palpebral fissures, philtrum, vermillion), alcohol exposure history, and historical record review. Nine of the children in the ALC group met criteria for FAS (Bertrand et al., 2005; Jones and Smith, 1973). Alcohol-exposed subjects were referred by medical providers, or were self-referred. Comparison children were recruited via community outreach, and were selected to be demographically similar to ALC participants on age, socioeconomic status (SES), and sex. The groups were not matched on IQ, as heavy prenatal alcohol exposure is associated with impaired intelligence (for review, see Mattson & Riley, 1998), and IQ matching might produce a nonrepresentative sample. About one third of the youth screened for the study were ineligible, most commonly for metallic dental work. Intelligence testing was conducted using the Wechsler Intelligence Scale for Children, III (Wechsler, 1991), and the IQ scores of study participants ranged from 61-105 (ALC) and 73-128 (CON). See Table 1 for subject demographic characteristics.
Table 1.
Sample demographics for youth in the alcohol-exposed (ALC) and non-exposed control (CON) groups
| ALC (M±SD) | CON (M±SD) | p | |
|---|---|---|---|
| N | 15 | 12 | |
| Age (years) | 13.85 ± 3.11 | 13.18 ± 2.94 | n.s.* |
| Sex (% female) | 33 | 50 | n.s. |
| Race (% Caucasian) | 73 | 58 | n.s. |
| SES§ | 48.63 ± 9.18 | 52.29 ± 13.23 | n.s. |
| IQ† | 87.79 ± 11.54 | 106.75 ± 14.90 | 0.001 |
| Cranial Volume (cm3) | 1229.67 ± 137.07 | 1325.15 ± 153.22 | n.s. |
| Grey + White tissue Volume (cm3) | 1076 .78 ± 142.28 | 1173.32 ± 144.67 | n.s. |
n.s. = non-significant (p > 0.05)
SES: Socioeconomic status as determined by Hollingshead's Four Factor Index.
IQ measured with Wechsler Intelligence Scale for Children
Neuroimaging Procedures
Informed consent was obtained via protocols approved by the Institutional Review Boards of San Diego State University and University of California, San Diego (UCSD). Brain images were acquired at the UCSD Center for Functional MRI on a General Electric 3.0 tesla magnet using an 8-channel gradient head coil. A high-resolution anatomical scan was collected for co-registration with the diffusion protocol: fast spoiled gradient sequence, TR = 8000 ms, TE = 3.1 ms, flip angle = 12 degrees, 256 × 192 matrix, 1 millimeter (mm) slice thickness, 24 centimeter (cm) field of view (FOV), acquisition time = 7 minutes, 24 seconds. Diffusion was encoded with a high angular resolution echo planar imaging sequence along 15 diffusion directions with b = 2000 s/mm2 and 4 averages. A dual spin echo preparation was used to mitigate the effects of eddy currents (Reese et al., 2003). Image parameters for the DTI sequence were: TR = 12000 ms, TE = 93.4 ms, 128 × 128 matrix, FOV = 24 cm, 31 slices covering cerebral white matter, in-plane resolution = 1.875 mm2, acquisition time approximately 14 minutes.
Data Analysis
Analysts blind to group classification processed diffusion data using Analysis of Functional NeuroImages (AFNI) software (Cox, 1996; Cox and Hyde, 1997) and software from the Oxford Centre for Functional Magnetic Resonance Imaging of the Brain software library (FSL) (Smith et al., 2004). Fieldmaps, collected at the time of scanning, were applied to the diffusion images, in order to mitigate geometric distortion due to susceptibility artifact. Image preprocessing included eddy current distortion correction using a 2-dimensional 6-degree of freedom model, motion correction via a 6-degree of freedom affine registration of the diffusion directions to the b = 0 image, and visual inspection of data for gross artifact (data from 2 ALC and 2 CON subjects were not included in the reported sample of 27 subjects due to movement artifact). FA and MD values were derived from the non-linear estimation of the diffusion tensor model (AFNI: 3dDWItoDT), and a whole-brain mask was applied to the diffusion dataset in order to mitigate extraneous non-brain signal.
Upon completion of individual image processing, FA and MD maps were analyzed using FSL's Tract Based Spatial Statistics (TBSS) (Smith et al., 2006), a voxelwise approach to diffusion data analysis. TBSS, which aligns individual data into common space via a non-linear registration algorithm, was chosen for this study in part because standard registration processes can prove problematic when applied to brain images from pediatric and clinical populations. More specifically, TBSS uses nonlinear transformation to first align subject images to a representative target image and then achieves affine-alignment to a standard space, using the MNI-152 template. The transformed data are next averaged to create a mean FA (or MD) image, and then a tract skeleton of the mean image is computed, which represents the center of each white matter tract, common to all images. Finally, to mitigate problems due to poor alignment of individual images, each participant's aligned image is projected onto the mean skeleton. Planned between-group comparisons (ALC versus CON) examining voxelwise cerebral FA and MD values within the TBSS skeleton were conducted using independent samples t-tests. Type I error was controlled at an experiment-wise alpha rate of 0.05 by setting both a voxel significance threshold (p<0.05) and a cluster volume threshold, which was determined via a Monte-Carlo simulation based algorithm (Forman et al., 1995). Based on the overall volume of analysis and a 1mm connectivity radius, the threshold used to define clusters was 34 mm3 for the whole brain analysis and 23 mm3 for the CC region-of-interest analysis. Neuroanatomical regions surviving threshold were identified manually using a white matter atlas of the brain (Mori et al., 2005). The high resolution anatomical image of each participant was processed via FSL's brain extraction and automated segmentation tools (Smith, 2002; Zhang et al., 2001) and whole-brain voxel counts were conducted using AFNI's 3dROIstats function (Cox, 1996; Cox and Hyde, 1997). Whole brain volume estimates are presented by group in Table 1.
Results
Between-group Comparison of Cerebral White Matter FA
Voxelwise comparison revealed cerebral loci showing significantly lower FA in alcohol-exposed participants, compared to their typically developing peers, including bilateral portions of the anterior and posterior coronae radiatae. More specifically, FA was significantly lower in the ALC than CON group in regions in the frontal lobes (e.g., right superior longitudinal, uncinate, and fronto-occipital fasciculi, bilateral anterior/superior coronae radiatae), parietal lobes (e.g., right superior longitudinal fasciculus, left posterior corona radiata) and occipital lobes (e.g., bilateral posterior coronae radiatae and forceps major). Findings were most prominent in medial portions of the frontal and occipital lobes. Additionally, a region-of-interest analysis focused on the CC revealed abnormally low FA in the CC body of the ALC group. Although the majority of clusters were in the direction of lower FA in ALC compared to CON, three clusters showed the opposite pattern. These findings were located along the right posterior limb of the internal capsule and cingulum, on the CC border. Table 2 summarizes regions showing between-group FA differences. See Figure 1 for select regions of between-group FA differences.
Table 2.
Regions of significant FA differences between alcohol-exposed (ALC) and non-exposed control (CON) groups (n = 27, p<0.05, corrected)
| # | Location | White Matter Tract | Cohen's d | Cluster Volume (mm3) |
|---|---|---|---|---|
| Regions Showing Decreased FA in ALC Group Compared to CON | ||||
| 1 | R Occipital Lobe |
R Posterior Corona Radiata, Forceps Major |
1.54 | 388 |
| 2 | R Temporo-parieto- occipital Junction |
R Posterior Corona Radiata, Sagittal Stratum |
1.57 | 245 |
| 3 | L Superior Frontal Lobe |
L Anterior Corona Radiata/ Superior Corona Radiata |
1.40 | 119 |
| 4 | L Occipital Lobe | L Forceps Major | 1.38 | 105 |
| 5 | L Occipital Lobe | L Forceps Major | 1.27 | 79 |
| 6 | L Temporo-occiptal Junction |
L Posterior Corona Radiata, Sagittal Stratum |
1.22 | 57 |
| 7 | R Parietal Lobe | R Superior Longitudinal Fasciculus | 1.32 | 57 |
| 8 | R Superior Frontal Lobe |
R Anterior Corona Radiata/ Superior Corona Radiata |
1.21 | 50 |
| 9 | L Inferior Parietal Lobe |
L Posterior Corona Radiata | 1.12 | 47 |
| 10 | L Superior Frontal Lobe |
L Superior Corona Radiata | 1.10 | 47 |
| 11 | R Inferior Frontal Lobe |
R Uncinate Fasciculus | 1.26 | 44 |
| 12 | R Lateral Frontal Lobe |
R Superior Longitudinal Fasciculus | 1.22 | 44 |
| 13 | L Occipital Lobe | L Posterior Corona Radiata | 1.12 | 40 |
| 14 | R Lateral Frontal Lobe |
R Uncinate Fasciculus, Fronto- Occipital Fasciculus |
1.32 | 36 |
| 15 | L Superior Frontal Lobe |
L Anterior Corona Radiata/ Superior Corona Radiata |
1.10 | 36 |
| 16 | L Frontal Lobe | L Anterior Corona Radiata | 1.09 | 34 |
| 17 | Corpus Callosum Body |
Corpus Callosum | 1.27 | 24 |
| Regions Showing Decreased FA in CON Group, Compared to ALC | ||||
| 18 | R Subcortex | R Posterior Limb of Internal Capsule | −1.70 | 85 |
| 19 | R Subcortex | R Posterior Limb of Internal Capsule | −1.36 | 34 |
| 20 | R Cingulate Gyrus | R Cingulum | −0.98 | 34 |
Figure 1.
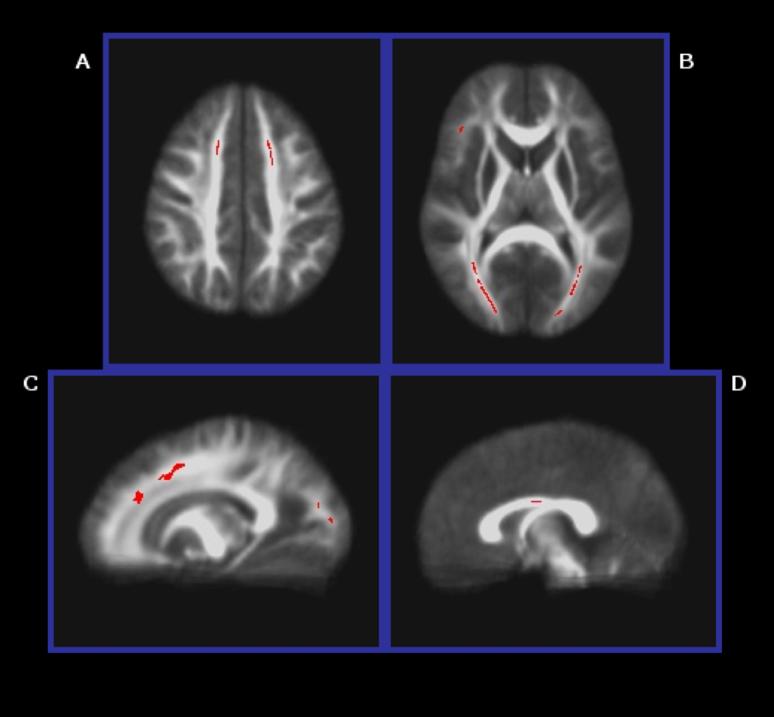
Selected areas (p<0.05, corrected) of lower FA in the ALC group than the CON group: A) bilateral anterior/superior coronae radiatae, B) bilateral posterior coronae radiatae and forceps major, and right uncinate/inferior fronto-occipital fasciculi, C) left anterior/superior corona radiata, posterior corona radiata, and forceps major, and D) body of the CC.
Evaluation of Age Effects on Between-group FA Differences
Pearson's correlation coefficients were used to quantify the relationship between FA and participant age. Mean FA values in the regions identified in the previous analysis were extracted for each individual. No significant correlations were observed between FA and participant age (−0.38<r<0.25; 0.05<p's<0.90), providing some evidence that the group differences in FA observed in this sample are independent of participant age.
Evaluation of FAS Diagnosis on FA Values
In an effort to examine the effect of FAS diagnosis on the present study's findings, analysis of variance (ANOVA) was used to examine FA in the regions identified in the original analysis across three participant groupings: CON (n = 12), and ALC subjects with (n = 9; FAS) and without (n = 6; nondysmorphic prenatal exposure to alcohol (PEA)) a diagnosis of FAS. Omnibus F tests were held to an alpha level of 0.05 and planned contrasts (FAS vs. CON, PEA vs. CON, and PEA vs. FAS) were held to an alpha of 0.017, in order to control Type I error rates. As expected based on the main between-group (CON vs. ALC) analysis described previously, omnibus effects were significant among the three participant groupings for all regions described in Table 2 (0.001<p's<0.04); however, results were non-significant at the Type I error corrected alpha level for individual contrasts comparing FA of ALC participants with and without a FAS diagnosis for all but one of the anatomical regions investigated (0.04<p's<0.82).The one exception to this pattern was within the body of the CC, where FA was significantly lower in FAS participants, compared to PEA (p = 0.01). These results suggest that for the vast majority of anatomical locations identified by the between-group (CON vs. ALC) analysis, FA values did not differ significantly between alcohol-exposed subjects with and without a FAS diagnosis. See Figure 2 for FA values plotted by participant grouping.
Figure 2.
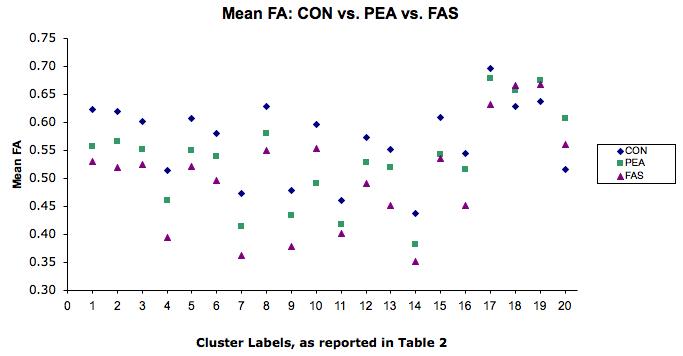
Mean FA by diagnostic category: control (CON); nondysmorphic prenatal exposure to alcohol (PEA); fetal alcohol syndrome (FAS). Note: numbers on X axis refer to regions of FA group (CON vs. ALC) differences, as labeled in Table 2.
Between-group Comparison of Cerebral White Matter MD
Voxelwise comparison revealed fewer cerebral loci showing significantly different MD in ALC vs. CON groups, compared to the FA analysis. Two areas emerged in support of our hypothesis of higher MD in ALC than CON, that were both located in the left hemisphere: one in the superior frontal lobe and another in the anterior limb of the internal capsule. Additionally, there were two between-group differences in MD that did not support our hypothesis, as these regions showed lower MD in ALC than CON. These findings were localized to the fibers within the right inferior frontal lobe and the right temporo-parieto-occipital junction.
Pearson's correlation coefficients revealed significant associations between MD and participant age in two of the regions showing between-group MD differences: 1) right temporo-parieto-occipital junction; r = −0.51, p = 0.007, and 2) left superior frontal lobe; r = −0.53, p = 0.004. We conducted post-hoc analyses to examine the influence of age on the relationship between group and MD in these regions. Age was entered into the first step of a hierarchical regression model, followed by group status (ALC or CON). For both regions, the two-step model was retained. Right temporo-parieto-occipital junction MD cluster: (F (2, 24) = 9.21; p = 0.001; Adjusted R2 = 0.39; ΔR2 = 0.18); group status was a significant predictor (p = 0.01), above and beyond participant age (p = 0.007). Left frontal MD cluster: (F (2, 24) = 19.74; p < 0.001; Adjusted R2 = 0.59; ΔR2 = 0.34); group status was a significant predictor (p < 0.001), above and beyond participant age (p < 0.001). In summary, group status remains a significant predictor of MD within these regions, after accounting for variance associated with participant age.
Lastly, we used ANOVA to investigate the impact of FAS diagnosis within the four regions showing MD differences. As expected, omnibus effects were significant among the three participant groupings for all regions described in Table 3 (0.001<p's<0.02); however, results were non-significant at the Type I error corrected alpha level for individual contrasts comparing MD of ALC participants with and without a FAS diagnosis (0.10<p's<0.79). This suggests that MD values did not differ significantly between alcohol-exposed subjects with and without a diagnosis of FAS, within the regions examined.
Table 3.
Regions of significant MD differences between alcohol-exposed (ALC) and non-exposed control (CON) groups (n = 27, p<0.05, corrected)
| Location | White Matter Tract | Cohen's d | Cluster Volume (mm3) |
|---|---|---|---|
| Regions Showing Increased MD in ALC Group Compared to CON | |||
| L Subcortex | L Internal Capsule, anterior limb | 1.61 | 39 |
| L Superior Frontal Lobe |
White matter lateral to L Anterior Corona Radiata |
1.17 | 34 |
| Regions Showing Decreased MD in ALC Group Compared to CON | |||
| R Inferior Frontal Lobe |
R Anterior Corona Radiata | −1.30 | 42 |
| R Temporo-occipito- parietal junction |
R Forceps Major | −1.04 | 38 |
Discussion
In summary, we used TBSS to conduct a voxelwise comparison of cerebral white matter microstructure in youth with and without FASDs, and observed a number of regions showing lowered FA in alcohol-exposed participants, compared to typically developing peers. Regions of between-group differences were concentrated mainly in white matter innervating the bilateral medial frontal and occipital lobes, but were also observed in inferior parietal white matter and in the body of the corpus callosum. While the majority of between-group differences indicated that FA was lower in the ALC group than CON, there were findings in the right posterior internal capsule and cingulum that showed the opposite pattern. With regard to MD, there were two regions that supported our hypothesis of higher MD in ALC than typically developing peers. MD was higher within the anterior limb of the left internal capsule, and in an area of frontal white matter located superiorly in the anterior left hemisphere. In addition, there were two regions in which MD was unexpectedly lower in ALC than CON. These regions were located along a frontal inferior portion of the right anterior corona radiata and within the right forceps major. We did not observe between-group MD differences in the CC. Auxiliary analyses provide some evidence that FA and MD findings were independent of participant age and, within the alcohol-exposed group, largely independent of FAS diagnosis.
Prominent FA deficits located bilaterally within the posterior corona radiata and forceps major of the occipital lobes suggest that prenatal alcohol exposure was associated with compromised white matter integrity in cortical areas associated with visual processing. Visuospatial cognition is impaired in individuals with FASDs (Mattson and Riley, 1998), and fetal alcohol exposure is associated with marked ocular abnormality and visual deficit, including optic nerve hypoplasia, decreased visual acuity, abnormal retinal vasculature and strabismus (Stromland, 2004). In addition to sensory organ damage, there is evidence that the visual system is disrupted at a cortical level. Preclinical models have shown that gestational alcohol exposure can disrupt ocular dominance plasticity (Medina et al., 2003), cortical column organization and orientation selectivity in the visual cortex of the ferret; these effects are not driven by decreased visual neuronal response as would be expected if damage were solely ocular (Medina et al., 2005). Despite findings of occipital damage in experimental models, volumetric studies of human brain structure have not identified the occipital lobes as targets of alcohol teratogenesis, beyond global microcephaly. However, a study of cortical thickness observed a relationship in typically developing comparison subjects between cortical thinning in left occipital regions and better performance on a visuospatial test that was not observed in the alcohol-exposed group, which may be reflective of abnormal pruning and myelination processes in areas important for processing visual information (Sowell et al., 2008b).
In addition to occipital regions, several frontal loci of low FA in the ALC group were identified, mostly in superior frontal regions including bilateral anterior coronae radiatae, and the right superior longitudinal fasciculus. There was one small area of high MD in the ALC group in left superior frontal white matter pathways, further suggesting compromised fiber integrity within superior frontal regions. In addition, the high diffusivity in the anterior limb of the left internal capsule may be indicative of alterations in frontal-subcortical connectivity. Executive dysfunction is well described in the neurobehavioral literature on fetal alcohol effects (for review, see Mattson et. al, 2008). Moreover, at least some EF deficits, such as those in set shifting and aspects of working memory, are associated with FASDs independently of IQ, and thus may represent direct consequences of prenatal alcohol exposure rather than effects mediated through general intellectual detriment (Connor et al., 2000). Our findings suggest that fiber integrity within regions of the frontal lobes is compromised and this may help to explain the behavioral profile of individuals with FASDs. Also, there was an area of low FA located in the right inferior frontal cortex, which included the frontal-occipital fasciculus, comprised of fibers thought to support spatial cognition (Schmahmann and Pandya, 2006). Poor fiber integrity in this region may relate to visuospatial processing and visuospatial attention deficits in affected individuals. Findings in inferior parietal regions, including the right superior longitudinal fasciculus, may also contribute to visuospatial deficits, including spatial working memory impairment, in this population. Interestingly, inferior parietal regions are thought to be specifically vulnerable to alcohol teratogenesis, with reports of parietal lobe hypoplasia occurring above and beyond reduced total brain volume (Archibald et al., 2001) and inferior parietal shape abnormalities (Sowell et al., 2002). Taken together, there is convergent evidence that alcohol teratogenesis is associated with disruption of fronto-parietal integrity.
We also noted low FA in the body of the CC, although the location of the difference diverges from previous DTI studies in this population, in which differences were observed in the genu and splenium (Ma et al., 2005; Lebel et al., 2008), isthmus (Wozniak et al., 2006), and lateral splenium (Sowell et al., 2008a). At a relaxed significance threshold of p = 0.07, the between group FA differences observed in the present study extend from the CC body posteriorly to the isthmus, indicating a subthreshold effect of compromised fiber integrity within the posterior CC. This is consistent with macrostructural studies that have implicated the posterior CC as a target of alcohol teratogenesis (Sowell et al., 2001). It is possible that variability among CC-related diffusion findings reflects sampling differences across studies. However, variable CC effects have been suggested in both clinical and preclinical literature (Bookstein et al., 2002; Miller et al., 1999). Examination of the effect of diagnosis within the alcohol-exposed group (FAS vs. PEA) revealed that the CC was the sole region that differed from the consensus of findings that FA and MD did not differ significantly from alcohol-exposed subjects with and without a diagnosis of FAS. Rather, within the body of the CC, participants with FAS had lower FA than non-dysmorphic alcohol-exposed subjects. This finding may provide further evidence for the notion that alcohol-induced effects within the CC are especially variable.
Though the majority of between-group differences were in the direction of lower FA in ALC than CON, the opposite pattern occurred in the posterior limb of the right internal capsule and cingulum. Similarly, we found two regions, located in the right anterior corona radiata and forceps major, in which MD was unexpectedly lower in ALC than CON. Typically, higher FA and lower MD values are interpreted to indicate more coherent fiber structure. Accordingly, regions of abnormally low anisotropy have been associated with numerous developmental psychopathological conditions, including ADHD, generalized developmental delay, autism and fragile X syndrome (for review, see Cascio et al., 2007). Thus, it is possible that regions of high FA or low MD in the ALC group reflect sparing, or even compensation. Alternatively, abnormally high FA can also be present in fiber bundles where crossing fibers have been deleted by disease or trauma (Virta et al., 1999). Restricted diffusion within in white matter in clinical compared to typically developing control groups is not necessarily an indication of optimal cognition. For example, a recent clinical DTI study observed abnormally high FA in the right superior longitudinal fasciculus in association with visuospatial deficits in individuals with Williams syndrome (Hoeft et al., 2007).
This study is limited by several factors. Our sample size is small and so results, particularly regarding negative effects, must be considered in light of this fact. Owing to this limitation, the comparable findings between alcohol-exposed youth with and without a diagnosis of FAS ought to be considered preliminary, until replicated with a larger sample size. In addition, youth with FASDs may be at risk for developing white matter damage from etiological sources other than (or in addition to) gestational alcohol exposure. It is possible that uncontrolled factors in this study, such as IQ differences, or factors not assessed such as childhood trauma, contributed to the observed group differences in fiber integrity. Another limitation rests on our relatively high functioning ALC sample, which did not differ from our CON group on total brain volume. Indeed, only one child in our ALC sample had an IQ <70. Though we did not exclude participants on the basis of IQ, the demands of the lengthy scan acquisition protocol may have inadvertently discouraged participation of individuals with lower IQ scores. These factors may limit the generalizability of these findings to other individuals with histories of heavy prenatal alcohol exposure. Given this limitation, it is possible that the findings presented in this study are a conservative account of the microstrutural white matter abnormalities associated with FASDs. Despite these limitations, this study's characterization of cerebral fiber structure in the context of prenatal alcohol exposure points to various loci of compromised white matter integrity, particularly in frontal and occipital regions. Future studies should seek to build upon the findings of the present study by identifying cognitive performance correlates of the cerebral white matter microstructural alterations described herein.
Acknowledgments
Research supported by National Institute on Alcohol Abuse and Alcoholism: R01 AA010417, T32 AA013525 to EPR, R01 AA010820 to SNM, and F31 AA016051 to SLF.
The authors thank Greg Balls for image field map application development, Kristina Hubbard for assistance with subject recruitment, and the participants of the study and their families.
References
- Archibald SL, Fennema-Notestine C, Gamst A, Riley EP, Mattson SN, Jernigan TL. Brain dysmorphology in individuals with severe prenatal alcohol exposure. Dev Med Child Neurol. 2001;43:148–154. [PubMed] [Google Scholar]
- Basser PJ, Pierpaoli C. Microstructural and physiological features of tissues elucidated by quantitative-diffusion-tensor MRI. J Magn Reson B. 1996;111:209–219. doi: 10.1006/jmrb.1996.0086. [DOI] [PubMed] [Google Scholar]
- Bertrand J, Floyd LL, Weber MK. Guidelines for identifying and referring persons with fetal alcohol syndrome. MMWR Recomm Rep. 2005;54:1–14. [PubMed] [Google Scholar]
- Bookstein FL, Sampson PD, Connor PD, Streissguth AP. Midline corpus callosum is a neuroanatomical focus of fetal alcohol damage. Anat Rec B New Anat. 2002;269:162–174. doi: 10.1002/ar.10110. [DOI] [PubMed] [Google Scholar]
- Cascio CJ, Gerig G, Piven J. Diffusion tensor imaging: application to the study of the developing brain. J Am Acad Child Adolesc Psychiatry. 2007;46:213–223. doi: 10.1097/01.chi.0000246064.93200.e8. [DOI] [PubMed] [Google Scholar]
- Chiappelli F, Taylor AN, Espinosa de los Monteros A, de Vellis J. Fetal alcohol delays the developmental expression of myelin basic protein and transferrin in rat primary oligodendrocyte cultures. Int J Dev Neurosci. 1991;9:67–75. doi: 10.1016/0736-5748(91)90074-v. [DOI] [PubMed] [Google Scholar]
- Connor PD, Sampson PD, Bookstein FL, Barr HM, Streissguth AP. Direct and indirect effects of prenatal alcohol damage on executive function. Dev Neuropsychol. 2000;18:331–354. doi: 10.1207/S1532694204Connor. [DOI] [PubMed] [Google Scholar]
- Cox RW. AFNI: software for analysis and visualization of functional magnetic resonance neuroimages. Comput Biomed Res. 1996;29:162–173. doi: 10.1006/cbmr.1996.0014. [DOI] [PubMed] [Google Scholar]
- Cox RW, Hyde JS. Software tools for analysis and visualization of fMRI data. NMR Biomed. 1997;10:171–178. doi: 10.1002/(sici)1099-1492(199706/08)10:4/5<171::aid-nbm453>3.0.co;2-l. [DOI] [PubMed] [Google Scholar]
- Fagerlund A, Heikkinen S, Autti-Ramo I, Korkman M, Timonen M, Kuusi T, Riley EP, Lundbom N. Brain metabolic alterations in adolescents and young adults with fetal alcohol spectrum disorders. Alcohol Clin Exp Res. 2006;30:2097–2104. doi: 10.1111/j.1530-0277.2006.00257.x. [DOI] [PubMed] [Google Scholar]
- Forman SD, Cohen JD, Fitzgerald M, Eddy WF, Mintun MA, Noll DC. Improved assessment of significant activation in functional magnetic resonance imaging (fMRI): use of a cluster-size threshold. Magn Reson Med. 1995;33:636–647. doi: 10.1002/mrm.1910330508. [DOI] [PubMed] [Google Scholar]
- Goodlett CR, Horn KH, Zhou FC. Alcohol teratogenesis: mechanisms of damage and strategies for intervention. Exp Biol Med (Maywood) 2005;230:394–406. doi: 10.1177/15353702-0323006-07. [DOI] [PubMed] [Google Scholar]
- Hoeft F, Barnea-Goraly N, Haas BW, Golarai G, Ng D, Mills D, Korenberg J, Bellugi U, Galaburda A, Reiss AL. More is not always better: increased fractional anisotropy of superior longitudinal fasciculus associated with poor visuospatial abilities in Williams syndrome. J Neurosci. 2007;27:11960–11965. doi: 10.1523/JNEUROSCI.3591-07.2007. [DOI] [PMC free article] [PubMed] [Google Scholar]
- Holzman C, Paneth N, Little R, Pinto-Martin J, Neonatal Brain Hemorrhage Study Team Perinatal brain injury in premature infants born to mothers using alcohol in pregnancy. Pediatrics. 1995;95:66–73. [PubMed] [Google Scholar]
- Jones KL, Smith DW. Recognition of the fetal alcohol syndrome in early infancy. Lancet. 1973;2:999–1001. doi: 10.1016/s0140-6736(73)91092-1. [DOI] [PubMed] [Google Scholar]
- Lebel C, Rasmussen C, Wyper K, Walker L, Andrew G, Yager J, Beaulieu C. Brain diffusion abnormalities in children with fetal alcohol spectrum disorder. Alcohol Clin Exp Res. doi: 10.1111/j.1530-0277.2008.00750.x. in press. [DOI] [PubMed] [Google Scholar]
- Lemoine P, Harousseau H, Borteyru J-P, Menuet J-C. Les enfants de parents alcooliques. Anomalies observees. A propos de 127 cas [Children of alcoholic parents. Abnormalities observed in 127 cases] Ouest Med. 1968;21:476–482. [Google Scholar]
- Lindsley TA, Kerlin AM, Rising LJ. Time-lapse analysis of ethanol's effects on axon growth in vitro. Brain Res Dev Brain Res. 2003;147:191–199. doi: 10.1016/j.devbrainres.2003.10.015. [DOI] [PubMed] [Google Scholar]
- Ma X, Coles CD, Lynch ME, LaConte SM, Zurkiya O, Wang D, Hu X. Evaluation of corpus callosum anisotropy in young adults with fetal alcohol syndrome according to diffusion tensor imaging. Alcohol Clin Exp Res. 2005;29:1214–1222. doi: 10.1097/01.alc.0000171934.22755.6d. [DOI] [PubMed] [Google Scholar]
- Mattson SN, Fryer SL, McGee CL, Riley EP. Fetal alcohol syndrome. In: Nelson CA, Luciana M, editors. Handbook of Developmental Cognitive Neuroscience. MIT Press; Boston, Massachusetts: 2008. pp. 643–652. [Google Scholar]
- Mattson SN, Riley EP. A review of the neurobehavioral deficits in children with fetal alcohol syndrome or prenatal exposure to alcohol. Alcohol Clin Exp Res. 1998;22:279–294. doi: 10.1111/j.1530-0277.1998.tb03651.x. [DOI] [PubMed] [Google Scholar]
- Mattson SN, Riley EP, Gramling L, Delis DC, Jones KL. Neuropsychological comparison of alcohol-exposed children with or without physical features of fetal alcohol syndrome. Neuropsychology. 1998;12:146–153. doi: 10.1037//0894-4105.12.1.146. [DOI] [PubMed] [Google Scholar]
- Medina AE, Krahe TE, Coppola DM, Ramoa AS. Neonatal alcohol exposure induces long-lasting impairment of visual cortical plasticity in ferrets. J Neurosci. 2003;23:10002–10012. doi: 10.1523/JNEUROSCI.23-31-10002.2003. [DOI] [PMC free article] [PubMed] [Google Scholar]
- Medina AE, Krahe TE, Ramoa AS. Early alcohol exposure induces persistent alteration of cortical columnar organization and reduced orientation selectivity in the visual cortex. J Neurophysiol. 2005;93:1317–1325. doi: 10.1152/jn.00714.2004. [DOI] [PubMed] [Google Scholar]
- Miller MW, Al-Rabiai S. Effects of prenatal exposure to ethanol on the number of axons in the pyramidal tract of the rat. Alcohol Clin Exp Res. 1994;18:346–354. doi: 10.1111/j.1530-0277.1994.tb00024.x. [DOI] [PubMed] [Google Scholar]
- Miller MW, Astley SJ, Clarren SK. Number of axons in the corpus callosum of the mature macaca nemestrina: increases caused by prenatal exposure to ethanol. J Comp Neurol. 1999;412:123–131. [PubMed] [Google Scholar]
- Miller MW, Chiaia NL, Rhoades RW. Intracellular recording and labeling study of corticospinal neurons in the rat somatosensory cortex: effect of prenatal exposure to ethanol. J Comp Neurol. 1990;296:1–15. doi: 10.1002/cne.902970107. [DOI] [PubMed] [Google Scholar]
- Mori S, Wakana S, Nagae-Poetscher LM, van Zijl PCM. MRI atlas of human white matter. Elsevier; Amsterdam: 2005. [Google Scholar]
- Moseley M, Bammer R, Illes J. Diffusion-tensor imaging of cognitive performance. Brain Cogn. 2002;50:396–413. doi: 10.1016/s0278-2626(02)00524-9. [DOI] [PubMed] [Google Scholar]
- Pfefferbaum A, Sullivan EV. Microstructural but not macrostructural disruption of white matter in women with chronic alcoholism. NeuroImage. 2002;15:708–718. doi: 10.1006/nimg.2001.1018. [DOI] [PubMed] [Google Scholar]
- Pfefferbaum A, Sullivan EV, Hedehus M, Adalsteinsson E, Lim KO, Moseley M. In vivo detection and functional correlates of white matter microstructural disruption in chronic alcoholism. Alcohol Clin Exp Res. 2000;24:1214–1221. [PubMed] [Google Scholar]
- Reese TG, Heid O, Weisskoff RM, Wedeen VJ. Reduction of eddy-current-induced distortion in diffusion MRI using a twice-refocused spin echo. Magn Reson Med. 2003;49:177–182. doi: 10.1002/mrm.10308. [DOI] [PubMed] [Google Scholar]
- Riley EP, McGee CL. Fetal alcohol spectrum disorders: an overview with emphasis on changes in brain and behavior. Exp Biol Med (Maywood) 2005;230:357–365. doi: 10.1177/15353702-0323006-03. [DOI] [PubMed] [Google Scholar]
- Sampson PD, Streissguth AP, Bookstein FL, Little RE, Clarren SK, Dehaene P, Hanson JW, Graham JM., Jr Incidence of fetal alcohol syndrome and prevalence of alcohol-related neurodevelopmental disorder. Teratology. 1997;56:317–326. doi: 10.1002/(SICI)1096-9926(199711)56:5<317::AID-TERA5>3.0.CO;2-U. [DOI] [PubMed] [Google Scholar]
- Schmahmann JD, Pandya DN. Fiber pathways of the brain. Oxford University Press; New York: 2006. [Google Scholar]
- Smith SM. Fast robust automated brain extraction. Hum Brain Mapp. 2002;17:143–155. doi: 10.1002/hbm.10062. [DOI] [PMC free article] [PubMed] [Google Scholar]
- Smith SM, Jenkinson M, Johansen-Berg H, Rueckert D, Nichols TE, Mackay CE, Watkins KE, Ciccarelli O, Cader MZ, Matthews PM, Behrens TE. Tract-based spatial statistics: voxelwise analysis of multi-subject diffusion data. NeuroImage. 2006;31:1487–1505. doi: 10.1016/j.neuroimage.2006.02.024. [DOI] [PubMed] [Google Scholar]
- Smith SM, Jenkinson M, Woolrich MW, Beckmann CF, Behrens TE, Johansen-Berg H, Bannister PR, De Luca M, Drobnjak I, Flitney DE, Niazy RK, Saunders J, Vickers J, Zhang Y, De Stefano N, Brady JM, Matthews PM. Advances in functional and structural MR image analysis and implementation as FSL. NeuroImage. 2004;23:S208–S219. doi: 10.1016/j.neuroimage.2004.07.051. [DOI] [PubMed] [Google Scholar]
- Sowell ER, Johnson A, Kan E, Lu LH, Van Horn JD, Toga AW, O'Connor MJ, Bookheimer SY. Mapping white matter integrity and neurobehavioral correlates in children with fetal alcohol spectrum disorders. J Neurosci. 2008a;28:1313–1319. doi: 10.1523/JNEUROSCI.5067-07.2008. [DOI] [PMC free article] [PubMed] [Google Scholar]
- Sowell ER, Mattson SN, Kan E, Thompson PM, Riley EP, Toga AW. Abnormal cortical thickness and brain-behavior correlation patterns in individuals with heavy prenatal alcohol exposure. Cereb Cortex. 2008b;18:136–144. doi: 10.1093/cercor/bhm039. [DOI] [PMC free article] [PubMed] [Google Scholar]
- Sowell ER, Mattson SN, Thompson PM, Jernigan TL, Riley EP, Toga AW. Mapping callosal morphology and cognitive correlates: effects of heavy prenatal alcohol exposure. Neurology. 2001;57:235–244. doi: 10.1212/wnl.57.2.235. [DOI] [PubMed] [Google Scholar]
- Sowell ER, Thompson PM, Mattson SN, Tessner KD, Jernigan TL, Riley EP, Toga AW. Regional brain shape abnormalities persist into adolescence after heavy prenatal alcohol exposure. Cereb Cortex. 2002;12:856–865. doi: 10.1093/cercor/12.8.856. [DOI] [PubMed] [Google Scholar]
- Streissguth AP, O'Malley K. Neuropsychiatric implications and long-term consequences of fetal alcohol spectrum disorders. Semin Clin Neuropsychiatry. 2000;5:177–190. doi: 10.1053/scnp.2000.6729. [DOI] [PubMed] [Google Scholar]
- Stromland K. Visual impairment and ocular abnormalities in children with fetal alcohol syndrome. Addict Biol. 2004;9:153–157. doi: 10.1080/13556210410001717024. [DOI] [PubMed] [Google Scholar]
- Virta A, Barnett A, Pierpaoli C. Visualizing and characterizing white matter fiber structure and architecture in the human pyramidal tract using diffusion tensor MRI. Magn Reson Imaging. 1999;17:1121–33. doi: 10.1016/s0730-725x(99)00048-x. [DOI] [PubMed] [Google Scholar]
- Watari H, Born DE, Gleason CA. Effects of first trimester binge alcohol exposure on developing white matter in fetal sheep. Pediatr Res. 2006;59:560–564. doi: 10.1203/01.pdr.0000203102.01364.de. [DOI] [PubMed] [Google Scholar]
- Wechsler D. Manual for the Wechsler Intelligence Scale for Children - Third Edition. 3rd ed. The Psychological Corporation; San Antonio, TX: 1991. [Google Scholar]
- Wozniak JR, Mueller BA, Chang PN, Muetzel RL, Caros L, Lim KO. Diffusion tensor imaging in children with fetal alcohol spectrum disorders. Alcohol Clin Exp Res. 2006;30:1799–1806. doi: 10.1111/j.1530-0277.2006.00213.x. [DOI] [PMC free article] [PubMed] [Google Scholar]
- Zhang Y, Brady M, Smith S. Segmentation of brain MR images through a hidden Markov random field model and the expectation-maximization algorithm. IEEE Trans Med Imaging. 2001;20:45–57. doi: 10.1109/42.906424. [DOI] [PubMed] [Google Scholar]