

Summary
Background
Insecticide-treated bednets (ITNs) provide a means to improve child survival across Africa. Sales figures of these nets and survey coverage data presented nationally mask inequities in populations at biological and economic risk, and do not allow for precision in the estimation of unmet commodity needs. We gathered subnational ITN coverage sample survey data from 40 malaria-endemic countries in Africa between 2000 and 2007.
Methods
We computed the projected ITN coverage among children aged less than 5 years for age-adjusted population data that were stratified according to malaria transmission risks, proximate determinants of poverty, and methods of ITN delivery.
Findings
In 2000, only 1·7 million (1·8%) African children living in stable malaria-endemic conditions were protected by an ITN and the number increased to 20·3 million (18·5%) by 2007 leaving 89·6 million children unprotected. Of these, 30 million were living in some of the poorest areas of Africa: 54% were living in only seven countries and 25% in Nigeria alone. Overall, 33 (83%) countries were estimated to have ITN coverage of less than 40% in 2007. On average, we noted a greater increase in ITN coverage in areas where free distribution had operated between survey periods.
Interpretation
By mapping the distribution of populations in relation to malaria risk and intervention coverage, we provide a means to track the future requirements for scaling up essential disease-prevention strategies. The present coverage of ITN in Africa remains inadequate and a focused effort to improve distribution in selected areas would have a substantial effect on the continent's malaria burden.
Funding
Wellcome Trust.
Introduction
Although international donor funding for malaria control in Africa has increased since 2002,1,2 funding remains inadequate2,3 and our understanding of how increased financial resources have influenced equitable and targeted coverage of key malaria control strategies across Africa is incomplete. Insecticide-treated bednets (ITNs) are one of the most important methods for achievement of the Millennium Development Goal 6 target to reduce child mortality by 2015.4 Progress toward the Roll Back Malaria target of 80% ITN coverage among vulnerable groups is reported by the Global Fund for AIDS, Tuberculosis and Malaria (GFATM), WHO, and UNICEF as yearly increases in ITN procurement, and coverage data from national sample surveys summarised nationally.5,6 National survey data represent the most precise benchmark of progress toward internationally agreed targets. Definition of biological and economic vulnerability against intervention coverage targets subnationally, however, is central to the appropriateness of scaling up intervention coverage. In this report, we present a subnational analysis of temporal changes in ITN coverage among African children that also quantifies the risks of Plasmodium falciparum transmission and proximate determinants of poverty.
Methods
ITN coverage data
The main sources of ITN coverage data were national-household cluster-sample surveys undertaken as part of multiple indicators cluster surveys,7 demographic and health surveys,8 and national sample surveys—referred to as malaria indicator surveys—in countries with GFATM or bilateral donor funding. The multistage sampling design from first-level administration (eg, province, state, or governorate) to national-census-defined enumeration clusters is common to all these surveys, and sample sizes are determined so as to provide precision in health and population indicators at the first-level administrative unit (ADMIN1). We have reconstructed information from survey reports, websites, and other published sources on the numbers of children aged less than 5 years; number of these children reported sleeping on the night before the survey under a net that was treated in the past 6 months or that was a long-lasting treated net; and dates of the survey and the first-level sampling geographical extent reported in each survey. We have selected two periods of ITN coverage data by choosing national surveys undertaken as close as possible to 2000 and 2007. ITN coverage data were not available for Botswana, Cape Verde, Reunion, Gabon, and Liberia in either period. For Comoros, ITN data were only available for 2000. These six countries are therefore not analysed further and represent only 1·0% (1·18 million) of the total childhood population in malaria-endemic Africa and 0·9% (1·03 million) of children exposed to stable P falciparum in 2007.
For early multiple indicators cluster surveys and demographic and health surveys that predated a standardised malaria module,9 some ITN coverage data were reported in a non-standard format—eg, proportion of households in which all or some children slept under a net or ITN (Mali, 2001; Tanzania and Zimbabwe, 1999); proportion of nets used by children that were ITN (Uganda, 2000–01); proportion of women aged 15–49 years who were sleeping under a net (Mozambique, 2003); or were reported for some ADMIN1 units and not others (Sudan, 1999). In each case we made an informed decision on the likely association between the reported indicators and the proportion of children sleeping under an ITN. These adjusted survey data indicate very low ITN coverage (mean 2·6% [SD 2·4]) and thus absolute errors resulting from these assumptions are likely to be small.
The reference ADMIN1 digital boundaries for Africa were obtained through a combination of data from the UN Geographic Information Working Group,10 and the Food and Agriculture Organisation.11 These boundary units matched the reported information on ITN for 34 of 40 national survey reports assembled for the baseline period (2000–03) and 30 of 40 national surveys for the follow-up period (2004–07). For Angola, Benin, Chad, Djibouti, Guinea Bissau, Mali, Mauritania, Madagascar, Nigeria, and Uganda, non-standard ADMIN1 units were reported in the national sample surveys and these were digitised with ArcGIS (version 9.1) to replace existing ADMIN1 boundaries and thus create one ITN spatial reporting surface. In Angola, Central African Republic, Somalia, Madagascar, Equatorial Guinea, Burundi, and Tanzania, baseline and follow-up national surveys were sampled and presented at different administrative resolutions between surveys. These were reconciled to the largest unit reported in either type of survey to maintain the integrity of the sample-size precision and represent temporally congruent units. Figure 1A shows the 286 spatial units used to define ITN use between 2000 and 2007 in the 40 countries where analysis was undertaken. We computed the absolute difference in ITN use between baseline and follow-up surveys for each ADMIN1. We then computed the number of months between surveys and obtained the monthly change in ITN, which we used as our ITN growth rate. We used this growth rate to project all ADMIN1 survey data described during the second-period survey to just one time reference in July, 2007.
Figure 1. Availability of insecticide-treated bednet (ITN) data for two study periods, delivery methods, poverty mapping, and risk of malaria.
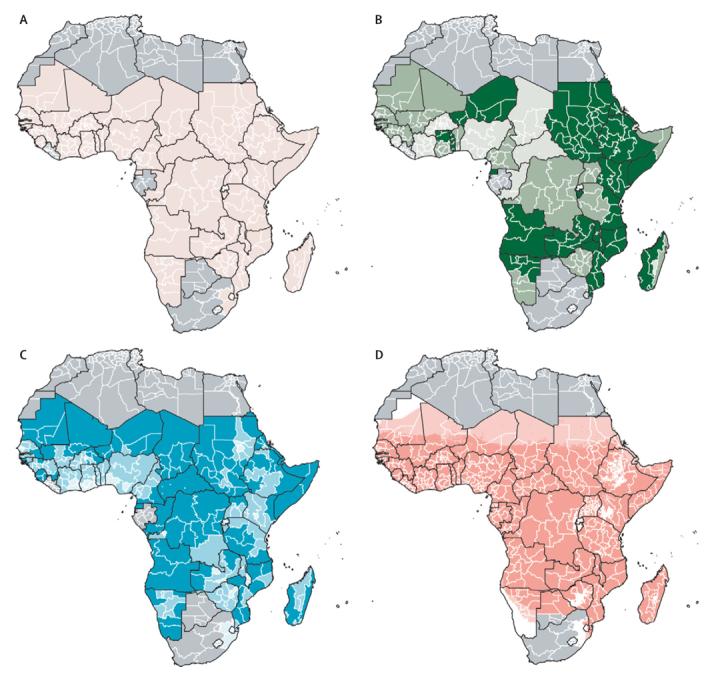
National boundaries are shown in black and first-level administrative boundaries are shown in white. (A) First-level administrative units used to define ITN use between 2000 and 2007. Countries shown in grey are those where no baseline or matched follow-up data were available (Botswana, Cape Verde, Comoros, Gabon, Liberia, and Reunion) or that were not at risk of Plasmodium falciparum malaria (Algeria, Egypt, Lesotho, Libya, Morocco, Tunisia, and seven provinces in South Africa). (B) Main delivery methods adopted by countries after 2000 and before follow-up national surveys as indicated in table 1. Light green is cost recovery through public sector or subsidised private or public sector; middle green is highly subsidised routine distribution through public sector; and dark green is free mass campaigns, either localised or nationally, or routine free distribution through public sector. (C) Poverty map showing the least poor quintile (light blue), the two moderately poor quintiles (middle blue), and the two poorest quintiles (dark blue), based on the mean brightness of night-time lights in the fi rst-level administration unit. (D) Map of malaria showing areas of no malaria risk (white) and those under unstable (light pink) and stable (dark pink) transmission.12
Since 2003, a wide range of approaches was used to improve the delivery of ITN to young children across Africa. These approaches can be classified broadly as cost recovery through the public sector, subsidised private or public sector, highly subsidised routine distribution through the public sector, routine free distribution through the public sector, and free mass campaigns; and are localised within specific ADMIN1 areas or nationally. We identified the adoption of these varied approaches by individual countries at different times between 2000 and 2007 through various literature and web searches. Table 1 shows the national adoption of each strategy and figure 1B summarises this information spatially according to the distribution methods post-baseline and pre-follow-up survey.
Table 1.
National summary of insecticide-treated bednet (ITN) coverage data sources for baseline, follow-up, and target periods, and evolution of ITN distribution mechanisms for 40 African malaria-endemic countries
| ADMIN1 | 2000–03 (baseline) |
2004–07 (follow-up) |
Projection for July, 2007 |
Start year and modality of ITN scale-up |
|||||||||||||
|---|---|---|---|---|---|---|---|---|---|---|---|---|---|---|---|---|---|
| Source (year) | Months | Children <5 years |
ITN use | Source (year) | Months | Children <5 years |
ITN use | ITN use | 2000 | 2001 | 2002 | 2003 | 2004 | 2005 | 2006–07 | ||
| Angola | 4 | MICS (2001) |
March to October | 5663 | 113 (2%) | MIS (2006–07) |
November to April |
2739 | 493 (18%) | 19% | · · | · · | Spps | · · | · · | HSrp, RFD |
FMCN |
| Benin | 6 | DHS (2001) |
May to June | 4689 | 328 (7%) |
DHS (2006) |
July to November |
15 941 | 3188 (20%) |
22% | · · | Spps | · · | · · | HSrp | · · | · · |
| Burkina Faso | 13 | DHS (2003) |
January to July | 9894 | 198 (2%) |
MICS (2006) |
April to June |
5384 | 538 (10%) |
13% | · · | CRps | · · | · · | · · | Spps | · · |
| Burundi | 1 | MICS (2000) |
April to May | 3325 | 33 (1%) |
Other (2007)13 |
September | 2845 | 910 (32%) |
32% | · · | · · | · · | Spps | · · | RFD, FMCL | FMCN |
| Cameroon | 10 | MICS (2000) |
July to August | 3385 | 34 (1%) |
MICS (2006) |
May to June |
6361 | 827 (13%) |
15% | CRps | · · | · · | · · | CRps, RFD |
· · | RFD* |
| CAR | 2 | MICS (2000) |
April to December |
14 268 | 285 (2%) |
MICS (2006) |
October to December |
9585 | 1438 (15%) |
16% | CRps | · · | · · | · · | · · | · · | · · |
| Chad | 8 | MICS (2000) |
May to September |
5384 | 54 (1%) |
DHS (2004) |
July to December |
6206 | 310 (5%) |
7% | · · | · · | · · | · · | · · | · · | HSrp |
| Congo | 4 | Estimated | Estimated | · · | <5%† | DHS (2005) |
July to November |
4340 | 260 (6%) |
7% | · · | · · | · · | · · | · · | Spps | · · |
| Côte d'Ivoire | 11 | MICS (2000) |
June to August | 7952 | 80 (1%) |
MICS (2006) |
August to October |
8650 | 519 (6%) |
7% | CRps | · · | · · | · · | · · | · · | · · |
| Djibouti | 2 | Estimated | Estimated | · · | <1%† | MICS (2006) |
July to October |
2245 | 22 (1%) |
2% | · · | · · | · · | · · | · · | · · | FMCN* |
| DRC | 11 | MICS (2001) |
April to October | 9954 | 100 (1%) |
DHS (2007) |
May to August |
8913 | 980 (11%) |
11% | CRps | · · | · · | Spps | · · | · · | FMCL |
| Equatorial Guinea |
3 | MICS (2000) |
September to November |
3033 | 30 (1%) |
Other (2007)‡ |
February to May |
3456 | 346 (10%) |
10% | · · | CRps | · · | · · | · · | · · | FMCN |
| Eritrea | 6 | DHS (2002) |
March to July | 5935 | 237 (4%) |
Other (2004)§14 |
October to November |
1266 | 608 (48%) |
85% | Spps | RFD§ | RFD§ | RFD§ | RFD§ | RFD§ | RFD§ |
| Ethiopia | 11 | DHS (2000) |
February to May |
11 771 | 0 | MIS (2007)) |
October to December |
5225 | 1724 (33%) |
33% | · · | · · | · · | Spps | · · | FMCN | FMCN |
| Gambia | 7 | MICS (2000) |
May to June | 3620 | 543 (15%) |
MICS (2005–06) |
December to March |
6543 | 3207 (49%) |
58% | · · | Spps | · · | · · | · · | · · | · · |
| Ghana | 10 | DHS (2003) |
July to October | 3593 | 144 (4%) |
MICS (2006) |
August to October |
3467 | 763 (22%) |
27% | · · | · · | RFD | FMCL | FMCL | FMCL | FMCN* |
| Guinea | 8 | Estimated | Estimated | · · | <1%† | DHS (2005) |
February to June |
6839 | <1%† | 1% | · · | · · | · · | Spps | HSrp | · · | · · |
| Guinea Bissau | 4 | MICS (2000) |
April to May | 5856 | 410 (7%) |
MICS (2006) |
May to June |
5845 | 2280 (39%) |
45% | · · | · · | · · | · · | · · | Spps | · · |
| Kenya | 8 | MICS (2000) |
September to October |
7116 | 213 (3%) |
MIS (2007) |
June to July | 6783 | 2985 (44%) |
44% | · · | · · | Spps | · · | HSrp | · · | FMCN |
| Madagascar | 4 | MICS (2000) |
August to October |
6561 | 59 (<1%) |
Other (2008)15 |
April to May |
3355 | 2047 (61%) |
61% | · · | · · | Spps | · · | · · | · · | HSrp, FMCN |
| Malawi | 3 | DHS (2000) |
July to November |
10 559 | 317 (3%) |
MICS (2006) |
July to November |
19 628 | 4907 (25%) |
28% | · · | · · | HSrp | · · | · · | · · | FMCN |
| Mali | 7 | DHS (2001) |
January to May | 11143 | 557 (5%) |
DHS (2006) |
April to September |
13 359 | 3607 (27%) |
31% | · · | · · | Spps | · · | HSrp | · · | · · |
| Mauritania | 5 | Estimated | Estimated | · · | <2%† | DHS (2003–04) |
August to February |
3239 | 65 (2%) |
3% | CRps | · · | · · | RFD | · · | · · | · · |
| Mozambique | 11 | DHS (2003) |
August to December |
10 648 | 532 (5%) |
MIS (2007) |
June to July | 5187 | 363 (7%) |
7% | · · | · · | · · | Spps | · · | FMCL | · · |
| Namibia | 13 | DHS (2000) |
September to December |
3785 | 114 (3%) |
DHS (2006–07) |
October to March |
5453 | 600 (11%) |
12% | · · | · · | · · | Spps | FMCL | · · | · · |
| Niger | 8 | MICS (2000) |
April to August | 5080 | 51 (1%) |
DHS (2006) |
January to June |
8236 | 576 (7%) |
8% | Spps | · · | · · | · · | · · | FMCN | FMCN |
| Nigeria | 6 | DHS (2003) |
March to August | 5861 | 57 (1%) |
MICS (2007) |
March to April |
16 549 | 579 (3%) |
4% | · · | · · | · · | · · | · · | CRps HSrp |
· · |
| Rwanda | 12 | MICS (2000) |
July to October | 3153 | 126 (4%) |
DHS (2005) |
February to July |
7534 | 979 (13%) |
18% | · · | · · | · · | Spps | · · | · · | RFD, FMCN* |
| São Tomé and Principe |
2 | MICS (2000) |
August to September |
2185 | 503 (23%) |
MICS (2006) |
May to July | 3125 | 1313 (42%) |
46% | CRps | · · | · · | · · | · · | FMCL | · · |
| Senegal | 10 | MICS (2000) |
May to July | 9033 | 181 (2%) |
MIS (2006) |
November to December |
4683 | 749 (16%) |
17% | · · | · · | Spps | · · | · · | · · | HSrp |
| Sierra Leone | 4 | MICS (2000) |
March to May | 2686 | 54 (2%) |
MICS (2005) |
October to November |
5245 | 262 (5%) |
6% | CRps | · · | · · | · · | · · | · · | FMCN* |
| Somalia | 3 | MICS (1999) |
November to December |
4487 | 54 (1%) |
MICS (2006) |
August to September |
6304 | 567 (9%) |
10% | · · | · · | · · | · · | Spps | FMCL | · · |
| South Africa | 2 | Other (2001)19 |
· · | · · | 1%† | PC (2007)¶ |
· · | · · | <5%† | 5% | · · | · · | · · | · · | · · | · · | · · |
| Sudan | 26 | MICS (2000)|| |
July to August | 23 297 | 443 (2%) |
Other (2006)16 |
March to June |
2363 | 189 (8%) |
10% | · · | · · | · · | · · | CRps | FMCL | FMCL |
| Swaziland | 4 | MICS (2000) |
July to September | 3508 | 21 (<1%) |
DHS (2006–07) |
July to February |
3268 | 20 (<1%) |
1% | · · | · · | · · | Spps | · · | · · | · · |
| Tanzania | 9 | DHS (1999) |
September to November |
3011 | 60 (2%) |
Other (2006– 07)** |
June to August |
8608 | 2324 (27%) |
33% | · · | · · | · · | · · | Spps | · · | HSrp, FMCL |
| Togo | 5 | MICS (2000) |
August to September |
3126 | 56 (2%) |
MICS (2006) |
May to June |
4073 | 1548 (38%) |
45% | · · | · · | · · | · · | FMCN | · · | · · |
| Uganda | 4 | DHS (2000– 01) |
September to March |
8049 | <1%† | DHS (2006) |
May to October |
8402 | 840 (10%) |
11% | CRps | · · | · · | Spps | · · | · · | · · |
| Zambia | 9 | DHS (2001– 02) |
November to May |
5786 | 58 (1%) |
MIS (2006) |
May to June |
2700 | 621 (23%) |
29% | · · | · · | · · | Spps FMCL |
HSrp | FMCN | FMCN* |
| Zimbabwe | 10 | DHS (1999) |
August to November |
3269 | <3%† | DHS (2005–06) |
August to March |
5751 | 173 (3%) |
4% | · · | · · | · · | · · | · · | Spps | HSrp |
The recorded ITN distribution mechanisms are cost recovery through public sector (CRps), subsidised private or public sector (Spps), highly subsidised routine distribution through public sector (HSrp), routine free distribution through public sector (RFD), localised free mass campaigns (FMCL), and national free mass campaigns (FMCN); and are summarised in figure IB. Botswana, Cape Verde, Reunion, Comoros, Gabon, and Liberia were not included because they had no survey data for baseline or follow-up years. ADMIN1=first-level administrative unit. CAR=Central African Republic. DHS=demographic and health surveys. DRC=Democratic Republic of Congo. MIC=multiple indicators cluster surveys. MIS=malaria indicator surveys. PC=personal communication.
Countries where free mass campaigns of long-lasting treated nets were undertaken after the follow-up survey are Djibouti in November, 2006; Ghana in November, 2006; Rwanda in September, 2006; Sierra Leone in November, 2006; Cameroon in 2007; Mali in 2007; and Zambia in 2007.
Values are estimates because survey data were not available for the country during a particular period.
Derived from household sample survey data from 2007 (Kleinschmidt I, London School of Hygiene and Tropical Medicine, personal communication).
In Eritrea data for four of six ADMIN1 units were obtained from a published source14 and an averaged assumption was imputed for the remaining two on the basis of neighbouring ADMIN1 coverage. Eritrea uses regular free distribution through the routine public sector as the main channel to deliver ITNs and is classified with free mass campaign in figure IB.
For the two malaria endemic provinces in South Africa, we have assumed that ITN is less than 5% in 2007 after communications with provincial malaria control programme managers in both areas who indicated that over the past 5 years the focus of malaria vector control has been on indoor residual spraying rather than ITN distribution (Kruger P, Limpopo Malaria Control Programme, personal communication).
In Sudan, baseline ADMIN1 data were available only for north Sudan (n=16). For south Sudan, ITN coverage data for the ADMIN1 units (n=10) were estimated from the means of nearest neighbours (n=5); or were assigned the national average of 1·9% from the MICS in 2000 (n=5).
Definition of poverty
Roll Back Malaria targets emphasise the need to target specifically those population groups living in the two poorest quintiles in areas of biological vulnerability.19 The definition of poverty is fraught with difficulties and most health indicators are expressed against composites of household assets as measures of economic vulnerability but are difficult to compare between countries. A spatially consistent and simpler alternative is to use a proxy for poverty—ie, illumination from night-time lights that are seen from earth-orbiting satellites. Data for these lights have been used as a surrogate for economic vulnerability and poverty mapping in North America, Europe, and globally20 and were shown to be highly discriminatory in the separation of the most and least poor administrative areas in Africa.21
Here we use operational linescan system night-time lights gridded data that are produced by the US Defence Meteorological Satellite Program and the National Oceanic and Atmospheric Administration's National Geophysical Data Center. We downloaded global night-time light data at about 1 km×1 km spatial resolution for the year 2000 from the National Geophysical Data Center-US Defence Meteorological Satellite Program website20 in raster-grid format and extracted data for Africa. We computed the mean brightness of the light pixels for each ITN ADMIN1 and then ranked them across Africa into quintiles with the most economically vulnerable represented by the two lowest quintiles of night-time lights (figure 1C).
Children at risk of P falciparum transmission
We used recently completed work on the limits of stable P falciparum transmission.12 We assumed no transmission when medical intelligence from international travel advisories or national malaria-control programmes stated no malaria risk or when temperature was too low for sporogony to complete within the average lifespan of the local dominant vector species. Unstable malaria in Africa refers to areas where transmission is plausible biologically but limited by the effects of aridity on anopheline adult and larval survival, and the clinical incidence is less than one case per 10 000 population per year. A definition of stable malaria was assumed to be a minimum of one clinical case per 10 000 population per year in a particular administrative unit, similar to rules used during the global malaria eradication programme. Within this range of stable transmission, conditions of transmission intensity vary enormously but cover all those in Africa where ITN is recommended as a key malaria prevention strategy.22 The three classifications of malaria risk are shown in figure 1D.
Definition of projected population estimates for 2007
The Global Rural Urban Mapping Project (version alpha) provides gridded population counts and population density estimates for the years 1990, 1995, and 2000, both adjusted and unadjusted to the UN national population estimates.23 We projected the adjusted population counts for the year 2000 forward to create seven further population count surfaces for each year from 2001 to 2007 by applying national, medium variant, intercensal growth rates by country, with methods previously described.24 We then stratified these population counts nationally by age group using UN-defined24 population age structures to obtain population count surfaces for children younger than 5 years for each year from 2000 to 2007. We used these population maps in combination with the ADMIN1 boundaries to extract the numbers of children less than 5 years of age living with no risk, or unstable and stable P falciparum transmission risk for each reconstituted ADMIN1 polygon in ArcView (version 3.2).
Role of the funding source
The sponsor of the study had no role in study design, data collection, analysis, interpretation of data, or writing of the report. The corresponding author had full access to all the data in the study and had final responsibility for the decision to submit for publication.
Results
Table 1 shows that data were obtained from multiple indicators cluster surveys (n=21), demographic and health surveys (n=14), or alternative sources (n=5), and used to define ITN use in the 286 ADMIN1 areas between 1999 and 2003, with median ITN use among children aged less than 5 years of 3·04% (IQR 0·50–3·71). We used 2003 demographic and health survey data for Burkina Faso, Ghana, Mozambique, and Nigeria because there were no earlier nationally representative surveys with ITN data within the baseline period. Although there were no national sample survey data close to 2000, data gathered between 2005 and 2006 showed that ITN coverage among children less than 5 years of age was between 0 and less than 5% for Mauritania, Congo, Djibouti, and Guinea. With such a low coverage, a reasonable assumption is that a negligible change in ITN coverage occurred between baseline and our reference year of 2007. For the two malaria-endemic provinces of South Africa (KwaZulu Natal and Mpumalanga), we used data from a Roll Back Malaria report in 200125 as the baseline. In the surveyed countries, 94 million children were likely to be living in areas of stable malaria-endemic risks in 2000. Figure 2A shows almost universally poor ITN use across these countries in 1999–2003, with only 50 (17%) of the ADMIN1 areas surveyed on the continent during this period showing more than 5% of children using an ITN. Additionally, 1·7 million (1·8%) children were protected by an ITN in areas of stable P falciparum malaria in 2000.
Figure 2.
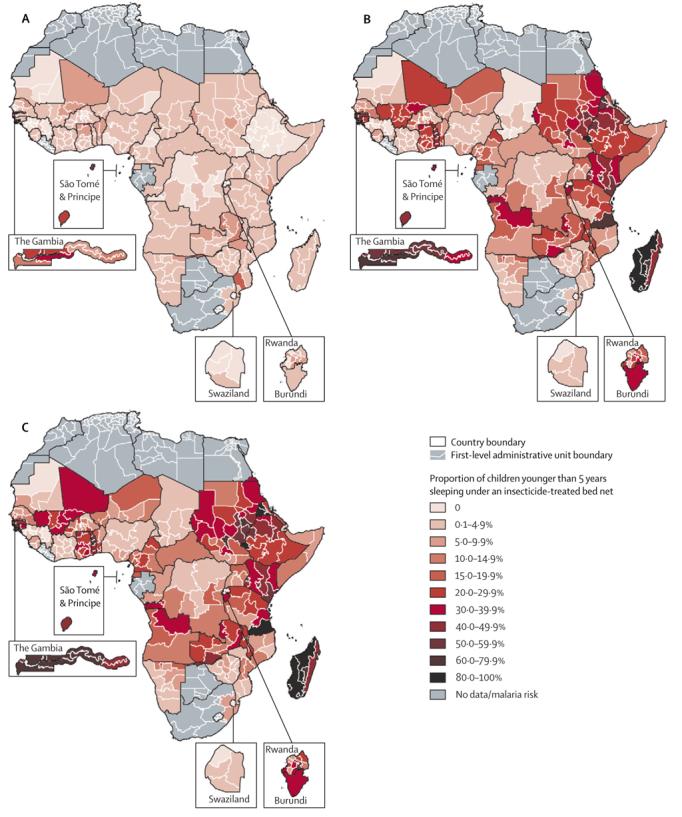
Insecticide-treated bednet (ITN) coverage among children under the age of 5 years reported in (A) 1999-2003 (baseline) and (B) 2004-07 (follow-up), and (C) projected to July, 2007 (target period)
Between 2004 and 2007, we obtained data from 13 demographic and health surveys, 14 multiple indicators cluster surveys, and 13 other national surveys and personal communications (table 1).13-18,26-31 Figure 2B shows the ADMIN1 ITN use distribution across countries reporting data after 2003. The average duration between the data shown in figure 2B and figure 2A was 5·3 years. In 2004–07, 205 of 286 (72%) administrative polygons reported childhood ITN use to be greater than 5%, 109 (38%) reported ITN use in excess of 20%, 11 (4%) above 60%, and three (1%; one in Ethiopia and two in Madagascar) had reached the Roll Back Malaria target of 80%. The fastest yearly growth in ITN usage estimates between 2000 and 2007 was in Eritrea, Madagascar, Ghana, Togo, Kenya, Gambia, Guinea Bissau, Zambia, Ethiopia, and Burundi—all are coun tries that had promoted the delivery of free nets through mass campaigns between survey periods, except Eritrea, which relied on free distribution through the routine public-health system (figure 1B). The median reported ITN use for 2004–07 for ADMIN1, where the main delivery channel was free distribution (national and local), was 25·2% (n=117, IQR 11·2–40·3) compared with 14·1% (n=117, 4·2–24·4) for ADMIN1 areas where no free mass campaigns had been implemented, but where subsidised and heavily subsidised delivery had been promoted. Unsurprisingly, areas without free or subsidised programmes, relying mainly on full-cost recovery mechanisms of ITN delivery, had the lowest ITN coverage during the period of observation (n=50, median 3·9%, 1·8–7·4; figure 3).
Figure 3. Insecticide-treated bednet (ITN) use among children under the age of 5 years in 2007 by the main country ITN delivery mechanism.

The box indicates the IQR (25% and 75%); the thick line within the box represents the median; and the error bars represent the 2·5% and 97·5% centiles; and outliers are plotted as circles outside this range. ITN distribution was free (n=117), moderately or highly subsidised (n=117), and full cost recovery (n=50). The two malaria-endemic first-level administration units (ADMIN1) in South Africa (KwaZulu Natal and Mpumalanga) are not included. Median ITN coverage among children less than 5 years of age was higher in ADMIN1 without free distribution than in those with routine subsidised delivery (ANOVA p=0·05) or full cost recovery (p=0·02).
The coverage data shown in figure 2B indicate varying periods after 2004 and we have standardised the estimates of ITN use to the base year 2007 by use of expected ITN use growth rates per ADMIN1 for the 40 countries reporting in 2007. Mean projection periods were 14 months from the reported follow-up survey through to July, 2007 (figure 2C). These estimates of adapted ITN usage suggest that 218 (76%) of 286 areas had childhood ITN use reported as greater than 5% in 2007, 20 (7%) administrative areas reported ITN use in excess of 60%, and 10 (3%) of the ADMIN1 areas had reached the Roll Back Malaria ITN use target of at least 80% (figure 2C).
With the projected ITN use data adjusted to childhood populations at risk of stable P falciparum transmission, we estimate that 20·3 million (18·5%) children younger than 5 years were protected by an ITN in 2007, whereas 89·6 million (81·5%) remained unprotected, of which 30 million unprotected children lived in the poorest areas of stable malaria-endemic Africa (table 2). Among communities in unstable transmission areas or areas at no risk of transmission, similar proportions of children were likely to have been protected by an ITN (table 2). On a continental scale, ITN coverage in 2007 showed equity in relation to proximate determinants of poverty without significant differences in ITN coverage between children living in the most poor areas compared with those in the least poor (21% vs 16% [table 2]; ANOVA p=0·275) with similar observations across all malaria risk classes (data not shown). Biological equity scaled less well, however, with more children protected in areas of no or unstable risk compared with areas with stable endemic malaria (25·3% vs 18·5% [derived from data in table 2]; p=0·032).
Table 2.
Children aged less than 5 years who were protected by an insecticide-treated bednet (ITN) in 2007 according to classes of Plasmodium falciparum and poverty risks across 40 malaria-endemic countries
| No P falciparum risk (N=11·6 million) |
Unstable P falciparum risk (N=2·2 million) |
Stable P falciparum risk (N=109·9 million) |
Total (N=123·7 million) | |
|---|---|---|---|---|
| Least poor (highest NTL quintile, N=22 500 000) | ||||
| Children protected by ITN | 441 000 (18·2%) | 1 200 000 (16·8%) | 3 080 000 (15·9%) | 3 640 000 (16·2%) |
| ADMIN1 with ITN use | 40 (13·9%, 4·4–38·4) | 11 (5·05%, 2·2–19·0) | 57 (15·6%, 4·7–32·5) | 57 (15·6%, 4·7–32·4) |
| Moderately poor (NTL quintiles 2 and 3, N=58 700 000) | ||||
| Children protected by ITN | 1 406 000 (25·9%) | 83 000 (30·3%) | 9 779 000 (18·5%) | 11 268 000 (19·2%) |
| ADMIN1 with ITN use | 61 (17·3%, 5·1–34·0) | 24 (36·5%, 20·9–50·0) | 112 (21.4%, 6·1–37·5) | 114 (19·6%, 6·0–37·1) |
| Most poor (lowest NTL quintiles 4 and 5, N=42 500 000) | ||||
| Children protected by ITN | 1 124 000 (29·8%) | 319 000 (27·3%) | 7 484 000 (19·9%) | 8 927 000 (21·0%) |
| ADMIN1 with ITN use | 62 (13·6%, 6·3–32·3) | 52 (11·1%, 2·5–31·1) | 113 (12·5%, 6·1–29·9) | 116 (12·3%, 5·7–29·8) |
| Total | ||||
| Children protected by ITN | 2 972 000 (25·5%) | 522 000 (24·2%) | 20 343 000 (18·5%) | 23 837 000 (19·2%) |
| ADMIN1 with ITN use | 163 (15·6%, 5·1–35·2) | 87 (16·6%, 4·5–35·6) | 282 (15·0%, 5·6–32·9) | 286 (14·3%, 5·1–32·6) |
Data are number (%) or number (median, IQR). The P falciparum-endemic countries not included are Botswana, Cape Verde, Comoros, Gabon, Liberia, and Reunion, and represent 1·0% of children in all malaria-endemic countries of Africa in 2007. ADMIN1=first-level administrative units. NTL=night-time lights.
Discussion
We estimate that only about a fifth of children at risk of stable malaria transmission were protected by an ITN in 2007. Conversely, nearly 90 million African children living under conditions of stable malaria transmission have been neglected by the calls for rapid scaling up of ITN coverage made by the Roll Back Malaria movement in 2000.32 This neglect comes at a time when these same agencies and international partners are calling for elimination33 and a malaria-free world.34 A large proportion of these unprotected children live in some of the poorest parts of Africa, but the differences in ITN use between spatially defined areas of least and most poor seem less obvious than has been reported before intervention coverage was scaled up (table 2). The procurement of more than 60 million long-lasting treated nets35 and the reports of rapid scaling up of ITN delivery in a few select countries have been hailed as a clear indication of progress toward Roll Back Malaria and Millennium Development Goals' targets.5,6 Reports of sales figures or percentage coverage changes from selective examples mask underlying inequities in ITN use on a continental scale, adjusted for actual populations at risk of developing malaria.
Almost 25 years have elapsed since the first clinical trials of ITN were completed in Africa and more than 10 years since large-scale clinical trial evidence was provided on the contribution of ITN as a major method to reduce childhood mortality across most malaria-endemic settings in Africa. Why then is coverage so poor in 2007? An analysis of international donor funding in relation to populations exposed to stable transmission highlights huge disparities and inadequacies in malaria funding across Africa,2 which must contribute to inabilities to scale up coverage. Some controversy remains about the best approaches to ITN delivery.36,37 In this report, we have shown that the areas of Africa that have promoted free ITN distribution (figure 1B) have overall achieved more rapid progress than those that rely on cost recovery (21% lower median coverage) or routine subsidised public-sector promotion (11% lower median coverage). Fortunately, increasing numbers of countries are complementing existing delivery strategies with free distributions as national or localised strategies after the period of observations reported here, and current ITN coverage in these countries might be higher than our projected estimates.
In some cases, biological vulnerability has scaled up with differences in ITN use within a country, notably Angola, Eritrea, Kenya, Madagascar, and Zambia, and less strategically elsewhere, notably Sudan. National ITN coverage was less than 15% in 2007 in 13 countries, including seven countries (Nigeria, Demographic Republic of Congo, Uganda, Sudan, Mozambique, Côte d'Ivoire, and Cameroon) that account for 53·5 million (48·6%) of all children (110 million) in Africa living under conditions of stable malaria transmission and 48·3 million (54%) of all unprotected children (89·6 million) in these transmission areas. Nigeria alone accounts for 22·2 million (25%) of all African children (89·6 million) living under conditions of stable malaria transmission who were not protected by an ITN in 2007. A focus of attention on these areas in Africa must be seen as a priority if health effects at the continental level are to be realised by 2015.
Such approaches to mapping intervention coverage and risk come with caveats and opportunities for improvement. We have attempted to standardise the ITN coverage to 1 year (2007) of assessment using subnational resolution estimates of ITN use growth rates. For the most part, this process required minor extrapolations, but in a few countries these estimates would have been affected by the timing of the follow-up surveys (table 1). More regular survey data corresponding to changes in delivery modalities is central for improvement of the precision of such temporal interpolation. Additionally, standardised information on coverage of other vector control strategies, such as indoor residual spraying, needs to be generated at the same resolution as ITN to measure the combined effect of these complementary strategies. To generate this information, we need more investment in measurement of progress than is currently available to countries and should be redressed if international agencies are serious about an analysis of whether money is spent where it should be to achieve the intended goals.38 The available evidence suggests that ITNs are similarly effective under a wide range of transmission intensities in averting new infections,22 but the subsequent public-health effect varies,39 and deaths and disease events averted will be highest in communities exposed to high transmission. To assess the public-health impact with changes in ITN coverage will require a more detailed mapping of malaria risk and the effect of seasonality on ITN use at a continental scale. Although not presently available, this work is ongoing as part of the Malaria Atlas Project40 and will provide a more informed map of biological risk with which to plan and assess resource allocation.
Definition of vulnerability and unmet need is central to effective investment strategies by the donor community. Mapping risks, target populations, vulnerability, and coverage provides a means to redress deficiencies in the international calls for 80% coverage of ITN by 2015. These targets remain elusive across vast areas of Africa. Increased funding and more informed use of this funding is desperately needed to protect more children in the most vulnerable and most populated areas of Africa.
Acknowledgements
AMN (Research Training Fellowship, 081829), SIH (Senior Research Fellowship, 079091), and RWS (Principal Research Fellowship, 079081) are supported by the Wellcome Trust. This work forms part of the output of the Malaria Atlas Project, mainly funded by the Wellcome Trust, UK. We thank Priscilla Gikandi and Victor Alegana for their assistance during data abstraction and digitisation of administrative boundaries; Alfredo Fort of Opinion Research Corporation-Macro International for his assistance in connecting the authors with national survey teams; Pete Gething and Emelda Okiro for comments on earlier versions of this report. This report is published with the permission of the Director of KEMRI.
Footnotes
Conflict of interest statement
We declare that we have no conflict of interest.
For the Malaria Atlas Project see http://www.map.ox.ac.uk
References
- 1.Grabowsky M. The billion-dollar question. Nature. 2008;451:1051–52. doi: 10.1038/4511051a. [DOI] [PubMed] [Google Scholar]
- 2.Snow RW, Guerra CA, Mutheu J, Hay SI. International funding for malaria control in relation to populations at risk of stable Plasmodium falciparum transmission. PLoS Med. 2008;7:e142. doi: 10.1371/journal.pmed.0050142. [DOI] [PMC free article] [PubMed] [Google Scholar]
- 3.Teklehaimanot A, McCord GC, Sachs JD. Scaling up malaria control in Africa: an economic and epidemiological assessment. Am J Trop Med Hyg. 2007;77:138–44. [PubMed] [Google Scholar]
- 4.UN . Road map towards the implementation of the United Nations millennium declaration. United Nations General Assembly; 2001. A/56/326. http://www.un.org/ (accessed July 17, 2007) [Google Scholar]
- 5.UNICEF . Progress in Intervention Coverage. The United Nations Children's Fund (UNICEF); New York: 2007. Malaria and Children. http://www.unicef.org/health/files/Malaria_Oct6_for_web(1).pdf (accessed Jan 28, 2008) [Google Scholar]
- 6.Roll Back Malaria, World Health Organization and United Nations Children Fund . World Malaria Report. Geneva, Switzerland: 2008. [Google Scholar]
- 7.UNICEF Multiple Cluster Indicator Surveys. http:///www.childinfo.org/mics.html (accessed Sept 10, 2007)
- 8.Measure-DHS Demographic and health surveys. http://www.measuredhs.com/accesssurveys/ (accessed July 15, 2007)
- 9.RBM-MERG. Monitoring and Evaluation Resource Group Core Household Questionnaire. http://www.rbm.who.int/partnership/wg/wg_monitoring/docs/mis2005/cc1.pdf (accessed Aug 5, 2008)
- 10.UNGIWG-SALB Second Administrative Level Boundaries. http://www.who.int/whosis/database/gis/salb/salb_PO.htm (accessed July 17, 2008)
- 11.FAO-GAUL http://www.fao.org/geonetwork/srv/cn/metadata.show?id=12691 (accessed July 12, 2008)
- 12.Guerra CA, Gikandi PW, Tatem AJ, et al. The limits and intensity of Plasmodium falciparum transmission: implications for malaria control and elimination worldwide. PLoS Med. 2008;5:e38. doi: 10.1371/journal.pmed.0050038. [DOI] [PMC free article] [PubMed] [Google Scholar]
- 13.Population Services International . Déterminants de l'utilisation des moustiquaires imprégnées au Burundi. République du Burundi; Bujumbura: 2007. [Google Scholar]
- 14.Nyarango P, Gebremeskel T, Mebrahtu G, et al. A steep decline of malaria morbidity and mortality trends in Eritrea between 2000 and 2004: the effect of combination of control methods. Malaria J. 2006;5:33. doi: 10.1186/1475-2875-5-33. [DOI] [PMC free article] [PubMed] [Google Scholar]
- 15.Kulkarni M, Desrochers R, Goodson J, et al. Evaluation de l'appropriation et l'utilisation des moustiquaires imprégnées d'insecticide à longue durée (MIDs) au Madagascar six mois après la campagne intégrée rougeole/paludisme d'octobre 2007. Rapport Final. HealthBridge and CDC Etats-Unis; Ottawa and Atlanta: 2008. [Google Scholar]
- 16.Federal Ministry of Health . Sudan Household Health Survey. Federal Ministry of Health; Khartoum, Sudan: 2007. [Google Scholar]
- 17.Hanson K, Marchant T, Mponda H, et al. Monitoring and evaluation of the Tanzania national voucher scheme (TNVS): report on 2006 TNVS household, facility services and facility users surveys (a comparison between baseline and 12 month follow-up) Ifakara Health Research and Development Centre and London School of Hygiene and Tropical Medicine; 2007. [Google Scholar]
- 18.Ministry of Health and Social Welfare, Zanzibar . Zanzibar national malaria indicator survey 2007. Ministry of Health, Zanzibar National Malaria Control Programme; Zanzibar: 2008. [Google Scholar]
- 19.RBM . Global strategic plan: Roll Back Malaria 2005–2015. Roll Back Malaria Partnership, World Health Organization; Geneva, Switzerland: 2005. [Google Scholar]
- 20.DMSP Nighttime lights of the world – change pair (version 1) http://www.ngdc.noaa.gov/dmsp/download_world_change_pair.html (accessed July 12, 2008)
- 21.Noor AM, Alegana VA, Gething PW, et al. Using remotely sensed night-time light as a proxy for poverty in Africa. Popul Health Metr. 2008;6:5. doi: 10.1186/1478-7954-6-5. [DOI] [PMC free article] [PubMed] [Google Scholar]
- 22.Lengeler C. Insecticide-treated bed nets and curtains for preventing malaria. Cochrane Database Syst Rev. 2004;2 doi: 10.1002/14651858.CD000363.pub2. CD000363. [DOI] [PubMed] [Google Scholar]
- 23.Center for International Earth Science Information Network (CIESIN), Columbia University, International Food Policy Research Institute (IFPRI), The World Bank, Centro International de Agricultura Tropical (CIAT) Global Rural Urban Mapping Project (GRUMP) alpha: Gridded population of the world, version 2, with urban reallocation (GPW-UR) 2007. http://sedac.ciesin.columbia.edu/gpw (accessed Sept 8, 2008)
- 24.UNPD . World population prospects: the 2006 revision population database. United Nations Population Division (UNDP); New York: http://esa.un.org/unpp/ (accessed Sept 8, 2008) [Google Scholar]
- 25.RBM . The Abuja declaration and the plan of action. An extract from the African Summit on Roll Back Malaria, Abuja, April 25, 2000. Roll Back Malaria (RBM); Geneva: 2001. (WHO/CDS/RBM/2000.17) [Google Scholar]
- 26.Ministry of Health Angola . Angola National Malaria Indicator Survey 2006-7. Ministry of Health; Luanda, Angola: 2007. [Google Scholar]
- 27.Ministry of Health Ethiopia Ethiopia National Malaria Indicator Survey 2007; September; Addis Ababa, Ethiopia: Ministry of Health; 2008. http://www.moh.gov.et/index.php?option=com_events&task=view_detail&agid=1&year=2008&month=09&day=02&Itemid=1&catids=29 (accessed Sept 2, 2008) [Google Scholar]
- 28.Ministry of Health Kenya . Kenya national malaria indicator survey 2007. Ministry of Health; Nairobi, Kenya: 2008. [Google Scholar]
- 29.Ministry of Health Mozambique . Mozambique national malaria indicator survey 2007. Ministry of Health; Maputo, Mozambique: 2007. [Google Scholar]
- 30.Ministere de la Sante . Enquête Nationale sur le Paludisme au Sénégal 2006. Ministere de la Sante; Dakar, Senegal: 2007. [Google Scholar]
- 31.Ministry of Health Zambia . Zambia National Malaria Indicator Survey 2006. Ministry of Health; Lusaka, Zambia: 2006. [Google Scholar]
- 32.WHO . The African Summit on Roll Back Malaria, Abuja, April 25, 2000. World Health Organization; Geneva: 2000. [Google Scholar]
- 33.Roberts L, Enserink M. Did they really say…eradication? Science. 2007;318:1544–45. doi: 10.1126/science.318.5856.1544. [DOI] [PubMed] [Google Scholar]
- 34.RBM . World Health Organization; Geneva: 2008. The global malaria action plan. Roll Back Malaria partnership. [Google Scholar]
- 35.UNICEF . Bednets: supply update. United Nations Children's Fund (UNICEF) supply division; http://www.rbm.who.int/docs/llin2008/05.pdf (accessed Sept 4, 2008) [Google Scholar]
- 36.Lengeler C, Grabowsky M, McGuire D, de Savigny D. Quick wins versus sustainability: options for the up-scaling of insecticide-treated nets. Am J Trop Med Hyg. 2007;77:222–26. [PubMed] [Google Scholar]
- 37.Teklehaimanot A, Sachs JD, Curtis C. Malaria control needs mass distribution of insecticidal bednets. Lancet. 2007;369:2143–46. doi: 10.1016/S0140-6736(07)60951-9. [DOI] [PubMed] [Google Scholar]
- 38.Snow RW. The invisible victims. Nature. 2004;430:934–35. doi: 10.1038/430934a. [DOI] [PubMed] [Google Scholar]
- 39.Snow RW, Marsh K. The consequences of reducing Plasmodium falciparum transmission in Africa. Adv Parasitol. 2002;52:235–64. doi: 10.1016/s0065-308x(02)52013-3. [DOI] [PubMed] [Google Scholar]
- 40.Hay SI, Snow RW. The Malaria Atlas Project: developing global maps of malaria risk. PLoS Med. 3:e473. doi: 10.1371/journal.pmed.0030473. [DOI] [PMC free article] [PubMed] [Google Scholar]