

Abstract
Purpose
To evaluate the prognostic significance of CEBPA mutations in the context of established molecular markers in cytogenetically normal (CN) acute myeloid leukemia (AML) and gain biologic insights into leukemogenesis of the CN-AML molecular high-risk subset (FLT3 internal tandem duplication [ITD] positive and/or NPM1 wild type) that has a significantly higher incidence of CEBPA mutations than the molecular low-risk subset (FLT3-ITD negative and NPM1 mutated).
Patients and Methods
One hundred seventy-five adults age less than 60 years with untreated primary CN-AML were screened before treatment for CEBPA, FLT3, MLL, WT1, and NPM1 mutations and BAALC and ERG expression levels. Gene and microRNA (miRNA) expression profiles were obtained for the CN-AML molecular high-risk patients.
Results
CEBPA mutations predicted better event-free (P = .007), disease-free (P = .014), and overall survival (P < .001) independently of other molecular and clinical prognosticators. Among patients with CEBPA mutations, 91% were in the CN-AML molecular high-risk group. Within this group, CEBPA mutations predicted better event-free (P < .001), disease-free (P = .004), and overall survival (P = .009) independently of other molecular and clinical characteristics and were associated with unique gene and miRNA expression profiles. The major features of these profiles were upregulation of genes (eg, GATA1, ZFPM1, EPOR, and GFI1B) and miRNAs (ie, the miR-181 family) involved in erythroid differentiation and downregulation of homeobox genes.
Conclusion
Pretreatment testing for CEBPA mutations identifies CN-AML patients with different outcomes, particularly in the molecular high-risk group, thus improving molecular risk-based classification of this large cytogenetic subset of AML. The gene and miRNA expression profiling provided insights into leukemogenesis of the CN-AML molecular high-risk group, indicating that CEBPA mutations are associated with partial erythroid differentiation.
INTRODUCTION
The broad range of disease-free survival (DFS) and overall survival (OS) durations reported in cytogenetically normal (CN) acute myeloid leukemia (AML) patients can be largely explained by their genomic heterogeneity, with several molecular markers proven to be prognostic.1 Among these, FLT3 internal tandem duplication (FLT3-ITD),2-4 FLT3 tyrosine kinase domain,5 and WT1 mutations6,7 and high BAALC8-11 and ERG12,13 expression levels have been validated as adverse prognostic markers, and NPM1 mutations14-17 have been validated as favorable prognostic markers. Patients with CN-AML and NPM1 mutations and no FLT3-ITD (NPM1 mutated/FLT3-ITD negative) are considered to comprise a molecular low-risk group because their outcome is superior to CN-AML patients with FLT3-ITD (FLT3-ITD positive) and/or wild-type NPM1, who constitute a molecular high-risk group.15-17 The former have a favorable outcome similar to that of patients with core binding factor AML.18
CEBPA encodes a protein member of the basic region leucine zipper (bZIP) transcription factor family that is essential for myeloid differentiation.19 CEBPA mutations occur predominantly in CN-AML,20,21 having been reported in 13% to 19% of such patients.10,20,22,23 There are two main categories of CEBPA mutations. N-terminal nonsense mutations prevent expression of the full-length protein and result in a truncated isoform with dominant-negative activity, whereas the C-terminal mutations occurring in the bZIP domains are usually in-frame and encode mutant proteins lacking DNA binding and/or homodimerization activities.19,20 Both mutation types are predicted to confer loss of function in the C/EBPα protein.
Whereas initial reports focused on the prognostic significance of CEBPA mutations in the intermediate-risk cytogenetic group of AML patients,24,25 other studies10,22,23 have shown the favorable impact of CEBPA mutations on clinical outcome in CN-AML. The predictive value of CEBPA mutations has been studied concurrently with FLT3-ITD and MLL partial tandem duplication (MLL-PTD),22 FLT3-ITD and BAALC expression,10 and FLT3-ITD and NPM1 mutations.23 However, no report described the clinical significance of CEBPA mutations in the context of all established prognostic molecular markers in CN-AML, including WT1 mutations and ERG overexpression. Therefore, we tested the predictive value of CEBPA mutations in a relatively large group of CN-AML patients concurrently with the aforementioned prognostic markers. To gain biologic insights regarding the role of CEBPA mutations in the CN-AML molecular high-risk patients, who harbor CEBPA mutations significantly more often than molecular low-risk patients, we derived CEBPA mutation-associated gene and microRNA (miRNA) expression profiles.
PATIENTS AND METHODS
Patients, Treatment, Cytogenetic, and Molecular Analyses
CEBPA mutations were analyzed in 175 adults younger than 60 years of age with untreated, primary CN-AML enrolled onto the Cancer and Leukemia Group B (CALGB) treatment protocols 962126 and 1980827 (see Appendix, online only). Pretreatment cytogenetic analyses of bone marrow were performed by CALGB-approved institutional cytogenetic laboratories as part of CALGB 8461, a prospective cytogenetic companion study, and were centrally reviewed, as previously reported.28 To be considered CN, ≥ 20 metaphase cells had to be analyzed, and the karyotype had to be found to be normal. The presence or absence of the CEBPA mutations (see Appendix),22 FLT3-ITD,4 FLT3 tyrosine kinase domain mutations,4,5,29 MLL-PTD,30,31 NPM1 mutations,15 WT1 mutations,6 and BAALC8 and ERG13 expression levels was determined centrally in pretreatment samples as described previously. Written informed consent for these studies was obtained from all patients.
Gene and miRNA Expression Profiling
Suitable RNA samples from 107 patients in the CN-AML molecular high-risk group were analyzed using Affymetrix U133 plus 2.0 GeneChips (Affymetrix, Santa Clara, CA), as previously reported.5,32 Suitable RNA samples from 64 patients in the CN-AML molecular high-risk group enrolled onto CALGB 19808 were analyzed for miRNA expression using a previously reported Ohio State University customized miRNA chip.33 Images of the gene and miRNA microarrays were acquired, and calculation, normalization, and filtering of signal intensity for each microarray spot were performed as described in the Appendix.
Statistical Methods
Definitions of clinical end points (ie, complete remission [CR], event-free survival [EFS], DFS, and OS) are provided in the Appendix. Pretreatment clinical features of patients with and without CEBPA mutations were compared using Fisher's two-sided exact and Wilcoxon rank sum tests for categoric and continuous variables, respectively. Estimated probabilities of EFS, DFS, and OS were calculated using the Kaplan-Meier method, and the log-rank test evaluated differences between survival distributions. Proportional hazards models were constructed for survival end points, using a limited backwards elimination procedure (see footnotes to Table 3 for factors examined for model inclusion). Variables remaining in the final models were those significant at α = .05 and those important molecular variables that were confounded with the main variable, CEBPA mutation status. The proportional hazards assumption was checked for each variable individually. If the proportional hazards assumption was not met for a particular variable, then an artificial time-dependent covariate was included in all models containing that variable.34
Table 3.
Multivariable Analyses for Outcome of Cytogenetically Normal Acute Myeloid Leukemia Patients
| Variable in Final Models | Hazard Ratio | 95% CI | P |
|---|---|---|---|
| All patients | |||
| Event-free survival* | |||
| CEBPA, mutated v wild type | 0.4 | 0.2 to 0.8 | .007 |
| WT1, mutated v wild type | 2.5 | 1.4 to 4.7 | .003 |
| FLT3-ITD, positive v negative | 2.1 | 1.3 to 3.4 | .002 |
| ERG expression, high v low | 1.6 | 1.0 to 2.6 | .04 |
| Age, each 10-year increase | 0.6 | 0.4 to 0.9 | .007 |
| Disease-free survival† | |||
| CEBPA, mutated v wild type | 0.4 | 0.2 to 0.8 | .014 |
| WT1, mutated v wild type | 3.3 | 1.7 to 6.6 | < .001 |
| FLT3-ITD, positive v negative | 1.9 | 1.1 to 3.4 | .006 |
| ERG expression, high v low | 2.7 | 1.2 to 6.1 | .04 |
| Overall survival‡ | |||
| CEBPA, mutated v wild type | 0.3 | 0.2 to 0.6 | < .001 |
| WT1, mutated v wild type | 3.4 | 2.3 to 7.0 | < .0001 |
| NPM1, mutated v wild type | 0.4 | 0.2 to 0.7 | .03 |
| FLT3-ITD, positive v negative | 2.1 | 1.2 to 3.7 | .004 |
| WBC, each 50-unit increase | 1.3 | 1.1 to 1.6 | .002 |
| Extramedullary involvement, no v yes | 2.0 | 1.2 to 3.2 | .01 |
| Molecular high-risk patients | |||
| Event-free survival§ | |||
| CEBPA, mutated v wild type | 0.3 | 0.2 to 0.6 | < .001 |
| WT1, mutated v wild type | 2.0 | 1.1 to 3.7 | .03 |
| Hemoglobin, each 1-unit increase | 0.9 | 0.9 to 1.0 | .04 |
| WBC, each 50-unit increase | 1.3 | 1.0 to 1.6 | .03 |
| Disease-free survival‖ | |||
| CEBPA, mutated v wild type | 0.4 | 0.2 to 0.7 | .004 |
| FLT3-ITD, positive v negative | 1.9 | 1.0 to 3.6 | .008 |
| Hemoglobin | 0.8 | 0.7 to 0.9 | .003 |
| Overall survival¶ | |||
| CEBPA, mutated v wild type | 0.4 | 0.2 to 0.8 | .009 |
| WT1, mutated v wild type | 2.8 | 1.5 to 5.3 | .002 |
| FLT3-ITD, positive v negative | 2.9 | 1.3 to 6.6 | .009 |
Hazard ratios greater than 1 indicate higher risk for an event for the first category listed for categorical variables. Hazard ratios less than 1 indicate lower risk for an event for the higher values of a continuous variable. Hazard ratios greater than 1 indicate higher risk for an event for the higher values of a continuous variable. Variables considered in the model were those significant at α = .20 from the univariable models. FLT3-ITD status and NPM1 mutation status were evaluated in all final models and included if determined to be confounded with the main analysis variable, CEBPA.
Abbreviation: FLT3-ITD, internal tandem duplication of the FLT3 gene.
Variables considered for model inclusion were CEBPA (mutated v wild type), FLT3-ITD (positive v negative), WT1 (mutated v wild type), ERG expression (high v low), BAALC expression (high v low), age, hemoglobin, platelets, WBC, and extramedullary involvement based on their significance from univariable analyses. On the basis of clinical importance, NPM1 (mutated v wild type) was tested in the final model and retained because of its confounding effect on CEBPA. Age did not meet the proportional hazards assumption and, therefore, was evaluated with an artificial time-dependent covariate in the model. The P corresponds to the Wald statistic of a 2-df test evaluating whether the coefficients for age and an artificial time-dependent covariate were equal to 0. The hazard ratio presented is for a 10-year increase in age, evaluated at 3 years.
Variables considered for model inclusion were CEBPA (mutated v wild type), FLT3-ITD (positive v negative), NPM1 (mutated v wild type), WT1 (mutated v wild type), ERG expression (low v high), hemoglobin, WBC, race (white v not white), and extramedullary involvement based on their significance from univariable analyses. NPM1 was retained in the final model along with a time-dependent covariate (because it did not meet the proportional hazards assumption), despite its borderline significance (P = .067), because of its confounding effect on CEBPA. FLT3-ITD did not meet the proportional hazards assumption. The P corresponds to the Wald statistic of a 2-df test test evaluating whether the coefficients for FLT3-ITD and an artificial time-dependent covariate were equal to 0. The hazard ratio presented is for FLT3-ITD–positive v –negative status, evaluated at 8 months from the date of complete remission. ERG did not meet the proportional hazards assumption. The P corresponds to the Wald statistic of a 2-df test evaluating whether the coefficients for ERG and an artificial time-dependent covariate were equal to 0. The hazard ratio provided was evaluated at 1.5 years after achieving complete remission.
Variables considered for model inclusion were CEBPA (mutated v wild type), FLT3-ITD (positive v negative), NPM1 (mutated v wild type), WT1 (mutated v wild type), ERG expression (high v low), BAALC expression (high v low), age, hemoglobin, platelets, WBC, percentage of blood blasts, and extramedullary involvement based on their significance from univariable analyses. FLT3-ITD did not meet the proportional hazards assumption and, therefore, was evaluated with an artificial time-dependent covariate in the model. The P corresponds to the Wald statistic of a 2-df test evaluating whether the coefficients for FLT3-ITD and an artificial time-dependent covariate were equal to 0. The hazard ratio presented is for FLT3-ITD–positive v –negative status, evaluated at 8 months on study. NPM1 did not meet the proportional hazards assumption and, therefore, was evaluated with an artificial time-dependent covariate in the model. The P corresponds to the Wald statistic of a 2-df test evaluating whether the coefficients for NPM1 and an artificial time-dependent covariate were equal to 0. The hazard ratio presented is for NPM1 mutated v wild type, evaluated at 1.5 years on study.
Variables considered for model inclusion were CEBPA (mutated v wild type), FLT3-ITD (positive v negative), WT1 (mutated v wild type), ERG expression (high v low), hemoglobin, and WBC based on their significance from univariable analyses. On the basis of clinical importance, NPM1 (mutated v wild type) and FLT3-ITD (positive v negative) were tested in the final model but were not retained because they were not confounded with CEBPA and were not significant in the final model.
Variables considered for model inclusion were CEBPA (mutated v wild type), FLT3-ITD (positive v negative), FLT3 TKD (positive v negative), WT1 (mutated v wild type), hemoglobin, WBC, and race (white v not white) based on their significance from univariable analyses. On the basis of clinical importance, NPM1 (mutated v wild type) was tested in the final model but was not retained because it was not confounded with CEBPA and was not significant in the final model. FLT3-ITD did not meet the proportional hazards assumption and, therefore, was evaluated with an artificial time-dependent covariate in the model. The P corresponds to the Wald statistic of a 2-df test evaluating whether the coefficients for FLT3-ITD and an artificial time-dependent covariate were equal to 0. The hazard ratio presented is for FLT3-ITD–positive v –negative status, evaluated at 8 months from the date of complete remission.
Variables considered for model inclusion were CEBPA (mutated v wild type), FLT3-ITD (positive v negative), WT1 (mutated v wild type), ERG expression (high vuu low), hemoglobin, platelets, and WBC based on their significance from univariable analyses. On the basis of clinical importance, NPM1 (mutated v wild type) was tested in the final model but was not retained because it was not confounded with CEBPA and was not significant in the final model. FLT3-ITD did not meet the proportional hazards assumption and, therefore, was evaluated with an artificial time-dependent covariate in the model. The P corresponds to the Wald statistic of a 2-df test evaluating whether the coefficients for FLT3-ITD and an artificial time-dependent covariate were equal to 0. The hazard ratio presented is for FLT3-ITD–positive v–negative status, evaluated at 9 months on study.
For gene expression analysis, a filtering step was performed to remove probe sets that displayed low variation in expression across arrays (see Appendix). A comparison of expression of the 23,204 filtered probe sets between patients with (n = 26) and without (n = 81) CEBPA mutations was performed in CN-AML molecular high-risk patients, making an adjustment for protocol. A univariable significance level of α = .001 was used, resulting in approximately 23 expected false-positive probe sets assuming no gene expression differences between the two groups.
For miRNA expression analysis, a comparison of expression of the 305 filtered human miRNA probes between patients with (n = 18) and without (n = 46) CEBPA mutations was performed in patients with molecular high-risk features, making an adjustment for the batch in which arrays were hybridized. A univariable significance level of α = .005 was used, resulting in approximately one or two expected false-positive probes assuming no miRNA expression differences between the two groups.
Microarray gene and miRNA expression analyses were performed using BRB-ArrayTools version 3.4.0 (R. Simon and A.P. Lam, National Cancer Institute, Bethesda, MD) and using the R version 2.3.1 (R Foundation for Statistical Computing, Vienna, Austria). All analyses were performed by the CALGB Statistical Center.
RESULTS
CEBPA Mutations As Predictors of Outcome in AML
Among 175 patients analyzed, 143 (82%) had only CEBPA wild-type alleles (CEBPAwt), whereas 32 (18%) harbored CEBPA mutations. Twenty-one patients had N-terminal mutations (seven alone and 14 concurrent with a C-terminal mutation), and 11 patients had C-terminal mutations only. Four patients had an insertion of six nucleotides predicting for a histidine-proline duplication in the transactivation domain 2 of the encoded protein (CEBPAHP196-197ins) as the only change. Although CEBPAHP196-197ins was previously considered to be a CEBPA mutation,22 it has recently been reported to be a germline polymorphism of the CEBPA gene.35-38 Therefore, we included CEBPAHP196-197ins patients in the CEBPAwt subset.
At diagnosis, patients with CEBPA mutations had significantly higher hemoglobin levels (P = .02), lower platelet counts (P = .009), and lower incidence of extramedullary disease (P = .03) compared with CEBPAwt patients (Table 1). Molecularly, patients with CEBPA mutations were more likely to lack NPM1 mutations (P < .0001) and to be in the molecular high-risk (P < .001) and high BAALC expression (P = .003) groups than CEBPAwt patients. Other pretreatment characteristics (Table 1) and the proportion of patients receiving autologous stem-cell transplantation (88% for mutated CEBPA v 82% for CEBPAwt; P = .76) did not differ between the groups.
Table 1.
Clinical and Molecular Characteristics According to CEBPA Mutational Status in Cytogenetically Normal Acute Myeloid Leukemia Patients
| Characteristic | Mutated CEBPA (n = 32)
|
Wild-Type CEBPA (n = 143)
|
P | ||
|---|---|---|---|---|---|
| No. of Patients | % | No. of Patients | % | ||
| Age, years | .69 | ||||
| Median | 44 | 46 | |||
| Range | 19-59 | 18-59 | |||
| Male | 18 | 56 | 67 | 47 | .43 |
| Race | 1.00 | ||||
| White | 29 | 91 | 126 | 89 | |
| Nonwhite | 3 | 9 | 16 | 11 | |
| Hemoglobin, g/dL | .02 | ||||
| Median | 10.1 | 9.4 | |||
| Range | 4.9-13.4 | 4.8-13.6 | |||
| Platelet count, × 109/L | .009 | ||||
| Median | 38 | 61 | |||
| Range | 7-232 | 11-445 | |||
| WBC, × 109/L | .17 | ||||
| Median | 19.1 | 30.2 | |||
| Range | 4.9-295.0 | 1.4-273.0 | |||
| % of blood blasts | .07 | ||||
| Median | 64.5 | 58 | |||
| Range | 10-97 | 0-95 | |||
| % of bone marrow blasts | .15 | ||||
| Median | 61.5 | 70 | |||
| Range | 26-98 | 10-99 | |||
| Extramedullary disease | 5 | 16 | 50 | 35 | .03 |
| FLT3-ITD | .07 | ||||
| Negative | 24 | 75 | 81 | 57 | |
| Positive | 8 | 25 | 62 | 43 | |
| NPM1 | < .0001 | ||||
| Wild type | 26 | 81 | 32 | 22 | |
| Mutated | 6 | 19 | 111 | 78 | |
| Molecular risk group* | < .001 | ||||
| Low risk | 3 | 9 | 57 | 40 | |
| High risk | 29 | 91 | 86 | 60 | |
| FLT3-TKD | .20 | ||||
| Negative | 31 | 97 | 125 | 88 | |
| Positive | 1 | 3 | 17 | 12 | |
| MLL-PTD | .26 | ||||
| Negative | 28 | 88 | 134 | 94 | |
| Positive | 4 | 12 | 9 | 6 | |
| WT1 | .25 | ||||
| Wild type | 26 | 81 | 119 | 89 | |
| Mutated | 6 | 19 | 15 | 11 | |
| BAALC expression† | .003 | ||||
| Low | 7 | 24 | 58 | 55 | |
| High | 22 | 76 | 47 | 45 | |
| Unkown | 3 | 38 | |||
| ERG expression‡ | .26 | ||||
| Low | 19 | 73 | 62 | 59 | |
| High | 7 | 27 | 43 | 41 | |
| Unknown | 6 | 38 | |||
Abbreviations: FLT3-ITD, internal tandem duplication of the FLT3 gene; FLT3-TKD, tyrosine kinase domain mutations of the FLT3 gene; MLL-PTD, partial tandem duplication of the MLL gene.
Molecular low-risk group is defined by the absence of FLT3-ITD and presence of NPM1 mutation. Molecular high-risk group is defined by the presence of FLT3-ITD and/or the lack of NPM1 mutation.
BAALC expression values were dichotomized at the median to define high and low expressers.
With a median follow-up time of 4.8 years (range, 2.7 to 9.9 years) for patients with no events (ie, failure to achieve CR, relapse, or death), patients with CEBPA mutations had a significantly better EFS than CEBPAwt patients (P = .017); 5-year EFS rates were 53% and 30%, respectively (Fig 1A; Table 2). Patients with CEBPA mutations had a trend for better CR rates (P = .12), DFS (P = .075), and OS (P = .10) compared with CEBPAwt patients (Table 2). In multivariable analyses, CEBPA mutations were independently associated with better EFS (P = .007), DFS (P = .014), and OS (P < .001) after adjusting for other molecular and clinical variables (Table 3). Compared with patients with CEBPAwt, patients with CEBPA mutations had a 60% reduction of the risk for failure to achieve CR, relapse, or death. A multivariable model could not be constructed for CR because most patients (30 of 32 patients) with CEBPA mutations achieved CR.
Fig 1.

Outcome of cytogenetically normal acute myeloid leukemia (CN-AML) according to CEBPA mutational status. (A) Event-free survival of all patients with CN-AML. (B) Event-free survival of patients with molecular high-risk CN-AML (ie, patients with FLT3 internal tandem duplication and/or wild-type NPM1). (C) Disease-free survival of patients with molecular high-risk CN-AML. (D) Overall survival of patients with molecular high-risk CN-AML. CEBPAmut, patients with CEBPA mutations; CEBPAwt, patients with wild-type CEBPA.
Table 2.
Outcomes of Cytogenetically Normal Acute Myeloid Leukemia Patients According to CEBPA Mutational Status
| End Point | Mutated CEBPA | Wild-Type CEBPA | P |
|---|---|---|---|
| All patients | |||
| No. of patients | 32 | 143 | |
| Complete remission | .12 | ||
| No. of patients | 30 | 115 | |
| % | 94 | 80 | |
| Event-free survival | .017 | ||
| Median, years | 5.1 | 0.8 | |
| 5-Year rate, % | 53 | 30 | |
| 95% CI | 35 to 69 | 23 to 38 | |
| Disease-free survival | .075 | ||
| Median, years | Not reached | 1.3 | |
| 5-Year rate, % | 50 | 37 | |
| 95% CI | 30 to 68 | 28 to 46 | |
| Overall survival | .10 | ||
| Median, years | Not reached | 1.9 | |
| 5-Year rate, % | 56 | 41 | |
| 95% CI | 37 to 71 | 33 to 49 | |
| Molecular high-risk patients | |||
| No. of patients | 29 | 86 | |
| Complete remission | .06 | ||
| No. of patients | 27 | 66 | |
| % | 93 | 77 | |
| Event-free survival | < .001 | ||
| Median, years | 5.1 | 0.7 | |
| 5-Year rate, % | 55 | 17 | |
| 95% CI | 36 to 71 | 10 to 26 | |
| Disease-free survival | .001 | ||
| Median, years | Not reached | 0.7 | |
| 5-Year rate, % | 53 | 23 | |
| 95% CI | 31 to 71 | 13 to 33 | |
| Overall survival | .002 | ||
| Median, years | Not reached | 1.2 | |
| 5-Year rate, % | 58 | 27 | |
| 95% CI | 38 to 74 | 18 to 37 |
Because 29 (91%) of 32 patients with CEBPA mutations were in the CN-AML molecular high-risk group, we focused subsequent outcome analyses on this subset. Only three patients in the molecular low-risk group harbored CEBPA mutations; thus, we were unable to evaluate the prognostic significance of CEBPA mutations in this group. Akin to the overall group, in the molecular high-risk subset, patients with CEBPA mutations had lower platelet counts (P = .003) and a trend for higher hemoglobin levels (P = .09; Appendix Table A1, online only). They were also less likely to be FLT3-ITD positive (P < .0001) and harbor NPM1 mutations (P < .0001) than CEBPAwt patients (Appendix Table A1). Frequencies and distribution of mutations and gene expression according to CEBPA mutation status are shown in Appendix Figure A1.
With a median follow-up time of 4.5 years (range, 2.8 to 9.9 years) for patients with no events, patients with CEBPA mutations had better outcomes. Patients with CEBPA mutations, compared with CEBPAwt patients, had a trend for a better CR rate (93% v 77%, respectively; P = .06) and significantly greater 5-year rates of EFS (55% v 17%, respectively; P < .001), DFS (53% v 23%, respectively; P = .001), and OS (58% v 27%, respectively; P = .002; Fig 1B to 1D; Table 2). In a multivariable analysis, CEBPA mutations independently predicted longer EFS (P < .001), after adjusting for WT1 mutational status (P = .03), hemoglobin level (P = .04), and WBC count (P = .03; Table 3). CEBPA mutations also independently predicted longer DFS (P = .004), after adjusting for FLT3-ITD status (P = .008) and hemoglobin level (P = .003), and longer OS (P = .009), after adjusting for FLT3-ITD (P = .009) and WT1 (P = .002) mutational status (Table 3). CEBPA mutations conferred 60% to 70% reduction in the risk of an event compared with CEBPAwt (Table 3). A multivariable model could not be constructed for CR because most patients with CEBPA mutations (27 of 29 patients) achieved CR.
Gene Expression Profiling
To gain insight into the biologic role of CEBPA mutations in the CN-AML molecular high-risk group, we performed both gene and miRNA microarray analyses. A gene expression signature consisting of 2,475 probe sets was associated with CEBPA mutational status. Of the differentially expressed probe sets, approximately 40% were overexpressed in patients with CEBPA mutations. In addition to overexpression of CD34, CD38, and CD7, a prominent characteristic of this signature was the upregulation of genes involved in erythroid differentiation, including GATA1, ZFPM1 (also known as FOG1), HEMGN, EPOR, GFI1B, KLF1, ANK1, TFRC (CD71), and genes encoding erythrocyte membrane proteins and hemoglobin chains in patients with CEBPA mutations (Fig 2). These findings were consistent with higher hemoglobin levels observed in patients with CEBPA mutations at diagnosis. In contrast, genes involved in myeloid differentiation, such as RUNX1, SPI1 (also known as PU.1), and ID1, were downregulated in patients with CEBPA mutations, as were several members of the homeobox family (HOXA1, HOXA2, HOXA3, HOXA4, HOXA6, HOXA5, HOXA7, HOXA9, HOXA10, HOXB2, HOXB3, HOXB4, HOXB5, HOXB6, and MEIS1; Fig 2). In this subset of patients, genes involved in proliferation signaling pathways, such as FLT3, LYN, and members of the RAS superfamily (genes encoding Rho proteins) or their regulators (eg, VAV2 and VAV3), were also downregulated.
Fig 2.
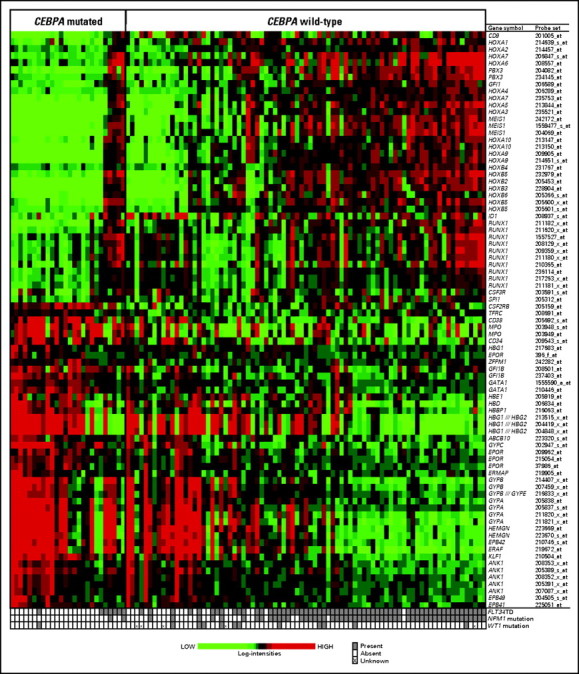
Heat map of selected genes involved in hematopoiesis (ie, erythroid and myeloid lineage and HOX genes) from the gene expression signature associated with CEBPA mutational status in cytogenetically normal acute myeloid leukemia patients in the molecular high-risk group (ie, patients with FLT3 internal tandem duplication and/or wild-type NPM1). Expression values of the probe sets are represented by color, with green indicating expression less than and red indicating expression greater than the median value for the given probe set. For display purposes, the expression values of the probe sets were centered so that each probe set has the same median expression value. Rows represent probe sets, and columns represent patients. Patients are grouped by CEBPA mutational status. Within each CEBPA subgroup, patients are ordered according to a summary measure of the expression of the probe sets displayed in the heat map. The summary measure was a linear combination of the expression values of the probe sets, using the base 2 logarithm of the average fold change in expression (CEBPA mutations/CEBPA wild type) as the coefficient for each expression value.
miRNA Expression Profiling
Within the molecular high-risk group, a unique miRNA expression signature associated with CEBPA mutations was derived. It comprised 15 miRNA probes that were upregulated and two that were downregulated in patients with CEBPA mutations (false discovery rate = .07; ie, only one of the 17 probes was expected to be falsely positive; Fig 3; Appendix Table A2, online only). Eight of the 15 upregulated miRNA probes corresponded to mature members of the miR-181 family known to be involved in erythroid and lymphoid lineage differentiation.39,40 In contrast, no hematopoietic function has been reported for miR-128, miR-192, miR219-1-3p, miR-224, miR-335, or miR-340 to date. Of the downregulated miRNAs, miR-194 has been reported to play a role in intestinal epithelial differentiation, whereas no specific function has been hitherto discovered for miR-34a.41
Fig 3.

Heat map of the microRNA (miRNA) expression signature associated with CEBPA mutational status in cytogenetically normal acute myeloid leukemia patients in the molecular high-risk group (ie, patients with FLT3 internal tandem duplication and/or wild-type NPM1). Expression values of the 17 miRNA probes are represented by color, with green indicating expression less than and red indicating expression greater than the median value for the given probe set. For display purposes, the expression values of the probe sets were centered so that each probe set has the same median expression value. Rows represent probe sets, and columns represent patients. Patients are grouped by the CEBPA mutational status.
DISCUSSION
We report here an independent validation of CEBPA gene mutations as favorable outcome predictors in a relatively large group of CN-AML patients treated similarly on CALGB frontline protocols. To our knowledge, this is the first study demonstrating the predictive value of CEBPA mutations in CN-AML patients who were also tested for multiple other molecular markers predicting outcome, including WT1 mutations and changes in ERG expression. In previous studies, CEBPA mutations provided prognostic information additional to that provided by FLT3-ITD and MLL-PTD,22 FLT3-ITD and BAALC expression levels,10 and the dual mutational status of NPM1 mutated/FLT3-ITD negative.15 We showed, using multivariable models, that CEBPA mutations independently predict favorable outcome, after adjusting for FLT3-ITD, WT1, and NPM1 mutations or ERG expression.
Notably, CEBPA mutations occur preferentially (> 90%) in the molecular high-risk group of CN-AML patients (ie, patients with FLT3-ITD and/or wild-type NPM1). In this molecular subset, CEBPA mutations provided valuable information in addition to that given by FLT3-ITD and WT1 mutations. Patients with CEBPA mutations had significantly lower risk of experiencing induction treatment failure, experiencing relapse, or dying, regardless of the presence or absence of other predictors. These results support risk stratification of CN-AML patients by testing for the presence or absence of CEBPA, NPM1, and WT1 mutations and FLT3-ITD at diagnosis. CN-AML patients in the molecular low-risk group (ie, with NPM1 mutations and no FLT3-ITD) should also be tested for ERG expression because, within this subset, the outcome is excellent for low ERG expressers and poor for high ERG expressers.13
In our analysis, we excluded from the CEBPA-mutated group four patients with CEBPAHP196-197ins as the only CEBPA alteration. Recently, CEBPAHP196-197ins was reported in seven of 19 normal volunteers and in 20 of 100 AML samples;35 the presence of CEBPAHP196-197ins was also detected during CR in four patients studied both at diagnosis and during CR. Similarly, CEBPAHP196-197ins was detected in 22 of 274 nonleukemic blood samples.36 These findings strongly argue that CEBPAHP196-197ins represents a polymorphism of the CEBPA gene, rather than a bona fide CEBPA mutation. Biggio et al38 showed no significant differences in EFS or OS between CN-AML patients with CEBPAHP196-197ins and patients with CEBPA mutations or with CEBPAwt. In our study, there were too few patients to assess clinical outcome of patients with CEBPAHP196-197ins. However, we did not observe significant differences in gene or miRNA expression profiles between patients with CEBPAHP196-197ins and patients with CEBPAwt (data not shown), supporting the notion that CEBPAHP196-197ins is a normal variant of CEBPAwt.
A gene expression signature associated with CEBPA mutations was derived in the CN-AML molecular high-risk group. A striking feature of this signature was the previously unreported association of CEBPA mutations with the upregulation of several genes involved in erythroid differentiation. This was consistent with the higher hemoglobin levels we observed in patients with CEBPA mutations at diagnosis that independently predicted better EFS and DFS in the molecular high-risk group. These results were also consistent with previous laboratory studies investigating hematopoietic differentiation in the absence of CEBPA function. Although normal CEBPA function is essential for inducing normal myeloid differentiation,42 hematopoietic cells lacking CEBPA function are preferentially redirected toward erythroid differentiation.43 Wagner et al44 showed induction of high levels of GATA1, which is tightly controlled and upregulated during erythropoiesis,45,46 and shifting of differentiation from myeloid to erythroid lineage capacity in hematopoietic cells lacking functional CEBPA. In accordance with these findings, we report here that, in the CN-AML molecular high-risk group, CEBPA mutations were associated with upregulation of GATA1, its expression coregulator ZFPM1, and other genes involved in erythroid differentiation. KLF1, which is required for terminal erythroid differentiation, was upregulated in patients with CEBPA mutations along with its target, EPB49, and genes encoding the erythropoietin receptor, erythrocyte membrane proteins, hemoglobin chain proteins, and members of the ATP-binding cassette subfamily with a role in heme biosynthesis.47 In contrast, genes involved in myeloid differentiation, including RUNX1, SPI1, and ID1, a direct target of CEBPA,44 were downregulated. Normal myeloid differentiation requires not only functional CEBPA, but also expression of RUNX1 and SPI1.42 Recent studies reported that SPI1 is a major downstream target of RUNX148 and that GATA1 blocks SPI1-mediated gene transactivation.49 Therefore, it is possible that downregulation of RUNX1 and SPI1 and upregulation of GATA1 contribute to partial erythroid differentiation of blasts carrying CEBPA mutations.
Another prominent feature of the gene expression signature associated with CEBPA mutations was the downregulation of several members of the homeobox family, including genes in the HOXA and HOXB clusters and MEIS. These genes have been previously reported to play an important role in the regulation of early stages of hematopoiesis, including the self-renewal of hematopoietic stem cells/early progenitors, and to become silenced at later stages of maturation. These findings, along with upregulation of CD34 and CD38, support our hypothesis that the clonal cell population carrying CEBPA mutations is represented by a more mature type of malignant blasts.50 These findings are also consistent with the significant association of CEBPA mutations with NPM1 wild-type status, which is reportedly accompanied by downregulation of HOX gene expression.51
We observed that eight of the 17 probes constituting the CEBPA mutation–associated miRNA expression signature were members of the miRNA-181 family. We recently showed that miR-181a and miR-181b were part of an miRNA expression signature associated with outcome in molecular high-risk CN-AML and that their expression was inversely associated with risk of an event (failure to achieve CR, relapse, or death).52 However, it is currently unclear whether changes in miR-181 family expression predict outcome in CN-AML independently of CEBPA mutations. Interestingly, Choong et al40 reported an increase of miR-181a and miR-181b levels during erythroid differentiation. Therefore, it is reasonable to speculate that overexpression of miR-181 family contributes to the partial erythroid differentiation of malignant blasts carrying CEBPA mutations along with the other aforementioned genes.
In conclusion, the presence of mutated CEBPA identifies a subset of patients with better clinical outcome within the molecular high-risk CN-AML group. Consistent with laboratory models, our results of gene expression profiling analysis suggest that lack of functional CEBPA as a result of CEBPA mutations contributes to partial erythroid differentiation of malignant blasts harboring these mutations. Whether it will be possible to exploit these molecular features to design novel therapeutic approaches specific for patients with CEBPA mutations remains to be established. It should also be noted that our results were obtained in younger (< 60 years) patients with primary AML; the frequency and prognostic significance of CEBPA mutations in older (≥ 60 years) patients and patients with secondary AML remain to be determined. Nevertheless, we propose that younger CN-AML patients should be routinely screened for CEBPA mutations to identify patients who, despite having high-risk molecular features, seem not to require intensive treatments, such as allogeneic stem-cell transplantation, during first CR.
AUTHORS’ DISCLOSURES OF POTENTIAL CONFLICTS OF INTEREST
The author(s) indicated no potential conflicts of interest.
AUTHOR CONTRIBUTIONS
Conception and design: Guido Marcucci, Kati Maharry, Michael D. Radmacher, Krzysztof Mrózek, Clara D. Bloomfield
Financial support: Michael A. Caligiuri, Clara D. Bloomfield
Administrative support: Richard A. Larson, Clara D. Bloomfield
Provision of study materials or patients: Guido Marcucci, Bayard L. Powell, Andrew J. Carroll, Michael A. Caligiuri, Jonathan E. Kolitz, Clara D. Bloomfield
Collection and assembly of data: Guido Marcucci, Michael D. Radmacher, Tamara Vukosavljevic, Peter Paschka, Susan P. Whitman, Christian Langer, Claudia D. Baldus, Chang-Gong Liu
Data analysis and interpretation: Guido Marcucci, Kati Maharry, Michael D. Radmacher, Amy S. Ruppert, Clara D. Bloomfield
Manuscript writing: Guido Marcucci, Kati Maharry, Michael D. Radmacher, Krzysztof Mrózek, Clara D. Bloomfield
Final approval of manuscript: Guido Marcucci, Kati Maharry, Michael D. Radmacher, Krzysztof Mrózek, Tamara Vukosavljevic, Peter Paschka, Susan P. Whitman, Christian Langer, Claudia D. Baldus, Chang-Gong Liu, Amy S. Ruppert, Bayard L. Powell, Andrew J. Carroll, Michael A. Caligiuri, Jonathan E. Kolitz, Richard A. Larson, Clara D. Bloomfield
Supplementary Material
Acknowledgments
We thank Donna Bucci of the Cancer and Leukemia Group B Leukemia Tissue Bank and The Ohio State University Comprehensive Cancer Center's Nucleic Acid and Microarray Shared Resources for technical support.
Appendix
The following Cancer and Leukemia Group B institutions, principal investigators, and cytogeneticists participated in this study:
The Ohio State University Medical Center, Columbus, OH: Clara D. Bloomfield, Karl S. Theil, and Nyla A. Heerema (Grant No. CA77658); Wake Forest University School of Medicine, Winston-Salem, NC: David D. Hurd, Wendy L. Flejter, and Mark J. Pettenati (Grant No. CA03927); North Shore University Hospital, Manhasset, NY: Daniel R. Budman and Prasad R.K. Koduru (Grant No. CA35279); Roswell Park Cancer Institute, Buffalo, NY: Ellis G. Levine and AnneMarie W. Block (Grant No. CA02599); Washington University School of Medicine, St Louis, MO: Nancy L. Bartlett, Michael S. Watson, and Jaime Garcia-Heras (Grant No. CA77440); University of Massachusetts Medical Center, Worcester, MA: William W. Walsh, Kathleen Richkind, Michael J. Mitchell, and Patricia Miron (Grant No. CA37135); Dana-Farber Cancer Institute, Boston, MA: Eric P. Winer, Paola Dal Cin, and Cynthia C. Morton (Grant No. CA32291); Dartmouth Medical School, Lebanon, NH: Marc S. Ernstoff and Thuluvancheri K. Mohandas (Grant No. CA04326); University of Iowa Hospitals, Iowa City, IA: Gerald H. Clamon and Shivanand R. Patil (Grant No. CA47642); Massachusetts General Hospital, Boston, MA: Jeffrey W. Clark, Paola Dal Cin, and Cynthia C. Morton (Grant No. CA 12,449); Vermont Cancer Center, Burlington, VT: Hyman B. Muss, Elizabeth F. Allen, and Mary Tang (Grant No. CA77406); University of Puerto Rico School of Medicine, San Juan, Puerto Rico: Eileen I. Pacheco, Cynthia C. Morton, Paola Dal Cin, and Leonard L. Atkins; University of Chicago Medical Center, Chicago, IL: Gini Fleming, Diane Roulston, Katrin M. Carlson, Yanming Zhang, and Michelle M. Le Beau (Grant No. CA41287); University of North Carolina, Chapel Hill, NC: Thomas Shea and Kathleen W. Rao (Grant No. CA47559); Duke University Medical Center, Durham, NC: Jeffrey Crawford and Mazin B. Qumsiyeh (Grant No. CA47577); Christiana Care Health Services, Inc, Newark, DE: Stephen S. Grubbs, Digamber S. Borgaonkar, and Jeanne M. Meck (Grant No. CA45418); Weill Medical College of Cornell University, New York, NY: John Leonard, Prasad R.K. Koduru, Andrew J. Carroll, and Susan Mathew (Grant No. CA07968); University of California at San Diego, San Diego, CA: Barbara A. Parker and Marie L. Dell'Aquila (Grant No. CA11789); Eastern Maine Medical Center, Bangor, ME: Harvey M. Segal and Laurent J. Beauregard (Grant No. CA35406); Ft Wayne Medical Oncology/Hematology, Ft Wayne, IN: Sreenivasa Nattam and Patricia I. Bader; Western Pennsylvania Hospital, Pittsburgh, PA: Richard K. Shadduck and Gerard R. Diggans; Mount Sinai School of Medicine, New York, NY: Lewis R. Silverman and Vesna Najfeld (Grant No. CA04457); Rhode Island Hospital, Providence, RI: William Sikov, Shelly L. Kerman, and Aurelia Meloni-Ehrig (Grant No. CA08025); Southern Nevada Cancer Research Foundation Community Clinical Oncology Program (CCOP), Las Vegas, NV: John Ellerton, Renée Bernstein, and Marie L. Dell'Aquila (Grant No. CA35421); State University of New York Upstate Medical University, Syracuse, NY: Stephen L. Graziano and Constance K. Stein (Grant No. CA21060); University of Missouri/Ellis Fischel Cancer Center, Columbia, MO: Michael C. Perry and Tim H. Huang (Grant No. CA12046); Virginia Commonwealth University MB CCOP, Richmond, VA: John D. Roberts and Colleen Jackson-Cook (Grant No. CA52784); Georgetown University Medical Center, Washington, DC: Minnetta C. Liu and Jeanne M. Meck (Grant No. CA77597); Long Island Jewish Medical Center, Lake Success, NY: Kanti R. Rai and Prasad R.K. Koduru (Grant No. CA11028); Medical University of South Carolina, Charleston, SC: Mark R. Green and G. Shashidhar Pai (Grant No. CA03927); Minneapolis VA Medical Center, Minneapolis, MN: Vicki A. Morrison and Sugandhi A. Tharapel (Grant No. CA47555); University of California at San Francisco, San Francisco, CA: Charles J. Ryan and Kathleen E. Richkind (Grant No. CA60138); University of Minnesota, Minneapolis, MN: Bruce A. Peterson and Betsy A. Hirsch (Grant No. CA16450); University of Illinois at Chicago, Chicago, IL: David J. Peace and Maureen M. McCorquodale (Grant No. CA74811); Walter Reed Army Medical Center, Washington, DC: Thomas Reid and Digamber S. Borgaonkar (Grant No. CA26806).
Treatment
Patients enrolled onto Cancer and Leukemia Group B (CALGB) 19808 were randomly assigned to receive induction chemotherapy with cytarabine, daunorubicin, and etoposide with or without PSC-833, a multidrug resistance protein inhibitor also called valspodar (Kolitz JE, George SL, Marcucci G, et al. Blood 106:122a-123a, 2005 [abstr 407]). On achievement of complete remission (CR), all patients, regardless of the type of induction received, were assigned to intensification with high-dose cytarabine and etoposide for stem-cell mobilization followed by myeloablative treatment with busulfan and etoposide supported by autologous peripheral-blood stem-cell transplantation. Patients who could not receive autologous peripheral-blood stem-cell transplantation received two additional courses of high-dose cytarabine (Kolitz JE, George SL, Barrier R, et al. Blood 102:175a, 2003 [abstr 609]). Patients enrolled onto CALGB 9621 were treated similarly to those on CALGB 19808 (Kolitz JE, George SL, Dodge RK, et al. J Clin Oncol 22:4290-4301, 2004). The only difference was that CALGB 9621 tested dose escalation of daunorubicin and etoposide during induction treatment, whereas the doses of these drugs were the same for all patients enrolled onto CALGB 19808. Additionally, all patients on CALGB 9621 who underwent autologous transplantation (or received the alternative regimen) were assigned to receive interleukin-2, whereas on CALGB 19808, patients were randomly assigned to either receive interleukin-2 or observation.
Definition of Clinical End Points
CR was defined as recovery of morphologically normal bone marrow (BM) and blood counts (ie, neutrophils ≥ 1,500/μL and platelets ≥ 100,000/μL) and no circulating leukemic blasts or evidence of extramedullary leukemia. Relapse was defined by ≥ 5% BM blasts, circulating leukemic blasts, or development of extramedullary leukemia. Event-free survival (EFS) was defined as the interval from the date on study until removal from study as a result of failure to achieve CR, relapse, or death from any cause, whichever occurred first, censoring for patients alive at last follow-up. Disease-free survival was measured from the date of CR until date of relapse or death, regardless of cause, censoring for patients alive at last follow-up. Overall survival was measured from the date on study until date of death, censoring for patients alive at last follow-up.
CEBPA Mutational Analysis
Genomic DNA was isolated from BM or blood cells from samples containing at least 20% blasts using the DNeasy Tissue kit (Qiagen, Valencia, CA) followed by polymerase chain reaction (PCR) amplification of four overlapping regions. These regions cover the entire CEBPA coding sequence and portions of either 5′- or 3′-untranslated regions (Fröhling S, Schlenk RF, Stolze I, et al. J Clin Oncol 22:624-633, 2004). Positive reactions were purified by the QIAquick PCR purification kit or QIAquick Gel Extraction Kit (Qiagen), and the purified PCR products were sequenced on a 3730 DNA Analyzer using the ABI Prism BigDye Terminator Cycle Sequencing Kit version 3.1 (Applied Biosystems, Foster City, CA).
Gene Expression Profiling
Suitable RNA samples from 107 patients in the cytogenetically normal acute myeloid leukemia molecular high-risk group were analyzed using Affymetrix U133 plus 2.0 GeneChips (Affymetrix, Santa Clara, CA), as previously reported for patients enrolled onto CALGB protocols 9621 and 19808 (Whitman SP, Ruppert AS, Radmacher MD, et al. Blood 111:1564-1571, 2008; Radmacher MD, Marcucci G, Ruppert AS, et al. Blood 108:1677-1683, 2006). The outcomes of those 107 patients and of the eight patients whose samples were not studied were similar (median EFS of 0.8 years for both groups; P = .97). From 1.5 to 2 μg of total RNA, double-stranded cDNA was prepared (Invitrogen, Carlsbad, CA) with the use of the T7-Oligo(dT) primer (Affymetrix). In vitro transcription was performed with the BioArray HighYield RNA Transcript Labeling Kit (T7) (Enzo Life Science, Farmingdale, NY). Ten micrograms of fragmented, biotinylated RNA were hybridized to the U133 plus 2.0 GeneChip for 16 hours at 45°C. Scanned images were converted to CEL files using GCOS software (Affymetrix). Summary measures of Affymetrix microarray gene expression were computed for each probe set using the robust multichip average method, which incorporates quantile normalization of arrays (Irizarry RA, Bolstad BM, Collin F, et al. Nucleic Acids Res 31:e15, 2003). Expression values were logged (base 2) before analysis. A filtering step was performed to remove probe sets that displayed low variation in expression across arrays. In this procedure, a χ2 test was used to test whether the observed variance in expression of a probe set was significantly larger than the median observed variance in expression for all probe sets using α = .01 as the significance level; 23,204 probe sets passed the filtering criterion and were included in subsequent analyses.
MicroRNA Expression Profiling
Suitable RNA samples from 64 patients in the cytogenetically normal acute myeloid leukemia molecular high-risk group enrolled onto CALGB protocol 19808 were analyzed for miRNA expression. The outcomes of those 64 patients and of the 51 patients whose samples were not studied were similar (median EFS, 0.8 v 0.9 years, respectively; P = .68). Biotinylated first-strand cDNA from total RNA extracted from pretreatment BM and blood mononuclear cell samples was synthesized using biotin-labeled random octamer primer and was hybridized onto microRNA (miRNA) microarray chips, as previously reported (Liu C-G, Calin GA, Volinia S, et al. Nat Protoc 3:563-578, 2008). Images of the miRNA microarrays were acquired as previously reported (Liu C-G, Calin GA, Volinia S, et al. Nat Protoc 3:563-578, 2008; Calin GA, Ferracin M, Cimmino A, et al. N Engl J Med 353:1793-1801, 2005). The signal intensity was calculated for each spot. Spots with a low signal-to-noise ratio were flagged and considered as missing values. Intensities were log-transformed, and log-intensities from replicate spots were averaged. A median-centering normalization was performed based on all human miRNA probes represented on the array. After normalization, a filtering step excluded miRNA probes that had missing values on 50% or more of arrays, reducing the number of examined human miRNA probes to 305.
Fig A1.

Frequencies and distribution of mutations in the FLT3 (internal tandem duplication [ITD] and tyrosine kinase domain [TKD]), NPM1, MLL (partial tandem duplication [PTD]), and WT1 genes, as well as expression (high v low) of the BAALC and ERG genes among cytogenetically normal acute myeloid leukemia patients in the molecular high-risk group (ie, patients with FLT3-ITD and/or wild-type NPM1) according to CEBPA mutation status. The percentages provided on the right side of the image indicate overall proportions of patients with a given mutation or, in the case of BAALC and ERG expression, proportions of patients classified as high expressers. Only those patients for whom data on all genes were available are included.
Table A1.
Clinical and Molecular Characteristics According to CEBPA Mutational Status in the High-risk Molecular Group (ie, with FLT3-ITD and/or wild-type NPM1) of Cytogenetically Normal Acute Myeloid Leukemia
| Characteristic | Mutated CEBPA (n = 29)
|
Wild-Type CEBPA (n = 86)
|
P | ||||
|---|---|---|---|---|---|---|---|
| No. of Patients | % | No. of Patients | % | ||||
| Age, years | .60 | ||||||
| Median | 43 | 45 | |||||
| Range | 19-59 | 18-59 | |||||
| Male | 16 | 55 | 40 | 47 | .52 | ||
| Race | 1.00 | ||||||
| White | 26 | 90 | 76 | 88 | |||
| Nonwhite | 3 | 10 | 10 | 12 | |||
| Hemoglobin, g/dL | .09 | ||||||
| Median | 10.2 | 9.5 | |||||
| Range | 4.9-13.4 | 6.0-13.6 | |||||
| Platelet count, × 109/L | .003 | ||||||
| Median | 38 | 57 | |||||
| Range | 7-198 | 17-395 | |||||
| WBC, × 109/L | .14 | ||||||
| Median | 19.4 | 30.4 | |||||
| Range | 4.9-295.0 | 1.4-273.0 | |||||
| % of blood blasts | .24 | ||||||
| Median | 68 | 61 | |||||
| Range | 24-97 | 0-95 | |||||
| % of bone marrow blasts | .33 | ||||||
| Median | 63 | 69 | |||||
| Range | 26-98 | 21-99 | |||||
| Extramedullary disease | 4 | 14 | 24 | 28 | .14 | ||
| FLT3-ITD | < .0001 | ||||||
| Negative | 21 | 72 | 24 | 28 | |||
| Positive | 8 | 28 | 62 | 72 | |||
| NPM1 | < .0001 | ||||||
| Wild type | 26 | 90 | 32 | 37 | |||
| Mutated | 3 | 10 | 54 | 63 | |||
| FLT3-TKD | .68 | ||||||
| Negative | 28 | 97 | 79 | 93 | |||
| Positive | 1 | 3 | 6 | 7 | |||
| MLL-PTD | .71 | ||||||
| Negative | 26 | 90 | 79 | 92 | |||
| Positive | 3 | 10 | 7 | 8 | |||
| WT1 | 1.00 | ||||||
| Wild type | 25 | 86 | 69 | 86 | |||
| Mutated | 4 | 14 | 11 | 14 | |||
| BAALC expression* | .34 | ||||||
| Low | 7 | 27 | 24 | 38 | |||
| High | 19 | 73 | 39 | 62 | |||
| ERG expression† | .15 | ||||||
| Low | 17 | 71 | 32 | 51 | |||
| High | 7 | 29 | 31 | 49 | |||
Abbreviations: FLT3-ITD, internal tandem duplication of the FLT3, gene; FLT3-TKD, tyrosine kinase domain mutations of the FLT3 gene; MLL-PTD, partial tandem duplication of the MLL gene.
BAALC expression values were dichotomized at the median to define high and low expressers.
ERG expression values were dichotomized at the median (Cancer and Leukemia Group B 19808 trial) or at the 75th percentile (Cancer and Leukemia Group B 9621 trial) to define high and low expressers.
Table A2.
MiRNAs Comprising the CEBPA Mutation-Associated miRNA Signature, Grouped by Direction of Association with CEBPA Mutations and Ordered by Name of Target miRNA
| miRNA Probe Sequence | Target miRNA | Fold Change: CEBPA Mutations/CEBPA Wild Type | P |
|---|---|---|---|
| Upregulated miRNA | |||
| TCACAGTGAACCGGTCTCTTTCCCTACTGTGTCACACTCC | hsa-miR-128 | 2.19 | .00044 |
| ACATTTCTCACAGTGAACCGGTCTCTTTTTCAGCTGCTTC | hsa-miR-128 | 2.03 | .00029 |
| TGAGGTTGCTTCAGTGAACATTCAACGCTGTCGGTGAGTT | hsa-miR-181a | 2.29 | .00009 |
| TCAGAGGACTCCAAGGAACATTCAACGCTGTCGGTGAGTT | hsa-miR-181a | 2.01 | .00063 |
| ACCATCGACCGTTGATTGTACCCTATGGCTAACCATCATC | hsa-miR-181a* | 1.27 | .00093 |
| TTTAAAAGGTCACAATCAACATTCATTGCTGTCGGTGGGT | hsa-miR-181b | 2.30 | .00003 |
| CTGATGGCTGCACTCAACATTCATTGCTGTCGGTGGGTTT | hsa-miR-181b | 2.25 | .00003 |
| AACATTCATTGCTGTCGGTGGGTTGAACTGTGTGGACAAG | hsa-miR-181b | 1.98 | .00008 |
| TGCCAAGGGTTTGGGGGAACATTCAACCTGTCGGTGAGTT | hsa-miR-181c | 2.10 | .00019 |
| GAGGTCACAATCAACATTCATTGTTGTCGGTGGGTTGTGA | hsa-miR-181d | 2.05 | .00077 |
| CGAGACCGAGTGCACAGGGCTCTGACCTATGAATTGACAG | hsa-miR-192 | 1.41 | .00364 |
| TTGAGTCTGGACGTCCCGAGCCGCCGCCCCCAAACCTCGA | hsa-miR-219-1-3p | 1.67 | .00004 |
| GGCTTTCAAGTCACTAGTGGTTCCGTTTAGTAGATGATTG | hsa-miR-224 | 1.35 | .00382 |
| CGTTTTTCATTATTGCTCCTGACCTCCTCTCATTTGCTAT | hsa-miR-335* | 1.70 | .00026 |
| TGTACCTGGTGTGATTATAAAGCAATGAGACTGATTGTCA | hsa-miR-340 | 1.41 | .00101 |
| Downregulated miRNA | |||
| GAGTGTTTCTTTGGCAGTGTCTTAGCTGGTTGTTGTGAGC | hsa-miR-34a | 0.83 | .00096 |
| TGTAACAGCAACTCCATGTGGACTGTGTACCAATTTCCAG | hsa-miR-194 | 0.81 | .00214 |
Abbreviation: miRNA, microRNA.
published online ahead of print at www.jco.org on September 22, 2008
Supported in part by Grants No. CA101140, CA77658, CA31946, CA09512, CA16058, CA98933, CA90469, CA96887, CA33601, and CA089341 from the National Cancer Institute, Bethesda, MD; the Ohio State University Targeted Investments in Excellence; and the Coleman Leukemia Research Foundation.
Authors’ disclosures of potential conflicts of interest and author contributions are found at the end of this article.
REFERENCES
- 1.Mrózek K, Marcucci G, Paschka P, et al: Clinical relevance of mutations and gene-expression changes in adult acute myeloid leukemia with normal cytogenetics: Are we ready for a prognostically prioritized molecular classification? Blood 109:431-448, 2007 [DOI] [PMC free article] [PubMed] [Google Scholar]
- 2.Whitman SP, Archer KJ, Feng L, et al: Absence of the wild-type allele predicts poor prognosis in adult de novo acute myeloid leukemia with normal cytogenetics and the internal tandem duplication of FLT3: A Cancer and Leukemia Group B study. Cancer Res 61:7233-7239, 2001 [PubMed] [Google Scholar]
- 3.Fröhling S, Schlenk RF, Breitruck J, et al: Prognostic significance of activating FLT3 mutations in younger adults (16 to 60 years) with acute myeloid leukemia and normal cytogenetics: A study of the AML Study Group Ulm. Blood 100:4372-4380, 2002 [DOI] [PubMed] [Google Scholar]
- 4.Thiede C, Steudel C, Mohr B, et al: Analysis of FLT3-activating mutations in 979 patients with acute myelogenous leukemia: Association with FAB subtypes and identification of subgroups with poor prognosis. Blood 99:4326-4335, 2002 [DOI] [PubMed] [Google Scholar]
- 5.Whitman SP, Ruppert AS, Radmacher MD, et al: FLT3 D835/I836 mutations are associated with poor disease-free survival and a distinct gene-expression signature among younger adults with de novo cytogenetically normal acute myeloid leukemia lacking FLT3 internal tandem duplications. Blood 111:1564-1571, 2008 [DOI] [PMC free article] [PubMed] [Google Scholar]
- 6.Paschka P, Marcucci G, Ruppert AS, et al: Wilms tumor 1 gene mutations independently predict poor outcome in adults with cytogenetically normal acute myeloid leukemia: A Cancer and Leukemia Group B study. J Clin Oncol [epub ahead of print on June 16, 2008] [DOI] [PMC free article] [PubMed]
- 7.Virappane P, Gale RE, Hills R, et al: Mutation of the Wilms’ tumor 1 gene is a poor prognostic factor associated with chemoresistance in normal karyotype acute myeloid leukemia. Blood 110:113a, 2007. (abstr 361) [Google Scholar]
- 8.Baldus CD, Tanner SM, Ruppert AS, et al: BAALC expression predicts clinical outcome of de novo acute myeloid leukemia patients with normal cytogenetics: A Cancer and Leukemia Group B study. Blood 102:1613-1618, 2003 [DOI] [PubMed] [Google Scholar]
- 9.Baldus CD, Thiede C, Soucek S, et al: BAALC expression and FLT3 internal tandem duplication mutations in acute myeloid leukemia patients with normal cytogenetics: Prognostic implications. J Clin Oncol 24:790-797, 2006 [DOI] [PubMed] [Google Scholar]
- 10.Bienz M, Ludwig M, Oppliger Leibundgut E, et al: Risk assessment in patients with acute myeloid leukemia and a normal karyotype. Clin Cancer Res 11:1416-1424, 2005 [DOI] [PubMed] [Google Scholar]
- 11.Langer C, Radmacher MD, Ruppert AS, et al: High FLT3 expression associates with other molecular prognostic markers, poor outcome and a distinct gene-expression signature in cytogenetically normal patients younger than 60 years with acute myeloid leukemia: A Cancer and Leukemia Group B (CALGB) study. Blood 111:5371-5379, 2008 [DOI] [PMC free article] [PubMed] [Google Scholar]
- 12.Marcucci G, Baldus CD, Ruppert AS, et al: Overexpression of the ETS-related gene, ERG, predicts a worse outcome in acute myeloid leukemia with normal karyotype: A Cancer and Leukemia Group B study. J Clin Oncol 23:9234-9242, 2005 [DOI] [PubMed] [Google Scholar]
- 13.Marcucci G, Maharry K, Whitman SP, et al: High expression levels of the ETS-related gene, ERG, predict adverse outcome and improve molecular risk-based classification of cytogenetically normal acute myeloid leukemia: A Cancer and Leukemia Group B study. J Clin Oncol 25:3337-3343, 2007 [DOI] [PubMed] [Google Scholar]
- 14.Falini B, Mecucci C, Tiacci E, et al: Cytoplasmic nucleophosmin in acute myelogenous leukemia with a normal karyotype. N Engl J Med 352:254-266, 2005 [DOI] [PubMed] [Google Scholar]
- 15.Döhner K, Schlenk RF, Habdank M, et al: Mutant nucleophosmin (NPM1) predicts favorable prognosis in younger adults with acute myeloid leukemia and normal cytogenetics: Interaction with other gene mutations. Blood 106:3740-3746, 2005 [DOI] [PubMed] [Google Scholar]
- 16.Schnittger S, Schoch C, Kern W, et al: Nucleophosmin gene mutations are predictors of favorable prognosis in acute myelogenous leukemia with a normal karyotype. Blood 106:3733-3739, 2005 [DOI] [PubMed] [Google Scholar]
- 17.Thiede C, Koch S, Creutzig E, et al: Prevalence and prognostic impact of NPM1 mutations in 1485 adult patients with acute myeloid leukemia (AML). Blood 107:4011-4020, 2006 [DOI] [PubMed] [Google Scholar]
- 18.Marcucci G, Mrózek K, Ruppert AS, et al: Prognostic factors and outcome of core binding factor acute myeloid leukemia patients with t(8;21) differ from those of patients with inv(16): A Cancer and Leukemia Group B study. J Clin Oncol 23:5705-5717, 2005 [DOI] [PubMed] [Google Scholar]
- 19.Nerlov C: C/EBPα mutations in acute myeloid leukaemias. Nat Rev Cancer 4:394-400, 2004 [DOI] [PubMed] [Google Scholar]
- 20.Pabst T, Mueller BU, Zhang P, et al: Dominant-negative mutations of CEBPA, encoding CCAAT/enhancer binding protein-α (C/EBPα), in acute myeloid leukemia. Nat Genet 27:263-270, 2001 [DOI] [PubMed] [Google Scholar]
- 21.Gombart AF, Hofmann W-K, Kawano S, et al: Mutations in the gene encoding the transcription factor CCAAT/enhancer binding protein alpha in myelodysplastic syndromes and acute myeloid leukemias. Blood 99:1332-1340, 2002 [DOI] [PubMed] [Google Scholar]
- 22.Fröhling S, Schlenk RF, Stolze I, et al: CEBPA mutations in younger adults with acute myeloid leukemia and normal cytogenetics: Prognostic relevance and analysis of cooperating mutations. J Clin Oncol 22:624-633, 2004 [DOI] [PubMed] [Google Scholar]
- 23.Boissel N, Renneville A, Biggio V, et al: Prevalence, clinical profile, and prognosis of NPM mutations in AML with normal karyotype. Blood 106:3618-3620, 2005 [DOI] [PubMed] [Google Scholar]
- 24.Preudhomme C, Sagot C, Boissel N, et al: Favorable prognostic significance of CEBPA mutations in patients with de novo acute myeloid leukemia: A study from the Acute Leukemia French Association (ALFA). Blood 100:2717-2723, 2002 [DOI] [PubMed] [Google Scholar]
- 25.Barjesteh van Waalwijk van Doorn-Khosrovani S, Erpelinck C, Meijer J, et al: Biallelic mutations in the CEBPA gene and low CEBPA expression levels as prognostic markers in intermediate-risk AML. Hematol J 4:31-40, 2003 [DOI] [PubMed] [Google Scholar]
- 26.Kolitz JE, George SL, Dodge RK, et al: Dose escalation studies of cytarabine, daunorubicin, and etoposide with and without multidrug resistance modulation with PSC-833 in untreated adults with acute myeloid leukemia younger than 60 years: Final induction results of Cancer and Leukemia Group B study 9621. J Clin Oncol 22:4290-4301, 2004 [DOI] [PubMed] [Google Scholar]
- 27.Kolitz JE, George SL, Marcucci G, et al: A randomized comparison of induction therapy for untreated acute myeloid leukemia (AML) in patients < 60 years using P-glycoprotein (Pgp) modulation with Valspodar (PSC833): Preliminary results of Cancer and Leukemia Group B study 19808. Blood 106:122a-123a, 2005. (abstr 407) [Google Scholar]
- 28.Byrd JC, Mrózek K, Dodge RK, et al: Pretreatment cytogenetic abnormalities are predictive of induction success, cumulative incidence of relapse, and overall survival in adult patients with de novo acute myeloid leukemia: Results from Cancer and Leukemia Group B (CALGB 8461). Blood 100:4325-4336, 2002 [DOI] [PubMed] [Google Scholar]
- 29.Yamamoto Y, Kiyoi H, Nakano Y, et al: Activating mutation of D835 within the activation loop of FLT3 in human hematologic malignancies. Blood 97:2434-2439, 2001 [DOI] [PubMed] [Google Scholar]
- 30.Caligiuri MA, Strout MP, Schichman SA, et al: Partial tandem duplication of ALL1 as a recurrent molecular defect in acute myeloid leukemia with trisomy 11. Cancer Res 56:1418-1425, 1996 [PubMed] [Google Scholar]
- 31.Whitman SP, Ruppert AS, Marcucci G, et al: Long-term disease-free survivors with cytogenetically normal acute myeloid leukemia and MLL partial tandem duplication: A Cancer and Leukemia Group B study. Blood 109:5164-5167, 2007 [DOI] [PMC free article] [PubMed] [Google Scholar]
- 32.Radmacher MD, Marcucci G, Ruppert AS, et al: Independent confirmation of a prognostic gene-expression signature in adult acute myeloid leukemia with a normal karyotype: A Cancer and Leukemia Group B study. Blood 108:1677-1683, 2006 [DOI] [PMC free article] [PubMed] [Google Scholar]
- 33.Calin GA, Ferracin M, Cimmino A, et al: A microRNA signature associated with prognosis and progression in chronic lymphocytic leukemia. N Engl J Med 353:1793-1801, 2005 [DOI] [PubMed] [Google Scholar]
- 34.Klein JP, Moeschberger ML: Survival Analysis: Techniques for Censored and Truncated Data. New York, NY, Springer-Verlag, 1997
- 35.Lin L-I, Chen C-Y, Lin D-T, et al: Characterization of CEBPA mutations in acute myeloid leukemia: Most patients with CEBPA mutations have biallelic mutations and show a distinct immunophenotype of the leukemic cells. Clin Cancer Res 11:1372-1379, 2005 [DOI] [PubMed] [Google Scholar]
- 36.Wouters BJ, Louwers I, Valk PJM, et al: A recurrent in-frame insertion in a CEBPA transactivation domain is a polymorphism rather than a mutation that does not affect gene expression profiling-based clustering of AML. Blood 109:389-390, 2007 [DOI] [PubMed] [Google Scholar]
- 37.Resende C, Regalo G, Durães C, et al: Genetic changes of CEBPA in cancer: Mutations or polymorphisms? J Clin Oncol 25:2493-2494, 2007 [DOI] [PubMed] [Google Scholar]
- 38.Biggio V, Renneville A, Nibourel O, et al: Recurrent in-frame insertion in C/EBPalpha TAD2 region is a polymorphism without prognostic value in AML. Leukemia 22:655-657, 2008 [DOI] [PubMed] [Google Scholar]
- 39.Chen CZ, Li L, Lodish HF, et al: MicroRNAs modulate hematopoietic lineage differentiation. Science 303:83-86, 2004 [DOI] [PubMed] [Google Scholar]
- 40.Choong ML, Yang HH, McNiece I: MicroRNA expression profiling during human cord blood-derived CD34 cell erythropoiesis. Exp Hematol 35:551-564, 2007 [DOI] [PubMed] [Google Scholar]
- 41.Hino K, Fukao T, Watanabe M: Regulatory interaction of HNF1-alpha to microRNA-194 gene during intestinal epithelial cell differentiation. Nucleic Acids Symp Ser (Oxf) (51):415-416, 2007 [DOI] [PubMed] [Google Scholar]
- 42.Tenen DG: Disruption of differentiation in human cancer: AML shows the way. Nat Rev Cancer 3:89-101, 2003 [DOI] [PubMed] [Google Scholar]
- 43.Cammenga J, Mulloy JC, Berguido FJ, et al: Induction of C/EBPalpha activity alters gene expression and differentiation of human CD34+ cells. Blood 101:2206-2214, 2003 [DOI] [PubMed] [Google Scholar]
- 44.Wagner K, Zhang P, Rosenbauer F, et al: Absence of the transcription factor CCAAT enhancer binding protein alpha results in loss of myeloid identity in bcr/abl-induced malignancy. Proc Natl Acad Sci U S A 103:6338-6343, 2006 [DOI] [PMC free article] [PubMed] [Google Scholar]
- 45.Heyworth C, Pearson S, May G, et al: Transcription factor-mediated lineage switching reveals plasticity in primary committed progenitor cells. EMBO J 21:3770-3781, 2002 [DOI] [PMC free article] [PubMed] [Google Scholar]
- 46.Iwasaki H, Mizuno S, Wells RA, et al: GATA-1 converts lymphoid and myelomonocytic progenitors into the megakaryocyte/erythrocyte lineages. Immunity 19:451-462, 2003 [DOI] [PubMed] [Google Scholar]
- 47.Ney PA: Gene expression during terminal erythroid differentiation. Curr Opin Hematol 13:203-208, 2006 [DOI] [PubMed] [Google Scholar]
- 48.Huang G, Zhang P, Hirai H, et al: PU.1 is a major downstream target of AML1 (RUNX1) in adult mouse hematopoiesis. Nat Genet 40:51-60, 2008 [DOI] [PubMed] [Google Scholar]
- 49.Zhang P, Behre G, Pan J, et al: Negative cross-talk between hematopoietic regulators: GATA proteins repress PU.1. Proc Natl Acad Sci U S A 96:8705-8710, 1999 [DOI] [PMC free article] [PubMed] [Google Scholar]
- 50.Argiropoulos B, Humphries RK: Hox genes in hematopoiesis and leukemogenesis. Oncogene 26:6766-6776, 2007 [DOI] [PubMed] [Google Scholar]
- 51.Levis M, Murphy KM, Pham R, et al: Internal tandem duplications of the FLT3 gene are present in leukemia stem cells. Blood 106:673-680, 2005 [DOI] [PMC free article] [PubMed] [Google Scholar]
- 52.Marcucci G, Radmacher MD, Maharry K, et al: MicroRNA expression in cytogenetically normal acute myeloid leukemia. N Engl J Med 358:1919-1928, 2008 [DOI] [PubMed] [Google Scholar]
Associated Data
This section collects any data citations, data availability statements, or supplementary materials included in this article.