Abstract
Microarrays are frequently used to profile genome-wide copy number (CN) aberrations. While generally robust for detecting CN variants in germline DNA, the methods used to derive CN from signal intensity values have been suboptimal when applied to cancer genomes. The complexity of genomic aberrations in cancer makes it more difficult to discriminate between signal and noise, and measuring CN as a discrete variable does not account for tumor heterogeneity. Furthermore, standard normalization approaches detect CN changes relative to the overall DNA content, which is often not diploid in cancer. We propose an algorithm that uses the degree of allelic imbalance as well as probe intensity, with a correction for aneuploidy, for a quantitative CN assessment and scoring of allelic ratios. This algorithm results in a more precise definition of CN and allelic aberration in the cancer genome, which is essential for translational efforts focused on using these tools for molecular diagnostics and for the discovery of therapeutic targets.
Tumor genomics play a critical role in our understanding of cancer. Copy number (CN) aberrations are associated with clinical outcome: for example, amplification of the MYCN proto-oncogene or loss of chromosome arm 1p or 11q predicts for decreased patient survival in neuroblastoma independent of clinical risk factors such as disease stage (Seeger et al. 1985; Attiyeh et al. 2005). CN aberrations have often been the first clue leading to the discovery of oncogenes or tumor suppressor genes (Mosse et al. 2008). Overall changes in cellular DNA content resulting in aneuploidy are also clinically relevant in human malignancies such as acute lymphoblastic leukemia and neuroblastoma (Look et al. 1991; Pui et al. 2004; George et al. 2005).
Microarrays have been used for profiling genome-wide CN aberrations. Comparative genomic hybridization (CGH) relies on measuring the hybridization intensity of target DNA to genomic or oligonucleotide DNA probes to determine CN gains and losses (Albertson and Pinkel 2003). Single nucleotide polymorphism (SNP)-based genotyping arrays not only allow for the detection of signal intensity measures, but also yield genotype data that are used to infer loss of heterozygosity (LOH) (Bignell et al. 2004; Zhao et al. 2004; Peiffer et al. 2006; Wang et al. 2007). The intensity values from each oligonucleotide probe on these arrays are normalized to a standard scale, and CN aberrations are typically determined by measuring total hybridization intensity.
While generally accurate and robust for germline copy number variant (CNV) discovery, there are two potential problems common to these platforms. The first is the reliance on measuring probe intensity to determine CN. The relationship between signal and CN is not linear and subject to saturation effects. Furthermore, determining gains and losses based on signal intensity alone requires the establishment of arbitrary intensity cutoff values, which are necessarily compromises balancing signal and noise. The CN values returned are typically integers and, in the case of tumor sample analyses, ignore the effect of stromal contamination and tumor heterogeneity, which can only be measured with fractional CNs (e.g., a locus present in three copies in a tumor with 50% stromal contamination has an “apparent” CN of 2.5). The second problem occurs with aneuploid cells, which are frequently seen in cancer. Standard normalization approaches essentially treat the cell as if it had a diploid genome, and the relative gains and losses are reported relative to a CN of 2. For example, a perfectly tetraploid cell will appear normal (diploid) using the approach applied to most CGH platforms; however, in a near-tetraploid cell that has three copies of chromosome 1 and four copies of every other chromosome, the tetraploid chromosomes will be scored as two copies while chromosome 1 will be scored as approximately one copy (Ishikawa et al. 2005).
Recent advances in single nucleotide extension chemistry on SNP microarrays have led to highly accurate genotyping of up to 1 million SNPs simultaneously (Kennedy et al. 2003; Gunderson et al. 2005; Peiffer et al. 2006; Steemers et al. 2006). There is increasing interest in using these same arrays to determine germline and/or cancer CN variations, but the decreased signal-to-noise ratio at the individual probe level compared to platforms using longer oligonucleotides or PCR products from cloned DNA makes this challenging. To address these issues, we propose an algorithm that uses both the degree of allelic imbalance as well as the probe intensity for quantitative CN assessment, scoring of allelic ratios, and mapping segments of aberration. Unique to this algorithm is the intrinsic correction for aneuploidy leading to a more accurate quantification of alleles present in cancer cells.
Methods
SNP array genotyping
Tumor DNA samples from 488 primary neuroblastomas and a primitive neuroectodermal tumor were obtained from the Children's Hospital of Philadelphia and the Children's Oncology Group. Immediately after surgical removal, tumor samples were snap-frozen or placed in tissue-culture media and shipped to a central reference laboratory for studies of tumor biology. The amplification status of MYCN was determined with the use of immunohistochemical analysis (Seeger et al. 1988), fluorescence in situ hybridization (Mathew et al. 2001), or Southern blotting (Seeger et al. 1985). Histopathological analysis was performed according to central review with the use of the method of Shimada et al. (1984). The DNA index was defined with the use of flow cytometry, as previously described (Look et al. 1991). DNA from the tumor and blood or uninvolved bone marrow was prepared with the use of anion-exchange chromatography (QIAGEN). Samples were processed by the Center for Applied Genomics at Children's Hospital, which operates a high-throughput Illumina BeadLab Genotyping System that uses customized standard operating procedures based on the manufacturer's specifications (Peiffer et al. 2006; Hakonarson et al. 2007; Maris et al. 2008).
Data transformation
The Illumina Infinium II arrays contain a probe sequence for each interrogated SNP; the discrimination between the A and B alleles is performed by a single nucleotide extension step using two-dye chemistry, and the signal intensity of each allele is read (Gunderson et al. 2005; Steemers et al. 2006). The sum of the measured intensities is used to calculate the log R ratio (LRR), which is related to the total probe intensity of a given SNP relative to a canonical set of normal controls. For a given SNP, the ratio of the measured intensities from the two alleles is used to determine the B allele frequency (BAF), which indicates the relative quantity of the one allele compared to the other. This measurement is highly reproducible and accurate as it relies on a single base-pair extension step for discriminating between the two alleles and not on any measure of differential hybridization (Fan et al. 2006). This metric also reduces the effect of SNP-to-SNP hybridization variation by being a function of the ratio of the two allele intensities.
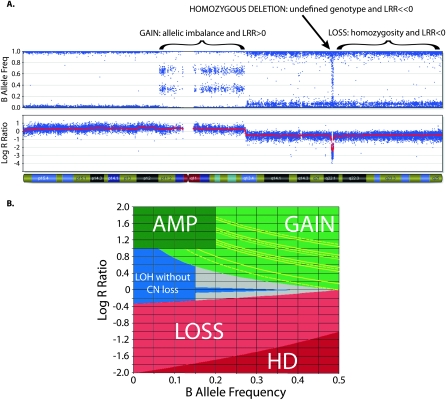
Homozygous SNPs have BAFs near 0 (AA) or 1 (BB). These genotypes are also seen in regions of single copy allelic loss. Heterozygous two-copy SNPs have BAFs near 0.5 (AB). Allelic imbalance results in intermediate values: for example, a SNP present in three copies will have four possible genotypes (AAA, AAB, ABB, or BBB), thus giving possible BAFs of 0, 0.33, 0.67, or 1. Examples of the effect of CN aberrations on BAF and LRR are shown in Figure 1A.
Figure 1.
Copy number (CN) determination using B allele frequency (BAF) and Log R ratio (LRR) across a single chromosome of a primary neuroblastoma. (A) A chromosome is displayed, from the short arm on the left to the long arm on the right. (Top plot) BAF values range from 0 to 1: areas of homozygosity have BAF of 0 or 1; normal diploid regions have BAF of 0, 0.5, or 1; areas of allelic imbalance show intermediate values; homozygous deletions have no detectable signal so the calculated BAF appears as noise. (Bottom plot) LRR values of 0 represent two copies with lower values in areas of loss and higher values in areas of gain. (B) Illustrates how CN is determined using LRR as a function of BAF. Each SNP window has a median LRR and median BAF, which fall in a colored zone in the plot; CN is then calculated based on the BAF for (green zone) gains and (red zone) losses. Gains can further be characterized by their number of minor alleles (NOMA). The yellow lines outline call zones for NOMA 1 (lowest LRR) to NOMA 4 (highest LRR). (Blue zone) Homozygous SNPs whose LRR is not consistent with loss have CN of 2 or higher with LOH; those CN are calculated based on the LRR. CN for amplifications (AMP) is also based on the LRR, while homozygous deletions (HD) have CN of 0. SNPs that fall in the gray zone are undetermined; CN is determined by interpolation.
The possible genotypes resulting from an allelic gain depend on the mechanism of gain. Duplication of a single allele, as is often seen in cancer and in germline CNVs, results in four possible genotypes: An (homozygous A), Bn (homozygous B), An−1B (A allele duplicated), and ABn−1 (B allele duplicated). Here, the degree of allelic imbalance (i.e., the relative amount of the B allele) is directly related to CN. For example, four copies result in BAFs of 0, 0.25, 0.75, or 1, while five copies result in BAFs of 0, 0.2, 0.8, or 1. Alternatively, in aneuploid cancer cells, there often is a balanced duplication of both alleles, resulting in the three genotypes seen in the normal diploid state (AA, AB, and BB). However, this differs from the normal two-copy state since the total probe intensity, as measured by the LRR, will be increased. Certainly, more complex CN aberrations also occur in cancer. Mitotic disjunction events can occur before or after allelic gains or losses, resulting in different degrees of allelic imbalance for a given CN. For example, the ratio of major to minor alleles in a six-copy gain could be 6:0, 5:1, 4:2, or 3:3. Although these would all have the same probe intensity (LRR) value, the BAF would distinguish between these states. Thus, higher-order gains can be distinguished based on the number of minor alleles (NOMA) present. In the six-copy gain example above, the NOMA values would be 0, 1, 2, or 3, respectively.
We used quantitative genotype data to integrate total intensity (LRR) and allelic ratio (BAF) for a more accurate assessment of genomic alterations in cancer cells. As shown in Figures 1A and 2, the BAF plot across a chromosome shows equal distribution above and below 0.5. In order to simplify the algorithm, we transform the BAF values > 0.5 so that they range from 0 to 0.5 (Equation 1).
 |
Figure 2.
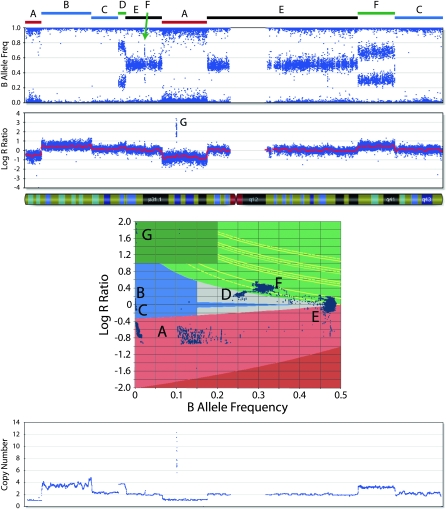
B allele frequency (BAF) and log R ratio (LRR) across a single chromosome of a neuroblastoma cell line. The annotated chromosome regions (A–G) are plotted in the two-dimensional scatterplot of LRR and BAF. The regions labeled A are CN losses and fall in the light red zone (the nonzero BAF represents the presence of a minority of cells without the loss in the sample). The regions labeled B and C represent LOH without CN loss and fall in the blue zone (region B denotes LOH with CN gain). Region D is a four-copy gain with BAF ≈ 0.25 and increased LRR. The regions labeled E are made up of heterozygous SNPs present in two copies. The regions labeled F represent three-copy gains with BAF ≈ 0.33 and increased LRR. Region G denotes an amplification where the very high LRR is sufficient to distinguish it. (Bottom plot) CN as determined by the algorithm that detects the losses, the three- and four-copy gains, and the amplification.
Aneuploidy correction
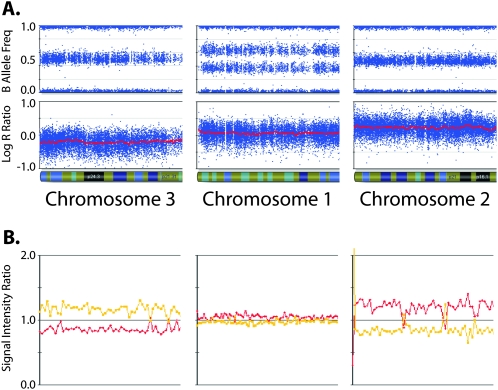
Aneuploidy affects chip-wide normalization, which is originally performed such that diploid SNPs in a diploid genome (DNA index = 1) have LRR = 0. In hyperdiploid samples, this normalization assigns LRR = 0 to SNPs whose CN corresponds to the overall DNA index; therefore, SNPs with fewer copies (i.e., diploid in a hyperdiploid sample) will display negative LRRs. As shown in Figure 3, this results in chromosomes with balanced genotypes (BAF = 0.5, indicating the presence of at least two copies) having negative LRRs (suggesting a CN loss). The normalized signals of the A and B alleles for an aneuploid sample can be corrected for the degree of hyperdiploidy by multiplying each of those values by the DNA index. This is equivalent to adding the log2 of the DNA index to the LRR.
Figure 3.
Aneuploidy affects chip-wide normalization. Data from three chromosome arms from a near-triploid neuroblastoma sample (DNA index = 1.43) assayed on the SNP array (A) as well as on a BAC-based aCGH platform (B). The leftmost chromosome shows decreased LRR and aCGH intensity ratio; the middle chromosome shows “normal” baseline LRR and aCGH intensity ratio; the rightmost chromosome shows increased LRR and aCGH intensity ratio. These intensity values imply CN = 1 for chromosome 3, which is inconsistent with the presence of heterozygous SNPs (BAF of 0.5). The LRR values would also imply CN = 2 for chromosome 1, which is inconsistent with the allelic imbalance seen in the BAF plot.
We determine the aneuploidy correction factor by examining the LRR distribution for SNPs with certain BAFs. SNPs with BAF near 0.5 must have even-numbered CNs (2, 4, 6, or 8) so each mode of the LRR distribution must correspond to one of those CNs. Similarly, SNPs with BAF near 0.33 must have CNs that are multiples of three (3, 6, or 9), and SNPs with BAF near 0.4 must be present in either five or seven copies. Therefore, each LRR mode from these three distributions can be associated with a limited number of possible CNs. Sorting the list of LRR modes helps eliminate some of the possibilities; for example, if there are two LRR modes associated with BAF near 0.5, then the greater of the two modes cannot represent two copies. Furthermore, examining the difference between each pair of LRR modes often results in a single pair of CNs consistent with the data. For example, when comparing the difference between two modes associated with BAF near 0.33, each possible pair of CNs (3 and 6, 3 and 9, or 6 and 9) can be clearly distinguished because the LRR difference between each pair is unique. Similarly, if a LRR mode associated with BAF near 0.5 and a LRR mode associated with BAF near 0.33 are equal, then the CN corresponding to that LRR must be 6 (since that is the only possibility that is both a multiple of two and a multiple of three).
This resulting aneuploidy correction factor can then be added to each LRR across the genome. In a hyperdiploid sample, this correction results in diploid SNPs having LRRs near zero and SNPs with more than two copies having LRRs > 0. The corrected LRR values can then be used for CN determination.
CN determination
For each SNP, a flexible user-defined window of SNPs proximal and distal to that SNP is defined. Within that window, a median BAF is calculated: if there are greater than or equal to three SNPs with BAF > 0.1 (i.e., heterozygous), calculate the median of those BAFs; if there are fewer than three SNPs with BAF > 0.1 (i.e., homozygous), calculate the median of the BAFs < 0.1. A median LRR is also calculated using the LRRs of all SNPs in the window.
As CN is a function of both LRR and BAF (Equation 2), we can derive LRR as a function of BAF in regions of loss and gain (Equation 3).
 |
 |
These equations define zones that determine if a given SNP window is in a region of loss or gain based on its median BAF and median LRR (Fig. 1B). The curves defining “loss” and “gain” (i.e., the boundaries of the green and red areas) were derived from the theoretical relationship between LRR, BAF, and CN shown in Equation 3. The yellow curves outlining the areas of higher-order gain also respect the relationship between LRR and BAF in areas of gain, with the offset from the baseline derived empirically. CN is then calculated as a function of BAF according to the appropriate line in Equation 2. CNs for homozygous SNP windows are determined based on median LRR (Equation 2). The gray areas in Figure 1B represent zones where SNPs are undetermined, as they do not fall clearly into any given call zone. SNPs with undefined CN are resolved by interpolation: if one of the bordering defined SNPs is diploid and the other is aberrant, then the undefined area is filled with the aberrant CN; otherwise, the undefined region is filled using an average of the CNs of the bordering defined SNPs.
Amplifications and homozygous deletions are determined based on large deviations of median LRR. For each SNP, a window of five SNPs (two proximal, two distal, and the SNP in question) is considered to calculate a median LRR. Values above 1.0 with allelic imbalance define amplifications while values that are 1 log below the theoretical LRR for loss define homozygous deletions (Fig. 1).
Fluorescence in situ hybridization (FISH)
Touch imprints from frozen tissue and nuclei from cytogenetic cell pellets from a primary primitive neuroectodermal tumor were analyzed by FISH. The MYC, chromosome eight centromere, and MLL probe sets were purchased from Vysis (Abbott Laboratories). Cosmid clones for chromosome bands 17p13.3 (D17S34) and 17q25 (D17S75) were labeled by nick translation with ChromoTide AlexaFluor 594-dUTP or ChromoTide fluorescein-12-dUTP (Molecular Probes). The probes were applied to slides of the tumor cells and co-denatured at 75°C on an Isotemp 125D heat block (Fisher Scientific). Slides were incubated overnight at 37°C in a moist slide moat (Boekel Scientific). They were then washed in a 0.4× SSC solution for 2 min at 73°C, followed by a 1-min wash in 2× SSC/0.1% NP-40 and counterstained with DAPI (Sigma). Fluorescent signals from 100 to 200 cells were evaluated at 100× with a Nikon Eclipse E800 fluorescence microscope equipped with the proper filter sets. An Applied Imaging System was used to record images of representative cells.
Algorithm implementation
The algorithm was implemented using the C# programming language as a plug-in to the manufacturer's BeadStudio analysis suite (see http://stokes.chop.edu/cancerCN).
Other CN algorithms
The Illumina CN Estimate was run within Illumina BeadStudio using the default window sizes of 1 Mb (default setting) and 100 kb (adjusted setting). PennCNV was downloaded from http://www.neurogenome.org/cnv/penncnv/ and applied with the default settings and with an HMM file lowering the cutoff for three-copy gain from 0.39 (default) to 0.2 (adjusted). Circular binary segmentation (CBS) was downloaded from http://www.bioconductor.org/ and run with the following parameters: smooth outliers = yes, nperm = 1000, and alpha = 0.01 (default) or alpha = 0.05 (adjusted). A region of gain was defined if the intensity ratio of a segment was >0.15.
Results
CN determination
A representative plot of CN determined by this algorithm is shown in Figure 2. Areas of CN loss correspond to regions without heterozygous SNPs and with decreased LRRs. Large regions of copy-neutral LOH or LOH with CN gain are identified based on their normal or increased LRR. Two large areas of gain without LOH are seen: the largest region on the long arm contains three copies, while the next largest one on the short arm contains four copies. This difference is clearly distinguished at the BAF level, while the change in LRR is more subtle and likely to be missed. The CN determinations result from the clear delineation of the CN aberrations in the two-dimensional scatterplot.
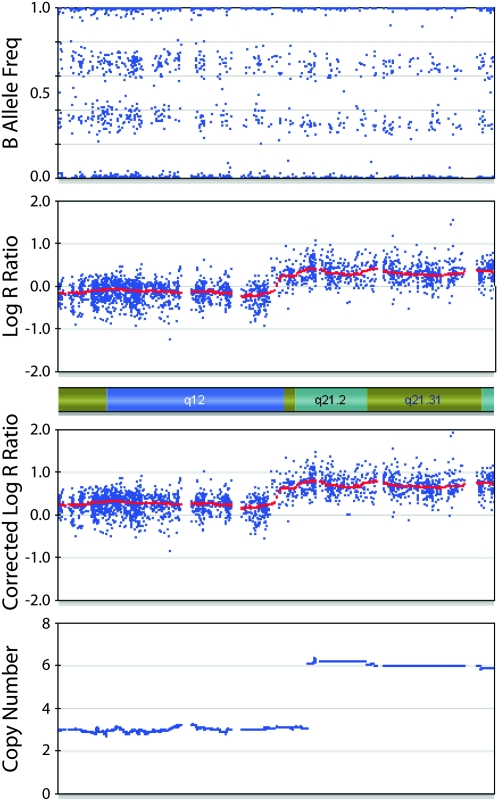
The chromosomal segment in Figure 4 demonstrates how BAF is integrated with LRR after correction for aneuploidy. If only the LRR is considered, there appears to be a normal diploid region (LRR = 0) and a region of gain (LRR > 0). However, the BAF of ∼0.33 across the entire segment indicates that there is one copy of the minor allele for every two copies of the major allele; therefore, the absolute CN is a multiple of three (3, 6, 9, or greater). Correction for aneuploidy results in a positive LRR, and the clear difference in LRR can then be used to discriminate between the three-copy region (with one minor allele) and the six-copy region (with two minor alleles).
Figure 4.
Corrected LRR and CN of a chromosomal segment from a primary neuroblastoma. The top two plots show BAF and LRR. The third plot shows the LRR after correction for aneuploidy. The change in LRR across the segment indicates a change in CN. The relatively constant BAF of ∼0.33 restricts the possible CNs to multiples of three. After correcting for aneuploidy, the LRR values are most consistent with a region of three copies on the left and a region of six copies on the right. Algorithm output is shown in the bottom plot.
Validation
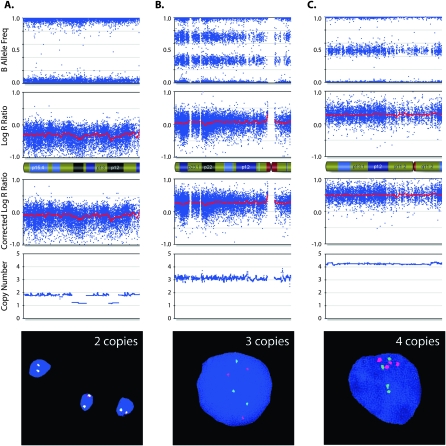
In order to validate this approach, we analyzed samples for which CN was characterized using standard non-microarray-based methods: FISH, karyotype, and DNA index by flow cytometry. Figure 5 shows three different chromosomes from a single hyperdiploid sample. Despite the low LRR in Figure 5A, correction for aneuploidy results in a LRR of 0 across the chromosome and a subsequent CN determination of 2. Despite the LRR of 0 in Figure 5B, correction for aneuploidy results in an increased LRR and a subsequent CN determination of 3. Similarly, the aneuploidy correction in Figure 5C results in a significantly elevated LRR and a CN determination of 4. These CNs were confirmed as shown in the corresponding FISH images.
Figure 5.
Correcting the LRR for aneuploidy improves CN determination. Data from three chromosome arms from a primitive neuroectodermal tumor assayed on the SNP array and analyzed by FISH. The top two rows of plots show BAF and LRR. The third row shows the LRR after correction for aneuploidy. Considering the corrected LRR values in conjunction with the BAF leads to the CN determinations plotted in the fourth row, which reflect the number of copies seen in the FISH images at the bottom. (A) The chromosome initially appears to be a CN loss (homozygous and negative LRR), but is present in two copies by FISH; this is consistent with the corrected LRR near 0. (B,C) Similarly, the corrected LRR reflects the correct CN of three and four copies, respectively.
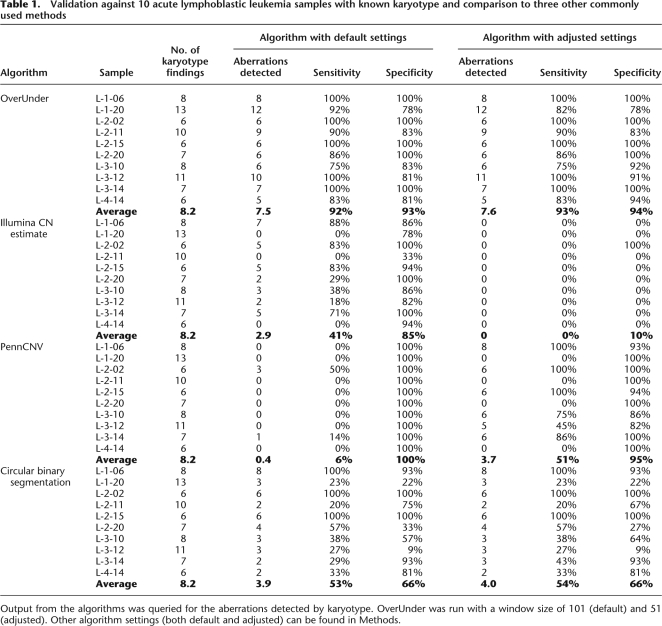
We also analyzed a set of acute lymphoblastic leukemia samples where karyotype information from a clinical cytogenetics lab was available to serve as a CN reference. We compared the output from our algorithm (OverUnder) to the output from three other widely used methods: the Illumina CN Estimate, a hidden Markov model–based method (PennCNV) (Wang et al. 2007), and CBS (Olshen et al. 2004; Venkatraman and Olshen 2007). These data are summarized in Table 1, which lists the number (and frequency) of karyotype findings correctly called by the various algorithms. In order to be scored as correctly identifying an aberration, we required our algorithm to detect the actual CN correctly (i.e., distinguish three copies from four copies). Since the other algorithms generally only report intensity ratios or discrete CN states (i.e., “gain” or “loss”), they were deemed correct if they detected the appropriate type of aberration. Despite the lower standard, the algorithms designed to study constitutional DNA did not perform as well as our approach did when analyzing cancer genomes. The sensitivity of the other methods to detecting absolute CN changes did not significantly improve with adjusted settings.
Table 1.
Validation against 10 acute lymphoblastic leukemia samples with known karyotype and comparison to three other commonly used methods
Output from the algorithms was queried for the aberrations detected by karyotype. OverUnder was run with a window size of 101 (default) and 51 (adjusted). Other algorithm settings (both default and adjusted) can be found in Methods.
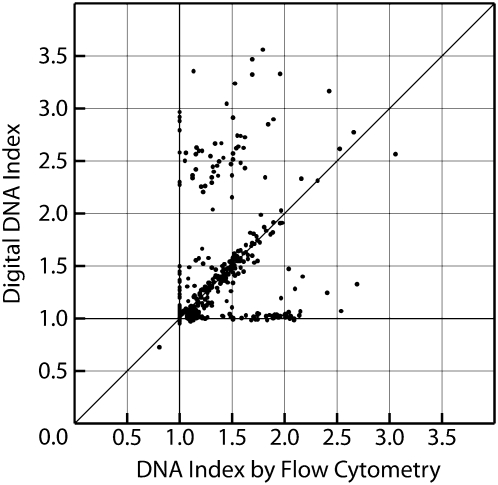
We performed a more global validation by estimating the DNA index of the sample as the average CN of all SNPs. We estimated the DNA index based on this approach for 488 primary neuroblastoma samples for which the DNA index was previously determined by flow cytometry as part of the clinical evaluation of children with neuroblastoma. For 349 out of 488 (72%) samples, this estimate is nearly identical to the DNA index value determined by flow cytometry (Fig. 6).
Figure 6.
The digital DNA index estimates the value determined by flow cytometry in 488 neuroblastomas. DNA index was determined by flow cytometry as part of the clinical evaluation of children with neuroblastoma. For 349 out of 488 (72%) samples, the digital DNA index (average CN of all SNPs divided by two) matched the flow cytometry value. Discordant samples are shown that are not detected to be significantly aneuploid by either method.
Discussion
Our approach to maximize the data from SNP arrays for highly accurate allelic quantification uses four complementary methods to overcome some of the existing problems with genomic array analysis. First, CN is ultimately calculated based on the BAF and not the LRR. As with previous platforms, relying on the LRR would introduce an unacceptable level of noise for any given cutoff value. Since the BAF is calculated based on the ratio of the separate allele signals, it is significantly more robust as the effects of differential hybridization are greatly reduced. CN aberrations that have very similar LRR values (e.g., three copies vs. four copies) are clearly distinguishable by their BAF. Conversely, CN aberrations that have similar BAF (e.g., three copies with one minor allele vs. six copies with two minor alleles as shown in Fig. 4) will have largely different LRR values since they represent large changes in CN.
Second, unlike many other algorithms that model their data into discrete states (Lamy et al. 2007; Wang et al. 2007), CN is calculated as a continuous variable. Solid tumor samples are inherently “contaminated” with diploid genomes, both from surrounding and infiltrating normal somatic tissue as well as from intratumoral heterogeneity. There is currently no way to distinguish these from each other from microarray data. The best one can achieve is to infer a “maximal” degree of normal tissue contamination by finding the area of LOH closest to 100% LOH. When that maximal degree of normal tissue contamination is 0% (i.e., the sample has regions of pure 100% LOH and therefore no normal tissue contamination), then one can safely conclude that other areas of diploid contamination result from tumor heterogeneity. However, in other cases, it would be problematic to assume that the presence of diploid tissue is entirely due to normal tissue contamination. Factoring it out would potentially result in the loss of interesting tumor heterogeneity data.
The effect of normal contamination on the allelic ratio is analogous to its effect on the probe intensity. For example, in the case of a three-copy gain in a sample with 50% normal contamination, the “apparent” CN is 2.5 (i.e., average of the two CNs since they are present in equal proportions). The probe intensity value would therefore not be normal, nor would it be high enough to correspond to a CN of 3; it would be somewhere in the middle. Similarly, the allelic ratio would not be normal (50%), nor would it be at a level corresponding to three copies (33%). Since we calculate CN as the inverse of the allelic ratio (in regions of gain; see Equation 2), an intermediate allelic ratio of 40% would result in a calculated CN of 2.5. Similarly, a region of loss present in only 50% of the tumor tissue will be scored as CN = 1.5, which conveys more information than a simple determination of “loss.” Determining how widespread an aberration is in a tumor sample can be used to infer how genomic aberrations are associated with tumor progression.
Third, this is the first algorithm that we know of that uses SNP array data to correct for aneuploidy. As seen in Figures 3 and 5, the lack of correction produces erroneous results: diploid chromosomes are scored as one copy, and triploid chromosomes are scored as two copies. Methods optimized to detect rare variants in otherwise normal constitutional DNA samples therefore do not perform well against aneuploid tumor samples (Table 1; Macconaill et al. 2007; Wang et al. 2007). Correcting for aneuploidy yields an accurate accounting of absolute chromosome CN as opposed to CN relative to the DNA index. A region present in three copies in a tetraploid sample will be scored as three copies. It remains to be determined experimentally whether or not such a region is functionally equivalent to a single copy loss in a diploid genome. However, without correcting for aneuploidy, even large aberrations can be missed: the threshold set to detect a 50% intensity increase in a diploid sample (three copies vs. two copies) can fail to detect a gain in a triploid sample where the intensity increase is only 33% (four copies vs. three copies).
Finally, we characterize higher-order gains with the number of minor alleles (NOMA) present. This distinguishes regions gained because of the preferential duplication of one allele from regions gained because of mitotic disjunction events. Determining the mechanism of CN gain may facilitate discovery of oncogenes by identifying samples with preferential amplification of a presumably mutated allele (LaFramboise et al. 2005; Nannya et al. 2005).
The signal-to-noise ratio is a function of the SNP window size selected. For high-quality samples with straightforward aberrations, a small window size of 11 to 21 SNPs provides optimal resolution with minimal noise. For more complex cancer genomes, the number of false-positive aberrations at smaller window sizes quickly becomes unacceptable, and larger window sizes of 81 to 101 SNPs generate more useful data.
Correcting for aneuploidy and determining the absolute CN allows a DNA index to be estimated from array data. When both flow cytometry and the SNP array detect aneuploidy, the DNA index values are very similar over a wide range. The discordant data are likely due to limitations in both methodologies. Since diploidy is the state associated with an adverse outcome in neuroblastoma, the clinical flow cytometry assay is biased toward reporting the DNA index as 1.0 if it was detected on any of the replicates. Conversely, the LRR normalization error that occurs in aneuploid samples cannot be corrected by using SNP array data in certain cases, such as if every chromosome in the sample is present in equal copies.
The quantitative genotyping derived from SNP arrays can be leveraged to generate a whole-genome assessment of CN. Although this algorithm was designed to account for the complexities of analyzing tumor genomes, it applies equally well to discovering CNVs in constitutional DNA samples. Our algorithm should lead to a more precise definition of aberration in the cancer genome, which is essential for translational efforts focused on molecular target discovery. Furthermore, a precise estimate of genomic CN is also the starting point for integration with other whole-genome expression and epigenetic data sets.
Acknowledgments
We thank Luanne Wainwright, Tracy Casalunovo, and Edward Frackelton for their technical assistance. This work is supported in part by National Institutes of Health Grant K08CA123100 (E.F.A.), a Career Development Award from the American Society of Clinical Oncology (E.F.A.), R01-CA87847 (J.M.M.), U10-CA98543 (Children's Oncology Group), the Alex's Lemonade Stand Foundation (J.M.M.), the Abramson Family Cancer Research Institute (J.M.M.), and the Center for Applied Genomics at Children's Hospital (H.H. and genotyping).
Footnotes
[The OverUnder algorithm is freely available at http://stokes.chop.edu/CancerCN.]
Article published online before print. Article and publication date are at http://www.genome.org/cgi/doi/10.1101/gr.075671.107.
References
- Albertson D.G., Pinkel D. Genomic microarrays in human genetic disease and cancer. Hum. Mol. Genet. 2003;12:R145–R152. doi: 10.1093/hmg/ddg261. [DOI] [PubMed] [Google Scholar]
- Attiyeh E.F., London W.B., Mosse Y.P., Wang Q., Winter C., Khazi D., McGrady P.W., Seeger R.C., Look A.T., Shimada H., et al. Chromosome 1p and 11q deletions and outcome in neuroblastoma. N. Engl. J. Med. 2005;353:2243–2253. doi: 10.1056/NEJMoa052399. [DOI] [PubMed] [Google Scholar]
- Bignell G.R., Huang J., Greshock J., Watt S., Butler A., West S., Grigorova M., Jones K.W., Wei W., Stratton M.R., et al. High-resolution analysis of DNA copy number using oligonucleotide microarrays. Genome Res. 2004;14:287–295. doi: 10.1101/gr.2012304. [DOI] [PMC free article] [PubMed] [Google Scholar]
- Fan J.B., Chee M.S., Gunderson K.L. Highly parallel genomic assays. Nat. Rev. Genet. 2006;7:632–644. doi: 10.1038/nrg1901. [DOI] [PubMed] [Google Scholar]
- George R., Attiyeh E., Li S., Neuberg D., Li C., Hii G., Fox E., Meyerson M., Look A., Maris J. Genome-wide analysis of neuroblastomas using high-density single nucleotide polymorphism (SNP) arrays. American Association for Cancer Research Annual Meeting; Anaheim, CA. 2005. [Google Scholar]
- Gunderson K.L., Steemers F.J., Lee G., Mendoza L.G., Chee M.S. A genome-wide scalable SNP genotyping assay using microarray technology. Nat. Genet. 2005;37:549–554. doi: 10.1038/ng1547. [DOI] [PubMed] [Google Scholar]
- Hakonarson H., Grant S.F., Bradfield J.P., Marchand L., Kim C.E., Glessner J.T., Grabs R., Casalunovo T., Taback S.P., Frackelton E.C., et al. A genome-wide association study identifies KIAA0350 as a type 1 diabetes gene. Nature. 2007;448:591–594. doi: 10.1038/nature06010. [DOI] [PubMed] [Google Scholar]
- Ishikawa S., Komura D., Tsuji S., Nishimura K., Yamamoto S., Panda B., Huang J., Fukayama M., Jones K.W., Aburatani H. Allelic dosage analysis with genotyping microarrays. Biochem. Biophys. Res. Commun. 2005;333:1309–1314. doi: 10.1016/j.bbrc.2005.06.040. [DOI] [PubMed] [Google Scholar]
- Kennedy G.C., Matsuzaki H., Dong S., Liu W.M., Huang J., Liu G., Su X., Cao M., Chen W., Zhang J., et al. Large-scale genotyping of complex DNA. Nat. Biotechnol. 2003;21:1233–1237. doi: 10.1038/nbt869. [DOI] [PubMed] [Google Scholar]
- LaFramboise T., Weir B.A., Zhao X., Beroukhim R., Li C., Harrington D., Sellers W.R., Meyerson M. Allele-specific amplification in cancer revealed by SNP array analysis. PLoS Comput. Biol. 2005;1:e65. doi: 10.1371/journal.pcbi.0010065. [DOI] [PMC free article] [PubMed] [Google Scholar]
- Lamy P., Andersen C.L., Dyrskjot L., Torring N., Wiuf C. A Hidden Markov Model to estimate population mixture and allelic copy-numbers in cancers using Affymetrix SNP arrays. BMC Bioinformatics. 2007;8:434. doi: 10.1186/1471-2105-8-434. [DOI] [PMC free article] [PubMed] [Google Scholar]
- Look A.T., Hayes F.A., Shuster J.J., Douglass E.C., Castleberry R.P., Bowman L.C., Smith E.I., Brodeur G.M. Clinical relevance of tumor cell ploidy and N-Myc gene amplification in childhood neuroblastoma: A pediatric oncology group study. J. Clin. Oncol. 1991;9:581–591. doi: 10.1200/JCO.1991.9.4.581. [DOI] [PubMed] [Google Scholar]
- Macconaill L.E., Aldred M.A., Lu X., Laframboise T. Toward accurate high-throughput SNP genotyping in the presence of inherited copy number variation. BMC Genomics. 2007;8:211. doi: 10.1186/1471-2164-8-211. [DOI] [PMC free article] [PubMed] [Google Scholar]
- Maris J.M., Mosse Y.P., Bradfield J.P., Hou C., Monni S., Scott R.H., Asgharzadeh S., Attiyeh E.F., Diskin S.J., Laudenslager M., et al. Chromosome 6p22 locus associated with clinically aggressive neuroblastoma. N. Engl. J. Med. 2008;358:2585–2593. doi: 10.1056/NEJMoa0708698. [DOI] [PMC free article] [PubMed] [Google Scholar]
- Mathew P., Valentine M.B., Bowman L.C., Rowe S.T., Nash M.B., Valentine V.A., Cohn S.L., Castleberry R.P., Brodeur G.M., Look A.T. Detection of MYCN gene amplification in neuroblastoma by fluorescence in situ hybridization: A pediatric oncology group study. Neoplasia. 2001;3:105–109. doi: 10.1038/sj.neo.7900146. [DOI] [PMC free article] [PubMed] [Google Scholar]
- Mosse Y.P., Laudenslager M., Longo L., Cole K.A., Wood A., Attiyeh E.F., LaQuaglia M.J., Lynch J.E., Perri P., Hakonarson H., et al. Identification of ALK as a major familial neuroblastoma predisposition gene. Nature. 2008;455:930–935. doi: 10.1038/nature07261. [DOI] [PMC free article] [PubMed] [Google Scholar]
- Nannya Y., Sanada M., Nakazaki K., Hosoya N., Wang L., Hangaishi A., Kurokawa M., Chiba S., Bailey D.K., Kennedy G.C., et al. A robust algorithm for copy number detection using high-density oligonucleotide single nucleotide polymorphism genotyping arrays. Cancer Res. 2005;65:6071–6079. doi: 10.1158/0008-5472.CAN-05-0465. [DOI] [PubMed] [Google Scholar]
- Olshen A.B., Venkatraman E.S., Lucito R., Wigler M. Circular binary segmentation for the analysis of array-based DNA copy number data. Biostatistics. 2004;5:557–572. doi: 10.1093/biostatistics/kxh008. [DOI] [PubMed] [Google Scholar]
- Peiffer D.A., Le J.M., Steemers F.J., Chang W., Jenniges T., Garcia F., Haden K., Li J., Shaw C.A., Belmont J., et al. High-resolution genomic profiling of chromosomal aberrations using Infinium whole-genome genotyping. Genome Res. 2006;16:1136–1148. doi: 10.1101/gr.5402306. [DOI] [PMC free article] [PubMed] [Google Scholar]
- Pui C.H., Relling M.V., Downing J.R. Acute lymphoblastic leukemia. N. Engl. J. Med. 2004;350:1535–1548. doi: 10.1056/NEJMra023001. [DOI] [PubMed] [Google Scholar]
- Seeger R.C., Brodeur G.M., Sather H., Dalton A., Siegel S.E., Wong K.Y., Hammond D. Association of multiple copies of the N-myc oncogene with rapid progression of neuroblastomas. N. Engl. J. Med. 1985;313:1111–1116. doi: 10.1056/NEJM198510313131802. [DOI] [PubMed] [Google Scholar]
- Seeger R.C., Wada R., Brodeur G.M., Moss T.J., Bjork R.L., Sousa L., Slamon D.J. Expression of N-myc by neuroblastomas with one or multiple copies of the oncogene. Prog. Clin. Biol. Res. 1988;271:41–49. [PubMed] [Google Scholar]
- Shimada H., Chatten J., Newton W.A., Jr, Sachs N., Hamoudi A.B., Chiba T., Marsden H.B., Misugi K. Histopathologic prognostic factors in neuroblastic tumors: Definition of subtypes of ganglioneuroblastoma and an age-linked classification of neuroblastomas. J. Natl. Cancer Inst. 1984;73:405–413. doi: 10.1093/jnci/73.2.405. [DOI] [PubMed] [Google Scholar]
- Steemers F.J., Chang W., Lee G., Barker D.L., Shen R., Gunderson K.L. Whole-genome genotyping with the single-base extension assay. Nat. Methods. 2006;3:31–33. doi: 10.1038/nmeth842. [DOI] [PubMed] [Google Scholar]
- Venkatraman E.S., Olshen A.B. A faster circular binary segmentation algorithm for the analysis of array CGH data. Bioinformatics. 2007;23:657–663. doi: 10.1093/bioinformatics/btl646. [DOI] [PubMed] [Google Scholar]
- Wang K., Li M., Hadley D., Liu R., Glessner J., Grant S.F., Hakonarson H., Bucan M. PennCNV: An integrated hidden Markov model designed for high-resolution copy number variation detection in whole-genome SNP genotyping data. Genome Res. 2007;17:1665–1674. doi: 10.1101/gr.6861907. [DOI] [PMC free article] [PubMed] [Google Scholar]
- Zhao X., Li C., Paez J.G., Chin K., Janne P.A., Chen T.H., Girard L., Minna J., Christiani D., Leo C., et al. An integrated view of copy number and allelic alterations in the cancer genome using single nucleotide polymorphism arrays. Cancer Res. 2004;64:3060–3071. doi: 10.1158/0008-5472.can-03-3308. [DOI] [PubMed] [Google Scholar]


