Abstract
We have developed a comprehensive gene orientated phylogenetic resource, EnsemblCompara GeneTrees, based on a computational pipeline to handle clustering, multiple alignment, and tree generation, including the handling of large gene families. We developed two novel non-sequence-based metrics of gene tree correctness and benchmarked a number of tree methods. The TreeBeST method from TreeFam shows the best performance in our hands. We also compared this phylogenetic approach to clustering approaches for ortholog prediction, showing a large increase in coverage using the phylogenetic approach. All data are made available in a number of formats and will be kept up to date with the Ensembl project.
The use of phylogenetic trees to describe the evolution of biological processes was established in the 1950s (Hennig 1952) and remains a fundamental approach to understanding the evolution of individual genes through to complete genomes; for example, in the mouse (Mouse Genome Sequencing Consortium 2002), rat (Gibbs et al. 2004), chicken (International Chicken Genome Sequencing Consortium 2004), and monodelphis (Mikkelsen et al. 2007) genome papers, and numerous papers on individual sequences. Now routine, the determination of vertebrate genome sequences provides a rich data source to understand evolution, and using phylogenetic trees of the genes is one of the best ways to organize these data. However, the increased set of genomes makes the compute and engineering tasks to form all the gene trees progressively more complex and harder for individual groups to use. The Ensembl project provides an accurate and consistent protein-coding gene set for all vertebrate genomes (International Human Genome Sequencing Consortium 2001; Dehal et al. 2002; Mouse Genome Sequencing Consortium 2002; Gibbs et al. 2004; Xie et al. 2005; Mikkelsen et al. 2007; Rhesus Macaque Genome Sequencing and Analysis Consortium 2007). Previously (until April 2006), Ensembl provided a basic method for tracing orthologs via the Best Reciprocal BLAST method, similar to approaches used in other genome analyses, such as Drosophila melanogaster (Adams et al. 2000) or human (International Human Genome Sequencing Consortium 2001). In June 2006 (Hubbard et al. 2007), we replaced this system with a phylogenetically sound, gene tree-based approach, providing a complete set of phylogenetic trees spanning 91% of genes across vertebrates. In addition to the vertebrates we have included a few important non-vertebrate species (fly, worm, and yeast) to act both as out groups and provide links to these model organisms. In this paper we provide the motivation, implementation, and benchmarking of this method and document the display and access methods for these trees.
There have been a number of methods proposed for routine generation of genomewide orthology descriptions, including Inparanoid (Remm et al. 2001), MSOAR (Fu et al. 2007), OrthoMCL (Li et al. 2003), HomoloGene (Wheeler et al. 2008), TreeFam (Li et al. 2006), PhyOP (Goodstadt and Ponting 2006), and PhiGs (Dehal and Boore 2006). The first four, Inparanoid, MSOAR, OrthoMCL, and HomoloGene, focus on providing clusters (or linked clusters) of genes, without an explicit tree topology. PhyOP (Goodstadt and Ponting 2006) uses a tree-based method, but between pairs of closely related species, resolving paralogs accurately by using neutral substitution (as measured by d S, the synonymous substitution rate). TreeFam provides an explicit gene tree across multiple species, using both d S, d N (nonsynonymous substitution rate), nucleotide and protein distance measures, and the standard species tree to balance duplications vs. deletions to inform the tree construction, using the program TreeBeST (http://treesoft.sourceforge.net/treebest.shtml; L. Heng, A.J. Vilella, E. Birney, and R. Durbin, in prep.).
The PhiGs method (Dehal and Boore 2006) is a leading phylogenetic-based method that produced a comprehensive phylogenetic resource for the genomes at the time it was run, and the basic outline of its analysis, which was clustering of protein sequences, followed by phylogenetic trees, is similar to the method presented here. However, the PhiGs resource covered a smaller number of species (23 vs. 45) and has been difficult to keep up to date with the advances in gene sets and genomes. Another major difference between PhiG-based phylogenetic trees and the phylogenetic trees presented here is that the former was calculated using a single maximum likelihood method based on protein evolution. In contrast, the Ensembl gene trees are calculated using a new method, TreeBeST, which integrates multiple tree topologies, in particular both DNA level and protein level models and combines this with a species-tree aware penalization of topologies, which are inconsistent with known species relationships. We show in this paper that this method produces trees that are more consistent with synteny relationships and less anomalous topologies than single protein-based phylogenetic methods.
There are also many single phylogenetic tree-building approaches, many of them based on maximum likelihood methods; one leading method is PhyML (Guindon and Gascuel 2003). It is unclear what is the best method to use, in particular in the context of genome-wide tree building with constraints on computational costs and the need to robustly handle many complex scenarios usually involving large families with heterogeneous phylogenetic depths. In this paper, we benchmark in vertebrates the tree programs TreeBeST and PhyML, and the resulting trees to basic best reciprocal hit (BRH) methods, and cluster frameworks, in particular Inparanoid and HomoloGene. We also benchmark to a recent PhyOP data set. The PhyOP pipeline has recently switched to use the same tree-building program (TreeBeST) that we use, but differs in its input clusters. Although we adopted this same tree-building method, we describe here considerable novel engineering in the deployment of these methods across all vertebrates. Similar to the PhiGs resource, we have used the dense coverage of genomes to provide topologically based timings (i.e., the standard use of outgroups vs. subsequent lineages to bracket a duplication), in order to label duplication events.
Results
A robust, computationally efficient pipeline for gene tree generation
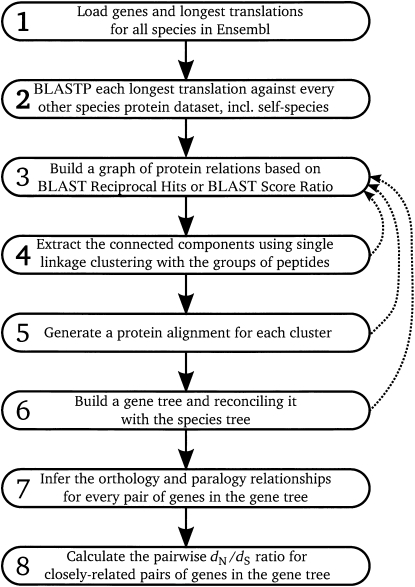
We have built a fault-tolerant pipeline to run our orthology and paralogy gene prediction analysis using TreeFam methodology. The fault-tolerance works at two levels: first, we use a robust compute scheduling engine (in our case, LSF, though other packages could substitute for this component) to schedule jobs, but even with the use of LSF's scheduling and job recovery, there can be periodic network or disk failures, which result in apparent successful LSF completion without data being successfully stored. Our experience is that a second level of data tracking is required, in particular due to the complex interdependence on compute results in the pipeline, which is hard to express as single static LSF-based set of dependencies. Finally the pipeline allows aggregation of multiple highly similar compute tasks (in our case, BLAST comparisons) into a single LSF task, which is important to allow the granularity of the LSF tracking component to be optimized. The pipeline can be divided into eight main steps that are presented in the schema in Figure 1. These eight steps are described as follows.
Figure 1.
Computational pipeline for the EnsemblCompara process.
Protein data set: For each species considered in the analysis, we only consider protein coding genes. For each gene, we only consider the longest protein translation.
BLASTP all vs. all: Each protein is queried using WUBLASTP against each individual species protein database, including its self-species protein database.
Graph construction: Connections (edges) between the nodes (proteins) are retained when they satisfy either a best reciprocal hit (BRH) or a BLAST score ratio (BSR) over 0.33.
A BSR for two proteins, P1 and P2, is defined as scoreP1P2/max(self-scoreP1 or self-scoreP2).
4. Clusters: We extract from the graph the connected components (i.e., single linkage clusters). Each connected component represents a cluster, i.e., a gene family. If the cluster has greater than 750 members, steps 3 and 4 are repeated at higher stringency (see below).
5. Multiple alignments: Proteins in the same cluster are aligned using MUSCLE (Edgar 2004) to obtain a multiple alignment.
6. Gene tree and reconciliation: The CDS backtranslated protein-based multiple alignment is used as an input to the tree program, TreeBeST, as well as the multifurcated species tree necessary for the reconciliation and the duplication calls on internal nodes.
7. Inference of orthologs and paralogs: As many users like to use ortholog look-up tables, we flatten the resulting trees into ortholog and paralog tables of pairwise relationships between genes. In the case of paralogs, this flattening also records the timing of the duplication due to the presence of extant species past the duplication, and thus implicitly outgroup lineages before the duplication (see Supplemental Fig. 1A,B for a detailed explanation).
8. Pairwise d N /d S (nonsynonymous substitutions/synonymous substitutions): We calculate the pairwise d N /d S between pairs of genes for closely related species using codeml from the PAML package (Yang 2007).
For the Ensembl v41 assessment, step 6 was divided into step 6a, using PhyML (Guindon and Gascuel 2003) to build the tree, and step 6b, using RAP (Dufayard et al. 2005) for the tree reconciliation.
At the end of step 4, if the cluster is large (currently parametrized as containing more than 750 genes), the genes in this cluster are then reinjected into step 3 (Fig. 1, dashed lines), with only the BSR threshold condition to satisfy. If more iterations are necessary, the BSR threshold is increased by 0.1 at each iteration. The same kinds of iterations are applied at the end of steps 5 and 6 when MUSCLE or the tree-building program failed to process a cluster. This iteration procedure is effectively a hierarchical breakdown of the initial clustering to get more fine-grained sets of clusters that can easily be processed. This iterative approach is critical to generate sensible trees for complex large families, such as those of zinc finger proteins or olfactory receptors. Although it would be desirable to place all genes from these gene families into a comprehensive single tree, there are numerous engineering, algorithmic, and display problems associated with large trees, and the hierarchical breakdown provides a pragmatic solution for such families.
The TreeBeST method has two new components. First, it runs a number of independent phylogenetic methods, in particular DNA, codon, and protein maximum likelihood models are created on the same data. Second, the TreeBeST method then creates a combined tree using a stochastic context free grammar approach to integrate the different tree information with a model to penalize duplications and deletions relative to a known species tree. The result is that TreeBeST will tend to use DNA- or codon-based methods in the parts of the phylogeny that do not have saturated DNA mutation rates (e.g., intramammalian comparisons), but utilizes protein information at longer distances (e.g., comparisons between mammals and fish). We developed two metrics to assess the different methods.
Duplication consistency score
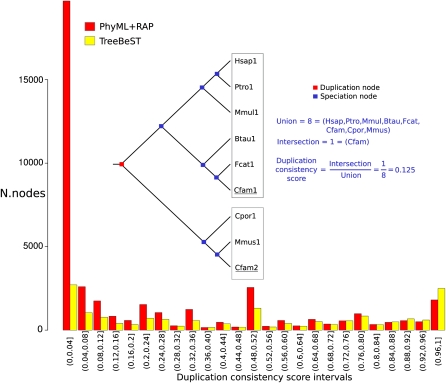
We developed a consistency score for proposed duplications, where we measure the intersection of the number of species postduplication over the union; one expects that most duplications should have the gene persisting at least in an equally likely manner in subsequent lineages. In contrast, incorrect topologies will often have simply reordered a deep node leading to usually a few species in the topologically incorrect positions; reconciliation to the species tree then forces the prediction of duplication followed by extensive loss in a precisely correlated manner across the two daughter lineages. The duplication consistency score captures this unbalanced nature of poor topologies as the intersection in subsequent lineages is low. Figure 2 shows clearly that the PhyML/RAP approach made many more duplication nodes compared to TreeBeST, and the vast majority of the additional duplications from PhyML/RAP have a low duplication consistency score. This result is unsurprising, as TreeBeST takes the species tree as input and explicitly penalizes both duplication and deletion of genes; in other words, the TreeBeST program tends to produce duplication nodes when the gene tree has extensive extant members on each side of the duplication. Although this metric fundamentally reflects the difference in methodology between PhyML, a pure sequence-based tree, and TreeBeST, which uses the species tree as input, it is clear that the TreeBeST results are more biologically consistent, given the assumption that gene duplication and deletion rates are rare.
Figure 2.
A diagram of the duplication consistency score on an example tree showing unlikely coordinated deletions on the subsequent lineages. The histogram shows the distribution of consistency scores for both PhyML/RAP and TreeBeST methods. PhyML/RAP has both a higher absolute number of duplications and far more at low consistency values.
Gene synteny metric
We also developed an alternative metric that was not confounded by the tree methodology using the fact that gene order and orientation (informally called synteny) are conserved across species. None of the tree approaches used synteny information in the tree construction, though the old best reciprocal hit method extended its range using synteny information. Supplemental Figure 2 shows the difference in results between a strict BRH approach with no syntenic information used, PhyML/RAP and TreeBeST. In both cases, for perfect and good syntenic genes, the TreeBeST pipeline shows better results. PhyML/RAP gave poorer results than BRH. We believe this was mainly due to a large number of wrong gene tree topologies and hence difficult tree reconciliations that overestimated duplication events. Such overestimation led to missed orthology predictions.
Comparison to bootstrap metrics
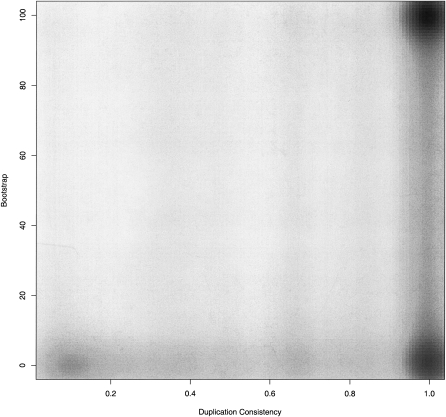
We compared the duplication consistency measure to the boostrap support of the duplication nodes from TreeBeST. As expected, there is a strong correlation between the bootstrap support and the duplication consistency measure, with most of the high duplication consistency measure scores also having high bootstrap support (Fig. 3), and low duplication consistency measures having a variety of bootstrap scores, but nearly always below the 80% support level. Interestingly, there was a set of low bootstrap but high duplication-consistent set of duplication nodes (Figure 3, bottom right), but not the inverse set of high bootstrap low duplication-consistent nodes. These duplication nodes were not obviously correlated with either internal aspects of the multiple alignment or tree (e.g., length or average distance from the duplication node to extant species) or external properties of the genes (e.g., Gene Ontology [GO] term distribution, Pfam domain sets or the position of the duplication node with respect to the vertebrate tree). This set of genes might reflect the fact that the bootstrap statistic is about the consistency of the tree across the columns of the multiple alignment, and this consistency measure does not necessarily have to apply to every gene equally. In contrast, the duplication consistency measure, which is a property of the behavior of genes post-duplication, may be more consistent across different genes.
Figure 3.
A scatter plot of the duplication consistency score (x-axis) compared to the bootstrap value of duplication nodes (y-axis). Because of the large number of values, the density of points is shown using the smoothScatter kernel-based density function in R.
The conclusion of this investigation is that TreeBeST was the best of these extensively tested methods on the criteria of duplication consistency and synteny consistency criteria. It is hard to have entirely objective measures of the accuracy of trees (see Discussion below). We also briefly investigated further tree programs and further multiple alignment programs (e.g., ClustalW), but many of these were not robust enough to work in a large-scale compute environment with the complex gene families present across vertebrates. In the future these metrics will permit the testing of both other tree construction programs and other multiple alignment programs, and we will continue to test and assess new robustly engineered programs with a good chance of improving the trees.
External benchmarking to other orthology sets
Overlap of ortholog sets
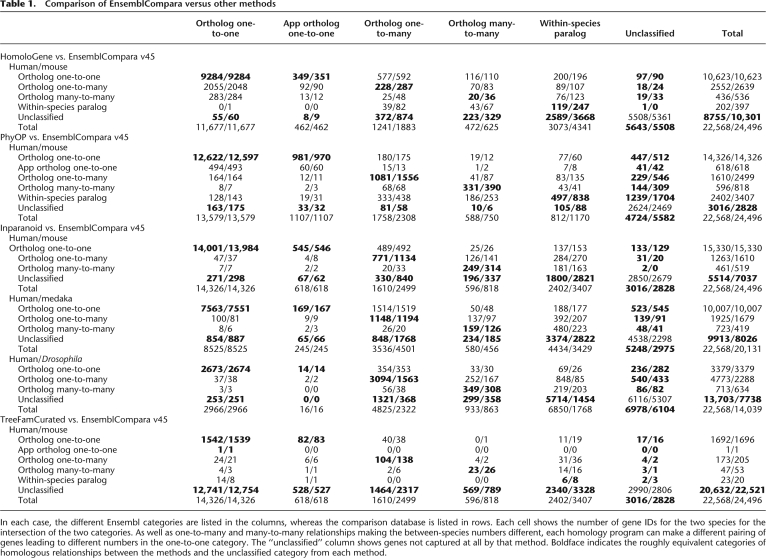
Table 1 shows the overlap of ortholog sets between EnsemblCompara GeneTrees v45 to Inparanoid, HomoloGene, PhyOP or TreeFamCurated for certain pairs of species. In all our comparisons we have taken genes as reference, and have counted for each gene its best homology prediction. The ranking from best to worst favored one-to-one orthologs over one-to-many orthologs, and both were favored over paralogs. When a gene was not involved in any homology relation, it has been labeled as unclassified.
Table 1.
Comparison of EnsemblCompara versus other methods
In each case, the different Ensembl categories are listed in the columns, whereas the comparison database is listed in rows. Each cell shows the number of gene IDs for the two species for the intersection of the two categories. As well as one-to-many and many-to-many relationships making the between-species numbers different, each homology program can make a different pairing of genes leading to different numbers in the one-to-one category. The “unclassified” column shows genes not captured at all by that method. Boldface indicates the roughly equivalent categories of homologous relationships between the methods and the unclassified category from each method.
In all the data shown in the tables, EnsemblCompara always shows better or similar coverage to any other method. This is clearly visible in HomoloGene, where one-third more human genes and twofold more mouse genes are lost in HomoloGene as compared with EnsemblCompara GeneTrees v45. Part of this large difference is the absence of RefSeq (Pruitt et al. 2007) entries for particular human genes, i.e., a problem with gene prediction sets or coordination between Ensembl and RefSeq IDs in the genomes rather than the inability to create an orthology relationship. As HomoloGene is a database, and not a method that can be applied to a new data set, one cannot perform a perfectly matched set. We then restricted the 22,568 human protein coding genes and 24,496 mouse protein coding genes present in the Ensembl database to the common RefSeq set used as an input to HomoloGene to compare the homology types as fairly as possible between the two data sets. For this set there were 838 HomoloGene associations that could have been made in EnsemblCompara, compared to 1519 EnsemblCompara cases between genes with RefSeq IDs, but no HomoloGene association. Manual inspection of these cases show some complex tree topologies, but also clear cases of one-to-one orthology that had been missed in HomoloGene (e.g., the MAGIX gene), whereas the majority of the missing EnsemblCompara cases came from complex scenarios with unclear correct tree topologies, such as Ig locus genes.
When comparing our results with Inparanoid (Remm et al. 2001) we used a matched protein set (Ensembl v45) for both methods. We observed that although they return very similar results, EnsemblCompara has increased coverage with marginally increased specificity (see below for specificity measure). The gain in gene coverage in favor of EnsemblCompara v45 becomes clearer when looking at more distant species, such as human/medaka or human/Drosophila.
The PhyOP pipeline has recently moved to using the same tree-building program (TreeBeST) as TreeFam and EnsemblCompara. This means that any difference is due to the input clusters. The PhyOP pipeline shows marginally less unclassified genes than the EnsemblCompara pipeline, i.e., having orthologous genes predicted that were not present in EnsemblCompara. Examination of these cases showed many genes involved in large families. Currently, EnsemblCompara handles 35 species compared to the more restricted set of six species in the PhyOP run, and it seems that in breaking down the large families into appropriate clusters, some genes in these large families can become orphaned. This is clearly an area that can be improved in the future.
The TreeFamCurated entry corresponds to the comparison of our data set against the curated set of TreeFam, with 1247 such cases only. The curated trees in TreeFam incorporate expert knowledge to change the topology of trees, for example, by using information on the conservation of function. In Table 1 we show that the concordance between our automated prediction set and the manually curated TreeFam data set is very high. The only exception seems to be that our method tends to miss orthology relationships in favor of within-species paralogs. We believe this is mainly due to wrong tree topologies involving mispredicted (merged/split/partial) genes for which automatic tree building has difficulties to place the genes correctly. The manual curation in TreeFam then corrects this problem and results in a better tree topology. In the long term, the incorporation of more manual curation into the human and mouse gene sets, coupled with more improvements in the gene prediction methodology in Ensembl should progressively remove these errors.
Comparison using the synteny metric
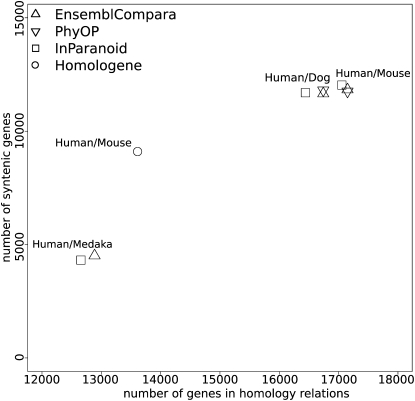
We were interested in looking at the differences in the synteny metric, as defined above, between the different methods as indicative of their specificity. The plot in Figure 4 shows the number of human genes involved in homology relations as a function of the number of human syntenic genes. EnsemblCompara and PhyOP always perform better in terms of the number of covered human genes, but there is a remarkably similar level of syntenous predictions between all the different methods, with, in some cases, Inparanoid showing a marginally higher rate of syntenous predictions. In the case of a distant vertebrate species such as medaka, EnsemblCompara is best on both coverage and specificity measures. The teleost genomes represent a particular challenge for the clustering mechanism due to the ancient duplication at the root of the teleost linage, leading to proportionally more “ancient” paralog relationships, which are hard to capture using the clustering methods.
Figure 4.
A plot showing different methods in terms of coverage in human genes (x-axis) vs. number of genes in syntenic relationships (y-axis).
Display and access of orthologs
We provide different ways to access and visualize the orthology/paralogy data and have used it in a number of ways in house.
Web display
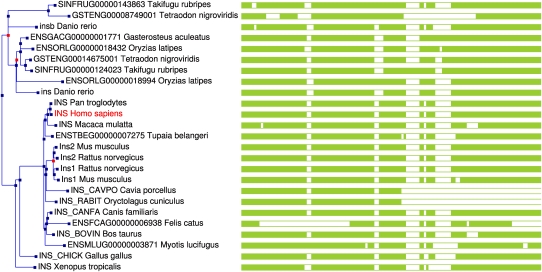
The main entry points are GeneView (http://jun2007.archive.ensembl.org/Homo_sapiens/geneview?gene=ENSG00000129965) and GeneTreeView (http://jun2007.archive.ensembl.org/Homo_sapiens/genetreeview?db=core;gene=ENSG00000129965; Fig. 5).
Figure 5.
A screen shot of the gene tree page at Ensembl for the INS (insulin peptide) gene. This shows two independent duplications in rodents (giving rise to Ins1 and Ins2 genes) and teleost fish. Duplication nodes are shown as red squares whereas speciation nodes are in blue. The green bars to the right provide a graphical view of the multiple alignment, showing partial gene structures in hamster (Cavia p.), cat (Felis c.), and rabbit (Oryctolagus c.), due to their low coverage status.
In GeneView, we list the orthologous and within-species paralogous gene predictions. In each case, the user has access to MultiContigView, a display that shows the ortholog or paralog relation in the genomic context of both species. The user can also see the alignment between the two ortholog/paralog protein sequences via AlignView.
GeneTreeView (Fig. 5) displays the gene tree and shows the considered gene highlighted in red in context of all its homologous relations. Duplication nodes are colored red, whereas speciation nodes are colored blue. The user can dump multiple alignment of this gene tree with the “Export” menu, as well as a picture of the tree in different formats (PDF, PS, and SVG). Future development will include zoom in/out at specific internal nodes to display subtrees. We will also include the ability to dump the gene list of the whole tree and a subtree, as well as the multiple alignments of the protein/CDS in a subtree.
Projection of GO terms via orthology links
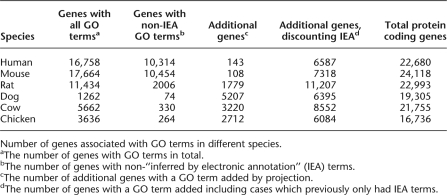
One of the benefits of extensive and accurate prediction of orthologs is that one can infer that they have (usually) retained the same function in extant species. Using this methodology we have automatically projected GO terms from the main two mammalian sources, human and mouse, out across other vertebrate species. When we project GO terms, we tag the evidence as “inferred from electronic annotation” (IEA), consistent with other GO annotations, to prevent confusion with directly assigned GO terms, and we only project from experimentally referenced GO evidence in the source organism. After discussion with the GO community we have only projected via one-to-one ortholog links, though it is worth considering in the future a more flexible approach of projection through duplications for some terms (e.g., molecular function terms may rarely be changed by recent duplication structure, while biological process terms may change more frequently). Table 2 shows the set of species for which we have projected GO terms and the comparison with existing sets. Even in the well annotated human and mouse genomes, this projection provides a small increase in the overall number of genes and a marked increase when not considering genes already IEA annotated. Currently the bulk of IEA assignments come via domain matching (e.g., Interpro2Go), and thus have to use quite broad specificity terms, whereas our ortholog annotation can provide far more detailed GO terms. Of course in less intensively studied genomes this creates a large set (e.g., ∼5000 previously annotated genes for dog) of GO mappings.
Table 2.
GO term projection
Number of genes associated with GO terms in different species.
aThe number of genes with GO terms in total.
bThe number of genes with non-“inferred by electronic annotation” (IEA) terms.
cThe number of additional genes with a GO term added by projection.
dThe number of genes with a GO term added including cases which previously only had IEA terms.
Data mining using BioMart
BioMart is a flexible data mining application that can be addressed using a user-friendly web page, programmatic access, web service access, and the BioMart package in the R statistical environment. biomaRt enables the user to do bulk dumps of ortholog or paralog gene pair lists given a species pair and to restrict this by any valid BioMart query. It can also dump the peptide/cDNA sequence of the gene in question.
Raw dump accessible via ftp
We also provide dumps of the gene tree multiple alignments and the trees themselves in “emf” format, described in more detail at ftp://ftp.ensembl.org/pub/current_multi_species/data/emf/protein_trees/README. The tree is written down in newick format, embedded in the emf format itself, such that there is only one file representing the entire data set. We are developing format readers in the BioPerl libraries to ensure easy integration of this flat file data into other pipelines in a standalone manner.
Programmatic access using the Perl API
The data stored in an EnsemblCompara database are finally also accessible in a programmatic way using a Perl API. More detailed documents and tutorials on how to install and use the API can be found at http://www.ensembl.org/info/software/index.html. Supplemental text shows three examples of Perl scripts using the API.
Discussion
The orthology pipeline presented here is robust and provides a framework in which we can assess different components in tree generation. We have used three key metrics: coverage in homology relationships, duplication consistency score, and consistency with genome synteny, to assess both different internal components of our pipeline and to other orthology sets. In our assessments the MUSCLE+TreeBeST system, which is the set of methods used in TreeFam, performs best according to these metrics. One problem in phylogenetic method development is that it is hard to have access to objectively correct trees to assess methods. Simulation-based assessment can explore the potential source of errors, and TreeBeST performs well, and critically better than sequence-only methods, with simulated data (L. Heng, A.J. Vilella, E. Birney, and R. Durbin, in prep.). Of the three metrics used in this paper, the first two (coverage and duplication consistency) are somewhat arbitrary choices, which nevertheless correspond to observations about “poor” trees from biological experts who use other information (such as conservation of function) to infer orthology. Such observations are necessarily anecdotal, but having methods that produce trees with higher coverage and less duplication followed by mirroring loss in the daughter lineages is more consistent with biological expertise. This is shown by the comparison to the curated TreeFam trees, which attempt to capture systematically this expert knowledge for a subset of trees. The third metric, the conservation of synteny for orthologous genes in mammals, is more principled. However, new methods integrating this information into phylogenetic methods, such as the MSOAR (Fu et al. 2007) method, and (Jiang et al. 2007), could provide more accurate trees at the expense of not being able to use synteny to assess accuracy.
In comparison to other genome-wide frameworks, mainly cluster based, these methods performed better in terms of coverage with at least as good specificity, as measured by the synteny metric. In particular, much improvement is seen in the teleost lineage, where the complex ancient duplication structure, which has been differentially lost in extant species, leads to more complex phylogenies. In addition, this phylogenetic method provides a far richer data set including the topological timings of duplications and the ability to implement other tree-dependent methods, such as global d N/d S methods. Obviously, one can expect improvements in both alignments and tree methods in the future, and this framework is flexible enough both to assess and replace the components we are using currently.
The phylogenetic information presented here is now a standard part of the Ensembl system, and will be present in all future releases, as well as available through the Ensembl archives. This provides an individual gene-specific biologist both the opportunity to explore the evolution of a gene family, discovering potentially unappreciated ancestral duplications, or draws his or her attention to other lineages where a gene has been duplicated. As the presence of recent lineage-specific duplications is often associated with positive selection, this could lead a biologist to look into the specific biology of a previously unappreciated species to understand the functional role of a gene. More mundanely, the presence of these accurate orthology links allows other groups in Ensembl to provide appropriate projection of information across the vertebrate lineages, using the concentration of information on human and mouse to inform all of the species in the vertebrate tree. This is a great boon when coupled with the GO annotation dictionary, and also allows us to project the HGNC symbols across species confidently to provide a useful visual tag for genes in different species. Ensembl also includes the MCL (Enright et al. 2002) generated Ensembl families resource. This is a clustering-based method designed to work at a far deeper phylogenetic distance (incorporating events in protein families that occurred during early eukaryotic evolution) than the ortholog prediction framework presented here. There are both conceptual problems due to large scale domain changes over this depth of evolution, which in some cases involve genuine gene split and merge events, and engineering problems due to the considerable increase in family membership when working at this scale. We are currently investigating ways both to deepen our gene family clusters and to reconcile these deeper families to broader protein family representation, such as TRIBE-MCL, but currently both methods show complementary aspects of protein evolution.
Methods
Gene synteny metric
In order to assess the quality of our orthology predictions, we developed a synteny metric that provides a measure of gene order conservation. The main idea is that when a predicted ortholog between two species is flanked (by distance criteria) by orthologous pairs on each side of each genome in an ordered manner, the central orthologous link is considered to be consistent with synteny. This measure can be applied to both one-to-one orthologs and to one-to-many orthologs, where a recent tandem duplication in one species has duplicated a gene as the criteria for flanking orthologous genes is based on distance, not gene order. Considering two species (e.g., human and mouse) and one species as reference (e.g., human), we called a perfect syntenic gene (on the reference species) a gene that has an orthology relation for which both upstream and downstream orthologies exist at 250 kb and are colinear in both species. We called a good syntenic gene (on the reference species) a gene that has an orthology relation for which one orthology exists at 250 kb, either an upstream or downstream, that is colinear in both species. It is important to note that we are using this metric to assess the quality of resulting trees, and not directly as part of our tree-building procedure.
Duplication consistency score
In order to assess the reliability of the duplication calls on internal nodes of our tree, we developed a simple measure of the consistency of lineages after a putative duplication node. This measure is based on the assumption that duplication followed by reciprocal complementary gene losses on the left and right branches of a duplication node is an unlikely scenario (see main text): Duplication score = intersection of species between left and right branches/union of species between left and right branches.
Pipeline framework
We created a fault-tolerant pipeline using Object-Oriented Perl and a MySQL database. The EnsemblCompara schema API sits on top of the main Ensembl schema and API, and links to BioPerl (Stajich et al. 2002) objects for the main data types. The EnsemblCompara GeneTrees are updated every 2 mo, which involves being built from scratch for every Ensembl release over a two-week period using a cluster of computers, generating about 50 GB of data.
Data sets used for assessing our pipeline
In order to compare the various pipeline implementations, we have performed all analyses on an identical data set from Ensembl v41 (October 2006). Assessment comprised implementations of (1) BRH alone and the tree-based programs, (2) PhyML followed by tree reconciliation with RAP, and (3) TreeBeST.
We also compared our Ensembl release 45 (June 2007), using the TreeBeST approach data set against other method of predictions or databases such as HomoloGene, Inparanoid, PhyOP, and TreeFam.
The species tree for RAP is an adapted tree from the ENCODE Multiple Sequence Analysis paper and can be found in the Supplemental materials (Margulies et al. 2007). The species tree provided to TreeBeST only requires topological constraints, so we have used an adapted topology from the NCBI taxonomic tree, which can be found in the supplementary information.
Acknowledgments
We thank Chris Ponting, Leo Goodstadt, and Andreas Heger for providing the recent PhyOP run and many useful discussions. We also thank the rest of the TreeFam and the Ensembl teams for many insightful discussions. We thank Michael Hoffman for his assistance in using R. We also thank the Sanger Institute computer services for the reliable running of the compute farm. A.V., A.U.-V., and J.S. were supported by the Wellcome Trust; E.B. was supported by EMBL; R.D. and L.H. were supported by the Wellcome Trust via the Sanger Institute.
Footnotes
[Supplemental material is available online at www.genome.org.]
Article published online before print. Article and publication date are at http://www.genome.org/cgi/doi/10.1101/gr.073585.107.
References
- Adams M.D., Celniker S.E., Holt R.A., Evans C.A., Gocayne J.D., Amanatides P.G., Scherer S.E., Li P.W., Hoskins R.A., Galle R.F., et al. The genome sequence of Drosophila melanogaster . Science. 2000;287:2185–2195. doi: 10.1126/science.287.5461.2185. [DOI] [PubMed] [Google Scholar]
- Dehal P.S., Boore J.L. A phylogenomic gene cluster resource: The Phylogenetically Inferred Groups (PhIGs) database. BMC Bioinformatics. 2006;7:201. doi: 10.1186/1471-2105-7-201. [DOI] [PMC free article] [PubMed] [Google Scholar]
- Dehal P., Satou Y., Campbell R.K., Chapman J., Degnan B., De Tomaso A., Davidson B., Di Gregorio A., Gelpke M., Goodstein D.M., et al. The draft genome of Ciona intestinalis: Insights into chordate and vertebrate origins. Science. 2002;298:2157–2167. doi: 10.1126/science.1080049. [DOI] [PubMed] [Google Scholar]
- Dufayard J.F., Duret L., Penel S., Gouy M., Rechenmann F., Perriere G. Tree pattern matching in phylogenetic trees: Automatic search for orthologs or paralogs in homologous gene sequence databases. Bioinformatics. 2005;21:2596–2603. doi: 10.1093/bioinformatics/bti325. [DOI] [PubMed] [Google Scholar]
- Edgar R.C. MUSCLE: A multiple sequence alignment method with reduced time and space complexity. BMC Bioinformatics. 2004;5:113. doi: 10.1186/1471-2105-5-113. [DOI] [PMC free article] [PubMed] [Google Scholar]
- Enright A.J., Van Dongen S., Ouzounis C.A. An efficient algorithm for large-scale detection of protein families. Nucleic Acids Res. 2002;30:1575–1584. doi: 10.1093/nar/30.7.1575. [DOI] [PMC free article] [PubMed] [Google Scholar]
- Fu Z., Chen X., Vacic V., Nan P., Zhong Y., Jiang T. MSOAR: A high-throughput ortholog assignment system based on genome rearrangement. J. Comput. Biol. 2007;14:1160–1175. doi: 10.1089/cmb.2007.0048. [DOI] [PubMed] [Google Scholar]
- Gibbs R.A., Weinstock G.M., Metzker M.L., Muzny D.M., Sodergren E.J., Scherer S., Scott G., Steffen D., Worley K.C., Burch P.E., et al. Genome sequence of the Brown Norway rat yields insights into mammalian evolution. Nature. 2004;428:493–521. doi: 10.1038/nature02426. [DOI] [PubMed] [Google Scholar]
- Goodstadt L., Ponting C.P. Phylogenetic reconstruction of orthology, paralogy, and conserved synteny for dog and human. PLoS Comput. Biol. 2006;2:e133. doi: 10.1371/journal.pcbi.0020133. [DOI] [PMC free article] [PubMed] [Google Scholar]
- Guindon S., Gascuel O. A simple, fast, and accurate algorithm to estimate large phylogenies by maximum likelihood. Syst. Biol. 2003;52:696–704. doi: 10.1080/10635150390235520. [DOI] [PubMed] [Google Scholar]
- Hennig W. Grundzüge der Theorie der Phylogenetischen Systematik. Deutscher Zentralverlag; Berlin: 1952. [Google Scholar]
- Hubbard T.J., Aken B.L., Beal K., Ballester B., Caccamo M., Chen Y., Clarke L., Coates G., Cunningham F., Cutts T., et al. Ensembl 2007. Nucleic Acids Res. 2007;35:D610–D617. doi: 10.1093/nar/gkl996. [DOI] [PMC free article] [PubMed] [Google Scholar]
- International Chicken Genome Sequencing Consortium. Sequence and comparative analysis of the chicken genome provide unique perspectives on vertebrate evolution. Nature. 2004;432:695–716. doi: 10.1038/nature03154. [DOI] [PubMed] [Google Scholar]
- International Human Genome Sequencing Consortium. Initial sequencing and analysis of the human genome. Nature. 2001;409:860–921. doi: 10.1038/35057062. [DOI] [PubMed] [Google Scholar]
- Jiang Z., Tang H., Ventura M., Cardone M.F., Marques-Bonet T., She X., Pevzner P.A., Eichler E.E. Ancestral reconstruction of segmental duplications reveals punctuated cores of human genome evolution. Nat. Genet. 2007;39:1361–1368. doi: 10.1038/ng.2007.9. [DOI] [PubMed] [Google Scholar]
- Li L., Stoeckert C.J., Jr, Roos D.S. OrthoMCL: Identification of ortholog groups for eukaryotic genomes. Genome Res. 2003;13:2178–2189. doi: 10.1101/gr.1224503. [DOI] [PMC free article] [PubMed] [Google Scholar]
- Li H., Coghlan A., Ruan J., Coin L.J., Heriche J.K., Osmotherly L., Li R., Liu T., Zhang Z., Bolund L., et al. TreeFam: A curated database of phylogenetic trees of animal gene families. Nucleic Acids Res. 2006;34:D572–D580. doi: 10.1093/nar/gkj118. [DOI] [PMC free article] [PubMed] [Google Scholar]
- Margulies E.H., Cooper G.M., Asimenos G., Thomas D.J., Dewey C.N., Siepel A., Birney E., Keefe D., Schwartz A.S., Hou M., et al. Analyses of deep mammalian sequence alignments and constraint predictions for 1% of the human genome. Genome Res. 2007;17:760–774. doi: 10.1101/gr.6034307. [DOI] [PMC free article] [PubMed] [Google Scholar]
- Mikkelsen T.S., Wakefield M.J., Aken B., Amemiya C.T., Chang J.L., Duke S., Garber M., Gentles A.J., Goodstadt L., Heger A., et al. Genome of the marsupial Monodelphis domestica reveals innovation in non-coding sequences. Nature. 2007;447:167–177. doi: 10.1038/nature05805. [DOI] [PubMed] [Google Scholar]
- Mouse Genome Sequencing Consortium. Initial sequencing and comparative analysis of the mouse genome. Nature. 2002;420:520–562. doi: 10.1038/nature01262. [DOI] [PubMed] [Google Scholar]
- Pruitt K.D., Tatusova T., Maglott D.R. NCBI reference sequences (RefSeq): A curated non-redundant sequence database of genomes, transcripts and proteins. Nucleic Acids Res. 2007;35:D61–D65. doi: 10.1093/nar/gkl842. [DOI] [PMC free article] [PubMed] [Google Scholar]
- Remm M., Storm C.E., Sonnhammer E.L. Automatic clustering of orthologs and in-paralogs from pairwise species comparisons. J. Mol. Biol. 2001;314:1041–1052. doi: 10.1006/jmbi.2000.5197. [DOI] [PubMed] [Google Scholar]
- Rhesus Macaque Genome Sequencing and Analysis Consortium. Evolutionary and biomedical insights from the rhesus macaque genome. Science. 2007;316:222–234. doi: 10.1126/science.1139247. [DOI] [PubMed] [Google Scholar]
- Stajich J.E., Block D., Boulez K., Brenner S.E., Chervitz S.A., Dagdigian C., Fuellen G., Gilbert J.G., Korf I., Lapp H., et al. The Bioperl toolkit: Perl modules for the life sciences. Genome Res. 2002;12:1611–1618. doi: 10.1101/gr.361602. [DOI] [PMC free article] [PubMed] [Google Scholar]
- Wheeler D.L., Barrett T., Benson D.A., Bryant S.H., Canese K., Chetvernin V., Church D.M., Dicuccio M., Edgar R., Federhen S., et al. Database resources of the National Center for Biotechnology Information. Nucleic Acids Res. 2008;36:D13–D21. doi: 10.1093/nar/gkm1000. [DOI] [PMC free article] [PubMed] [Google Scholar]
- Xie X., Lu J., Kulbokas E.J., Golub T.R., Mootha V., Lindblad-Toh K., Lander E.S., Kellis M. Systematic discovery of regulatory motifs in human promoters and 3′ UTRs by comparison of several mammals. Nature. 2005;434:338–345. doi: 10.1038/nature03441. [DOI] [PMC free article] [PubMed] [Google Scholar]
- Yang Z. PAML 4: Phylogenetic analysis by maximum likelihood. Mol. Biol. Evol. 2007;24:1586–1591. doi: 10.1093/molbev/msm088. [DOI] [PubMed] [Google Scholar]


