Abstract
CTP:phosphocholine cytidylyltransferase (CCT) is a key rate-controlling enzyme in the biosynthetic pathway leading to the principle membrane phospholipid, phosphatidylcholine. CCTα is the predominant isoform expressed in mammalian cells. To investigate the role of CCTα in the development and function of B-lymphocytes, mice with B-lymphocytes that selectively lacked CCTα were derived using the CD19-driven Cre/loxP system. When challenged with a T-cell-dependent antigen, the animals harboring CCTα-deficient B-cells exhibited a hyper-IgM secretion phenotype coupled with a lack of IgG production. The inability of CCTα-/- B-cells to undergo class switch recombination correlated with a proliferation defect in vivo and in vitro in response to antigenic and mitogenic stimuli. Lipopolysaccharide stimulation of CCTα-/- B-cells resulted in an early trigger of the unfolded protein response-mediated splicing of Xbp-1 mRNA, and this was accompanied by accelerated kinetics of IgM secretion and higher incidence of IgM-secreting cells. Thus, the inability of stimulated B-cells to produce enough phosphatidylcholine prevents proliferation and class switch recombination but leads to unfolded protein response activation and a hyper-IgM secretion phenotype.
Stimulated B-lymphocytes proliferate and/or differentiate into plasma cells, which synthesize and secrete large amounts of Ig. Both events require a significant increase in cellular membrane phospholipid biosynthesis. Proliferation results in a doubling of the cellular membrane content prior to each cell division (1), whereas plasma cell differentiation is accompanied by a substantial increase in membrane phospholipid to support the expansion of the endoplasmic reticulum (ER) synthetic and secretory apparatus (2, 3). The most abundant membrane phospholipid component is phosphatidylcholine (PtdCho),2 whose synthesis is regulated by the CTP:phosphocholine cytidylyltransferase (CCT). CCT is dynamically regulated during cell cycle progression (1, 4, 5), and increased PtdCho biosynthesis during plasma cell formation is accomplished by a program of genetic and biochemical events that up-regulate the flux through CCT (3). An alternative pathway to PtdCho mediated by the phosphatidylethanolamine N-methyltransferase contributes only about 5% to the total PtdCho following B-cell stimulation (3). Thus, CCT plays a central role in multiple aspects of membrane biogenesis during B-cell development.
Plasma cell differentiation requires XBP-1 (X-box-binding protein 1), a transcription factor regulated by the unfolded protein response (UPR) (6). The Xbp-1 mRNA is processed by a novel, UPR-mediated splicing mechanism, yielding the transcriptional activator XBP-1(S) (7). Enforced expression of XBP-1(S) activates the cytidine diphosphocholine pathway for PtdCho synthesis and triggers an expansion of the ER compartment (8). Consistent with its key regulatory role, enforced expression of CCTα is sufficient to increase membrane PtdCho, in contrast to other enzymes in the cytidine diphosphocholine pathway (9). As a cellular response to ER stress, the UPR has been most extensively studied as it relates to protein quality control in the ER, but phospholipid metabolism also appears to be vitally important. CCT inactivation leads to PtdCho depletion, activation of some components of the ER stress response, and cell death in cultured fibroblasts (10). Alteration of the ER lipid composition by accumulation of free cholesterol initiates ER stress in macrophages (11, 12), and CCT inactivation renders macrophages more sensitive to the lethal effects of free cholesterol loading (13). These results suggest that ER phospholipid quality control may impact plasma cell differentiation as well as the UPR.
Three CCT isoforms are known in mammals, CCTα, CCTβ2, and CCTβ3 (5, 14), and the different CCT isoforms are biochemically similar in enzymatic activity and regulation (15). CCTα is the dominant isoform expressed in most tissues, including the CH12 B-cell line (3). Accordingly, deletion of the Pcyt1a (CCTα) gene is lethal prior to embryonic day 3.5 (16), whereas the deletion of CCTβ only results in premature reproductive senescence (17). The functions of CCTα in adult animals have been studied by tissue-specific deletion of CCTα gene expression using the Cre-loxP system. These studies have revealed distinct roles for CCTα in professional secretory cells, including the formation and secretion of surfactant by alveolar epithelial cells (18), the assembly and secretion of lipoproteins by hepatocytes (19), and cytokine secretion by stimulated macrophages (20). In this study, the role of CCTα in B lymphocyte function was examined by selectively deleting the Pcyt1a gene encoding CCTα in murine B-cells. We found that XBP-1(S) expression and IgM secretion were activated with accelerated kinetics and more robustly in stimulated CCTα-deficient B-cells. However, compromised PtdCho synthesis in CCTα-deficient B-cells correlated with severely reduced proliferation and only minimal Ig class switching. Thus, by regulating the supply of PtdCho, CCTα plays a pivotal role in determining the function and the fate of activated B-cells.
EXPERIMENTAL PROCEDURES
Generation of B-cell-specific CCTα Knock-out (KO) Mice and B-cell Isolation—Pcyta1fl/fl mice (13) were bred with Pcyta1fl/fl/CD19cre/cre mice to obtain Pcyta1fl/fl/CD19cre/+ (KO) mice. Mouse tails were genotyped as previously described (13) and following the protocol for Cre recombinase detection from The Jackson Laboratory. All procedures involving mice were performed according to protocols approved by the Institutional Animal Care and Use Committee of St. Jude Children's Research Hospital. Splenic B-cells were isolated from wild type (WT) (Pcyta1fl/fl) or KO mice by either a depletion strategy using the B-cell isolation kit or a positive strategy using the CD19 isolation kit (Miltenyi Biotech) according to the manufacturer's directions. Purified splenic B-cells were cultured at 1.0–2.0 × 10⁶ cells/ml, and viability was determined by propidium iodide or trypan blue exclusion of at least 100 cells in triplicate microscopic fields.
Cell Genotyping—DNA was extracted from WT and KO B-cells resuspended in TRIzol® (Invitrogen), following the manufacturer's directions. Because of the low viability 72 h after LPS stimulation, WT and KO B-cells were enriched in viable cells (more than 90%) by one-step gradient sedimentation using Ficoll-Paque™ PLUS (GE Healthcare) following a published protocol (21). Pcyt1a-/- and Pcyt1afl/fl genotypes were determined by using the same primers used previously (13), and samples were run on a 2% agarose gel. PCR products were stained with ethidium bromide and quantified using a Typhoon 9200 scanner (GE Healthcare) controlled by Typhoon Scanner Control software, version 2.0 (GE Healthcare) together with ImageQuant TL software, version 2003.02 (Amersham Biosciences). Values were normalized to the number of bp for each PCR product.
Immunocytochemistry—Wild-type and KO mice were sacrificed, and the spleens were collected, embedded in OCT™ cryoprotective medium, and frozen on dry ice. Spleens were sliced, 4-μm thickness, using a microtome cryostat HM 505 (MICROM International Gmbh), and fixed in acetone at -20 °C. Tissue slides were incubated first with biotinylated rat anti-mouse IgD (eBiosciences) and rabbit anti-mouse CCTα, previously characterized (22), followed by incubation with AlexaFluor®488 mouse anti-biotin and AlexaFluor®594 goat anti-rabbit IgG (Molecular Probes). Splenic germinal centers were detected by staining with fluorescein isothiocyanate-conjugated peanut agglutinin (Sigma) and R-phycoerythrin-labeled anti-mouse B220 (BD Biosciences). Apoptotic cells were detected in spleen sections from WT and KO mice using the ApopTag® fluorescein in situ apoptosis detection kit from Chemicon International, following the manufacturer's protocol. Images were acquired using an Olympus BX41 microscope equipped with an UPlanFl ×20/0.50 objective and a 7.3 Three Shot color camera from Diagnostic Instruments, Inc., controlled by SPOT software, version 4.0.4PC, from Diagnostic Instruments, Inc.
CCT Activity Measurement and Metabolic Labeling—CCT activities in B-cell lysates were measured as previously described (3). [methyl-3H]Choline incorporation into PtdCho was performed as described previously (3) using medium containing 6 μm choline and supplemented with 16.4 μCi/ml [3H]choline.
RNA and Lipid Measurements—Total RNA was isolated and analyzed as previously reported (3). The amount of target RNA was normalized to either the endogenous glyceraldehyde-3-phosphate dehydrogenase reference or to the total amount of RNA used to prepare the cDNA. The relative expression of XBP-1 and XBP-1(S) was determined using primers and procedures described elsewhere (23). Lipids from B-cells were quantified as described previously (3).
Flow Cytometry Analysis of B-cells—Splenocytes and cells from the peritoneal cavity were depleted of red blood cells and labeled with anti-mouse B220, anti-mouse IgM, and anti-mouse CD3 (BD Biosciences) in the presence of anti-mouse CD16/32 (eBiosciences). Samples were analyzed using a FACSCalibur cytometer (BD Biosciences), and data were acquired using CellQuest™ Pro (version 5.2.1) software (BD Biosciences) and analyzed using WinMDI (version 2.8) software (Joseph Trotter).
B-cell Proliferation in Vitro—Purified B-cells were suspended in RPMI 1640 culture medium supplemented with 10% fetal bovine serum, seeded at 5 × 10⁵ cells/ml in a 96-well plate, and cultured for 72 h with 10 μg/ml Escherichia coli LPS (E. coli 055:B5; Sigma). Proliferation was measured by adding [3H]thymidine (63 Ci/mmol; American Radiolabeled Chemicals) to the medium (final 50 μCi/ml) and incubating for 6 h. Cells were harvested using MF™-membrane filters (0.45-μm pores; Millipore) and washed, and the radioactivity was measured by scintillation spectroscopy.
B-cell Proliferation in Vivo—Wild-type and KO mice were injected subcutaneously with 30 μg of NP-KLH dispersed in TiterMax Gold adjuvant (Sigma). After 7 days, mice were sacrificed, spleens were isolated, and the total splenic B-cell numbers were determined by flow cytometry of B220-positive cells.
Immunization and Immunoglobulin Measurements—Wild-type and KO mice were injected subcutaneously with 30 μg of NP-KLH dispersed in TiterMax Gold adjuvant (Sigma). Prior to injection and at the indicated times following immunization, blood was collected, and the serum IgM and IgG content (both λ- and κ-chain) was measured by enzyme-linked immunosorbent assay. IgM and IgG were quantified using goat anti-mouse IgM (μ-chain-specific), goat anti-mouse IgG (γ-chain-specific), goat anti-mouse κ-or λ-alkaline phosphatase (Southern-Biotech), and 4-methylumbelliferyl phosphate (Sigma) as substrate.
Antibody Secretion in Vitro—Purified B-cells were plated and stimulated with LPS. At times before and after stimulation, cells were collected, washed, counted, and cultured for 4 h in fresh medium. The amount of IgM in the medium was measured by enzyme-linked immunosorbent assay. The number of IgM-secreting cells was assessed by an enzyme-linked immunosorbent spot assay. In practice, after washing the cells before and after stimulation, the cells were cultured for 4 h on MultiScreen™-IP plates (Millipore) coated with goat anti-mouse IgM. After washing the plate to remove the cells, the plate was treated with a mixture of goat anti-mouse κ- and λ-alkaline phosphatases, and the IgM spots were revealed by incubation with 5-bromo-4-chloro-3-indolyl phosphate and p-nitro blue tetrazolium salt (Sigma).
Cell Cycle Arrest with Aphidicolin—Purified B-cells were stimulated with LPS with or without 2 μg/ml aphidicolin (Sigma). After 24 h, cells were harvested, and the number of secreting cells was estimated by enzyme-linked immunosorbent spot assays.
RESULTS
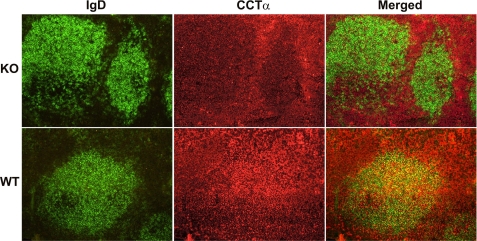
Selective Deletion of CCTα in B Lymphocytes—Mice were derived whereby exons 5 and 6 of the Pcyt1a gene, encoding CCTα, were deleted in B lymphocytes. This was accomplished using Cre/loxP-mediated gene deletion under the transcriptional control of the B-cell lineage-restricted CD19 gene (24). Mice homozygous for the “floxed” CCTα allele (Pcyt1afl/fl) (13) were crossed with mice with a Pcyt1afl/fl/CD19cre genotype. Loss of the loxP-flanked exons of Pcyt1a resulted in expression of a truncated protein that lacked the essential catalytic core and carboxyl terminal sequences of CCTα. To confirm the loss of CCTα protein expression, spleens from KO and WT control mice were examined using immunocytochemistry (Fig. 1). B-cells were identified by staining splenic sections with anti-mouse IgD antibodies, whereas CCTα was localized using an antibody raised against the carboxyl-terminal region of the protein (22). CCTα was widely distributed in all cell types present in the spleens of WT mice, but its abundance was low to absent in the IgD-positive B-cell clusters in spleens from KO animals. These data confirmed that CCTα protein was absent in a significant portion of the B-cell population in animals exhibiting the KO genotype (Pcyt1afl/fl/CD19cre) compared with WT mice (Pcyt1afl/fl).
FIGURE 1.
Detection of B-cells and CCTα protein in spleens of Pcyt1afl/fl/CD19cre/+ (KO) mice. Spleens isolated from mice with either the KO genotype (Pcyt1afl/fl/CD19cre/+) or control WT (Pcyt1afl/fl) were sectioned and stained for either CCTα (red) or IgD (green), a B-cell marker. Cells co-expressing CCTα and IgD are visualized as yellow in the merged panels. Immunofluorescence staining was performed on spleens from three different mice per group with the same result.
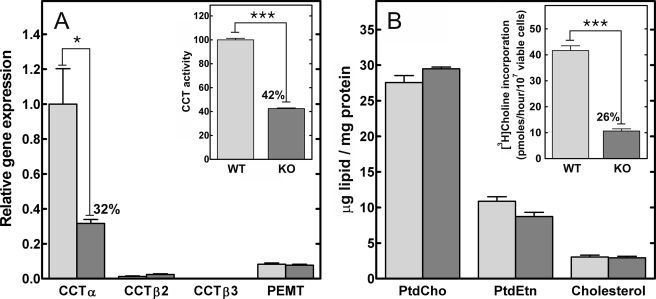
B-cells were isolated from the spleens of KO and WT mice to evaluate expression of the PtdCho biosynthetic components. CCTα mRNA in KO B-cells was 32% of the levels in wild-type control cells (Fig. 2A). Expression of the alternate CCT isoforms, CCTβ2 and β3, both encoded by the Pcyt1b gene, was comparable in both WT and KO populations, as was expression of Pemt (phosphatidylethanolamine methyltransferase). These data indicated that CCTα was not expressed in about 70% of the splenic B-cells and that the expression of the alternate routes to PtdCho did not increase to compensate for the loss of CCTα. The level of total CCT protein was estimated by measuring the total CCT activity in B-cell lysates. The KO population had a specific activity for CCT that was reduced ∼60% compared with B-cells from WT animals (Fig. 2A, inset). The contribution of CCTβ2 to the total level of CCT activity in the cells accounted for the slightly higher levels of CCT activity in the KO cells than would be predicted from the reduction in the CCTα mRNA abundance. However, the reduction in CCTα transcript and total CCT activity did not affect the amounts of the major membrane lipid components in the B-cells (Fig. 2B). These data are consistent with earlier analytical results with macrophages (20) or hepatocytes (19), which were selectively deleted in CCTα expression and possessed normal amounts of PtdCho in vivo. The results indicated that the cellular PtdCho level in the KO B-cells was sustained by CCTβ2 and/or the acquisition of PtdCho from extracellular sources, such as serum high density lipoprotein (25). A reduction in the rate of PtdCho synthesis via the CCTα-dependent cytidine diphosphocholine pathway was confirmed by a significant decrease in the rate of PtdCho synthesis measured by the metabolic labeling of intact B-cells (Fig. 2B, inset). Thus, CCTα expression and de novo PtdCho synthesis were reduced in a significant proportion of B lymphocytes in the KO animals. However, between 20 and 30% of the splenic B-cell population in the KO animals expressed wild-type CCTα, due to incomplete penetrance of Cre recombinase expression, as has been reported before (24).
FIGURE 2.
Real time quantitative reverse transcription-PCR, CCT activity, and lipid content of WT and KO splenic B-cells. Splenic CD19-positive B-cells were isolated by positive selection from wild-type (light gray) and KO (dark gray) mice. A, Pcyt1a (CCTα), Pcyt1b (CCTβ2 or CCTβ3 transcripts), and Pemt (phosphatidylethanolamine N-methyltransferase) mRNA levels were measured by real time quantitative reverse transcription-PCR. The amount of each mRNA was normalized to the level of glyceraldehyde-3-phosphate dehydrogenase mRNA and then to Pcyt1a expression in the WT B-cell population. A (inset), total cellular CCT specific activity was measured in lysates of WT and KO B-cells. The specific activity in the wild-type B-cells was 1.75 ± 0.04 nmol/min/mg (n = 4). B, total lipids were extracted from the purified WT and KO B-cells, and the amount of PtdCho, phosphatidylethanolamine (PtdEtn), and cholesterol were quantified and normalized to protein content. B (inset), WT and KO B-cells were metabolically labeled with [3H]choline to compare the rates of PtdCho synthesis. The data are the mean ± S.E. from at least three independent determinations in two independent experiments.
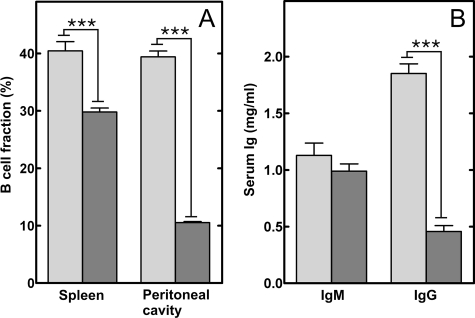
B-cell Population and Serum Ig Levels in B-cell-specific CCTα KO Mice—B-cells were isolated from several locations in WT and KO mice and quantified (Fig. 3A). Splenic B-cells, which are primarily B2-cells originating from adult bone marrow (26), were reduced by about 25%. In contrast, the B-cell abundance in adult bone marrow was equivalent in WT and KO animals (Fig. S7). CCTα deletion in the KO bone marrow B-cells was confirmed by PCR (data not shown). There was no reproducible change in the distribution of marginal zone cells or follicular cells isolated from KO spleens (data not shown). On the other hand, peritoneal B-cells, primarily B1-cells that are a self-renewing population produced by fetal liver, were reduced by 75% in the CCTα-deficient animals. These results suggested that proliferation and/or survival of the peripheral B-cell populations were compromised by the loss of CCTα expression. Terminal deoxynucleotidyltransferase-mediated dUTP nick end-labeling staining of splenic sections from KO animals did not show increased apoptosis compared with spleens from WT animals (Fig. S1A), and cell viability in both KO and WT B-cell populations was ≥80% following stimulation for 48 h in vitro (Fig. S1B). Thus, these data indicated that the CCTα deficiency primarily affected B-cell proliferation in the periphery.
FIGURE 3.
Quantification of B-cells and serum immunoglobulins in wild-type and KO mice. Splenocytes and peritoneal cells were collected from control and KO mice, counted and stained for either B220, IgM, or CD3 expression and analyzed by flow cytometry. A, percentage of B-cells relative to the total number of cells isolated from dissociated spleens or peritoneal lavage of WT (light gray) or KO (dark gray) animals. The data represent the mean values ± S.E. from four independent experiments. B, the circulating levels of IgM and IgG in sera from WT (light gray) or KO (dark gray) mice were determined using an enzyme-linked immunosorbent assay. The data represent the mean ± S.E. (9 mice/group).
Basal serum immunoglobulin levels in the KO mice were also affected (Fig. 3B). Although the levels of circulating IgM were not statistically different between the WT and KO animals, there was a 75% drop in the serum levels of IgG in the KO mice. These data indicated that the KO mice were selectively deficient in the production of IgG.
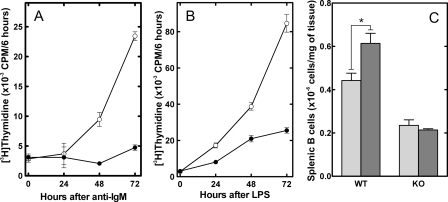
Proliferative Response of CCTα-deficient B-cells—B lymphocytes were isolated from WT and KO spleens and stimulated in vitro to evaluate the proliferation of CCTα-deficient cells. Proliferation, as measured by thymidine incorporation into DNA, was significantly lower in the KO population in response to either anti-IgM, which stimulates the B-cell antigen receptor (Fig. 4A), or bacterial LPS, an activator of the Toll-like receptor 4 (Fig. 4B). The low level of [3H]thymidine incorporation that was observed in B-cells from the KO animals was explained by the fraction that still expressed CCTα. This result was not unexpected, because it was clear from previous work that CCTα was essential for the proliferation of immortalized cells, although inhibition of CCT activity in those systems resulted in apoptosis (27). Although the KO B-cells were unable to proliferate, receptor signaling mechanisms appeared to be intact, as demonstrated by tyrosine phosphorylation after stimulation with anti-IgM (Fig. S2). Since the WT cells would eventually become dominant in the KO population due to their proliferative advantage, we evaluated the rate at which this occurred. In a separate experiment, we found that before stimulation with LPS and up to 24 h thereafter, about 60% of the B-cells had deleted CCTα (Fig. S3). The KO fraction dropped significantly and was represented in only 10% of the population by 72 h after LPS. The situation in vivo was not quite the same. The smaller but significant population of CCTα-deficient B-cells in the KO mice suggested that CCTα was not absolutely required for the formation and survival of B-cells in vivo and that sufficient PtdCho was derived from the activity of CCTβ and/or a source other than de novo synthesis. Splenic B-cells proliferate following antigen stimulation, so we assessed the B-cell numbers in the spleens of wild-type and KO mice following immunization with keyhole limpet hemocyanin conjugated to a 4-hydroxy-3-nitrophenylacetyl hapten (NP-KLH) (Fig. 4C). We found the expected increase in splenic B-cell numbers in WT animals 7 days after NP-KLH administration. However, there was no increase in the number of B-cells in the spleens from the KO animals, which also lacked germinal centers (Fig. S4). These data indicated that the CCTα-deficient B-cells had a defect in proliferation in response to immunization in vivo.
FIGURE 4.
B-cell proliferation in vitro and in vivo. Splenic B-cells were isolated by negative selection from WT (○) and KO (•) mice and were stimulated with either anti-IgM (A) or LPS (B) and cultured for 24, 48, and 72 h. Cell proliferation was measured using a 6-h pulse with [3H]thymidine. C, the number of splenic B-cells in WT and KO mice was determined before (light gray) or after 7 days (dark gray) following the injection of NP-KLH. The number of splenic B-cells represents the mean ± S.E. (3 mice/group).
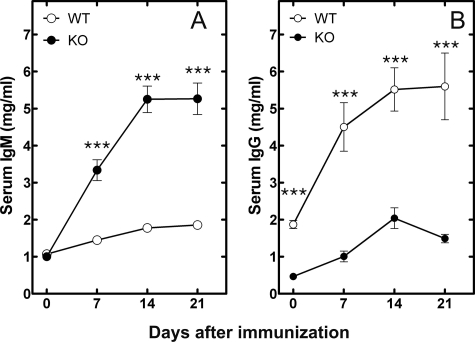
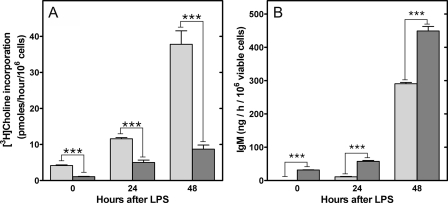
Antibody Production in B-cell-specific CCTα KO Mice—Antibody production was evaluated in wild-type and KO mice in response to immunization with NP-KLH. The response to immunization with NP-KLH is dependent on the interaction between T-cells and B-cells and is accompanied by B-cell proliferation in the spleen and antibody production by differentiated plasma cells. The proliferation and differentiation process results in a shift from synthesis and secretion of IgM by the naive B-cells to the production of higher affinity IgG by the differentiated plasma cells. The normal production of IgG in response to NP-KLH was significantly reduced in the KO animals (Fig. 5B). In contrast, the KO animals produced significant amounts of IgM rather than IgG (Fig. 5A). These results indicated that despite the reduced CCTα activity (Fig. 6A), the KO B-cells were capable of secreting antibodies but were unable to proliferate and undergo isotype switching. This was a general feature of the KO B-cells, since the IgG response to immunization with a T-cell-independent antigen, NP-Ficoll, was blunted as well (Fig. S5). The ability of CCTα-deficient B-cells to secrete large amounts of IgM was corroborated in vitro (Fig. 6B). Both before and after stimulation with LPS, the CCTα-/- B-cell population secreted IgM at a significantly higher rate compared with the WT B-cells. B-cells can secrete small amounts of IgG in vitro, in addition to IgM, and we measured this feature in both WT and KO cells. The KO B-cells secreted more IgG with earlier kinetics compared with cultured WT B-cells, similar to the results for IgM secretion (Fig. S6). These results suggested an early activation of plasma cell differentiation in the KO animals.
FIGURE 5.
Responses of WT and KO mice to immunization with a T-cell-dependent antigen (NP-KLH). Serum IgM (A) and serum IgG (B) levels following NP-KLH injection of WT (○) and KO (•) mice were measured. In each immunization, eight mice were used per group, and the data represent the mean ± S.E. of the Ig levels measured using an enzyme-linked immunosorbent assay.
FIGURE 6.
PtdCho biosynthesis and IgM secretion in vitro by WT and KO B-cells in response to LPS. A, the rate of incorporation of [3H]choline into PtdCho was determined before and at 24 or 48 h after the addition of LPS to KO (dark gray) or WT (light gray) purified splenic B-cells. B, the amount of IgM secreted in vitro during a 1-h period from KO (dark gray) or WT (light gray) B-cells was determined before and 24 or 48 h after stimulation with LPS. The data are the mean ± S.E. from at least three independent determinations in two independent experiments.
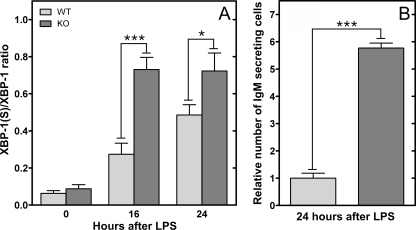
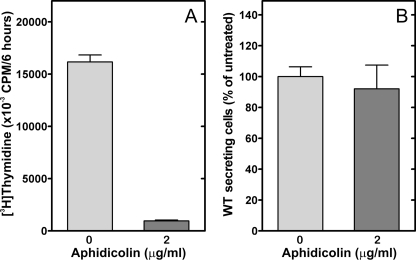
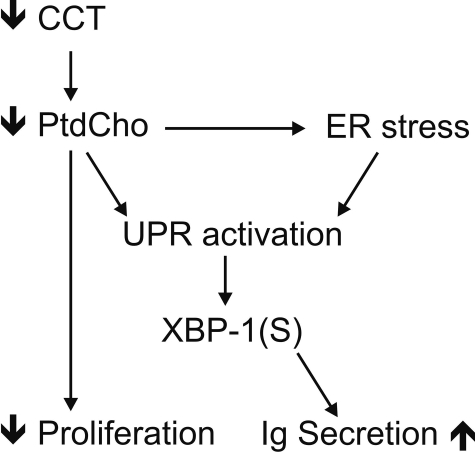
Activation of the UPR in CCTα-deficient B-cells—The primary biochemical defect in CCTα KO B-cells was demonstrated to be a reduction in the rate of PtdCho synthesis (Fig. 2B), and stimulation imposed an even greater demand for PtdCho (Fig. 6A). The correlation between the reduced PtdCho synthesis and elevated IgM secretion in the KO cells (Fig. 6B) was counterintuitive, based on the implied need for membrane PtdCho expansion during plasma cell differentiation (3). Our observations suggested that PtdCho deficiency triggered the secretion program in B-cells. We hypothesized that the mechanism involved in B-cell differentiation and in the response to PtdCho deficiency was activation of the UPR. The splicing of XBP-1 to form XBP-1(S) is a hallmark of UPR activation, and the XBP-1(S) is a key transcription factor in the control of membrane phospholipid biogenesis (9). We found that the CCTα-deficient B-cell population had significantly higher levels of XBP-1(S) mRNA after LPS stimulation, and the amount of this UPR-generated transcript increased substantially faster compared with the kinetics of activation in WT cells (Fig. 7A). This elevation in XBP-1(S) correlated with a higher number of Ig-secreting cells in the CCTα-/- population (Fig. 7B) and corresponded to the increased rate of secretion observed in the stimulated KO B-cells (Fig. 6 and Fig. S6). These data indicated an accelerated activation of the UPR in the stimulated KO cells that, in turn, promoted antibody secretion. Since both CCT deficiency (28, 29) and pharmacologic induction of the UPR (30) block proliferation in immortalized cell lines, we tested whether simply blocking cell proliferation in LPS-stimulated B-cells by another means would trigger IgM secretion as well as halt proliferation. However, aphidicolin, an inhibitor of DNA synthesis that blocks cells in the G1-S phase transition, did not change the kinetics of secretion in WT cells, despite an inhibition of thymidine incorporation (Fig. 8). These data indicated that an inability to undergo cell division does not necessarily commit B-cells toward terminal differentiation into antibody-secreting cells. Rather, we propose that the early and potent induction of XBP-1(S) in CCTα-deficient B-cells accelerates and augments the transition into antibody secretion (Fig. 9).
FIGURE 7.
IgM secreting cells and Xbp-1 mRNA splicing following B-cell stimulation with LPS. WT (light gray) and KO (dark gray) B-cells were purified by negative selection and cultured in the presence or absence of LPS. A, real time quantitative reverse transcription-PCR detected the expression of unspliced and spliced Xbp-1 mRNA before and after stimulation with LPS for 16 or 24 h. B, the number of IgM-secreting B-cells was determined using an enzyme-linked immunosorbent spot assay, and the WT value was set at 1. The data are the mean ± S.E. from at least three independent determinations in two independent experiments.
FIGURE 8.
Effect of aphidicolin on proliferation and secretion of WT B-cells. Purified splenic WT B-cells were stimulated with LPS for 24 h with (dark gray) or without (gray) the addition of aphidicolin (2 μg/ml). A, proliferation was measured by [3H]thymidine incorporation into cells. B, IgM secretion was measured by enzyme-linked immunosorbent spot assays. The data are the mean ± S.E. from three independent determinations in two independent experiments.
FIGURE 9.
XBP-1(S) is a common intermediate. Loss of CCTα expression leads to reduction of PtdCho synthesis, which, in turn, can block cell proliferation. Reduction in PtdCho synthesis leads to ER stress, activation of the UPR, and formation of XBP-1(S). Reduction in PtdCho synthesis might also trigger UPR activation independently of the general ER stress response. XBP-1(S) triggers the synthesis of the secretory machinery in B-cells.
DISCUSSION
The interruption of membrane phospholipid synthesis in CCTα-deficient cells elicited by a block in PtdCho formation at the CCTα step results in early activation of the UPR, as demonstrated by Xbp-1 mRNA splicing (Fig. 7). Induction of XBP-1(S) mRNA correlates with the inhibition of proliferation (Fig. 4) and an increased rate of IgM secretion from a greater number of stimulated B-cells (Figs. 6 and 7). XBP-1(S) is the active transcription factor that is derived from the splicing of the Xbp-1 mRNA by IRE1α (inositol-requiring 1α) in response to ER stress (7). XBP-1 is an essential prerequisite for immunoglobulin secretion via the ER (31). XBP-1-/- B-cells are found in normal numbers in vivo, but in response to stimulation they secrete neither IgM nor IgG at normal levels (6). IRE1α, an integral ER membrane protein and proximal transducer of the UPR, oligomerizes in response to the accumulation of misfolded proteins in the ER lumen to activate its cytosolic ribonuclease domain. Activated IRE1α then executes site-specific cleavage of Xbp-1 transcript to initiate the UPR-mediated splicing mechanism that yields XBP-1(S) mRNA (23, 32). To date, the only known way to initiate the novel splicing of XBP-1 transcripts requires that the IRE1 ribonuclease site-specifically cleave the XBP-1 mRNA, and to date, the only known ways to activate the IRE1 protein involve some type of event that “stresses” the ER, such as disruption of protein folding in the ER, augmentation of protein traffic through the ER, or disruption of lipid biosynthesis. One function of XBP-1(S) appears to involve directing increased production of phospholipids necessary for intracellular membrane biogenesis (9), and CCTα plays a key role providing PtdCho to support ER expansion in differentiating B-cells (8). In addition, XBP-1(S) is required for increased expression of a large cohort of genes that enhance both the protein biosynthetic and secretory capacity of differentiating B-cells (33). Thus, the enhanced IgM secretion in stimulated CCTα-/- B-cells reflects an acceleration of the normal processes that occur in B-cells following the activation of Xbp-1 splicing.
Previous work has established that synthesis of Ig μ-heavy chain is required for maximal induction of XBP-1(S) in LPS-stimulated B-cells (34). This fits well with the observation that the level of XBP-1(S) peaks after maximal synthesis of μ-chains has been achieved (35, 36). However, it has also been observed that XBP-1(S) synthesis initiates prior to the strongest increase in μ-chain synthesis (35, 37), suggesting that another signal(s) might contribute to the activation of UPR-mediated Xbp-1 mRNA splicing in the early stages of LPS stimulation. Indeed, our studies of CCTα-deficient B-cells reveal that the IRE1α-XBP-1 branch of the UPR responds to increased demand for phospholipids as well as increased demand on the protein folding capacity of the ER. In agreement with our findings, the inhibition of PtdCho (10) and fatty acid synthesis (38) have both been shown to elicit activation of UPR components. Depletion of ER phospholipids or alteration of the ratio between PtdCho and other membrane lipids may lead to ER membrane protein aggregation and activation of IRE1α to trigger the splicing of Xbp-1 mRNA and, perhaps, activation of the UPR in general. Alternatively, the defect in producing membrane phospholipids for the ER may adversely affect the folding and insertion of newly synthesized ER membrane protein or interfere with vesicular trafficking in the secretory apparatus. These types of perturbations could certainly lead to an inappropriate build-up of proteins in the ER and, in turn, activate IRE1α by established mechanisms. It will be of interest to assess the activation status of other proximal transducers of the UPR, PERK (PKR-like ER kinase) and ATF6 (activating transcription factor 6), in the CCTα-deficient B-cells. We propose that the signals and mechanisms underlying activation of the UPR warrant further investigation.
Inhibition of PtdCho synthesis by pharmacological or genetic reduction in CCT activity is known to block cell proliferation and trigger cell death in cultured immortalized cell lines (10, 39, 40). However, CCTα-/- primary animal cells survive and differentiate, as exemplified by macrophages (13), hepatocytes (19), lung alveolar cells (18), and B-cells (this study). These results strongly suggest that another source of PtdCho is available that circumvents a requirement for CCTα. It is likely that the uptake of serum lipoproteins (25), coupled with a contribution from CCTβ expression, is sufficient to support development. On the other hand, B-cell numbers do not increase following immunization of KO animals, and the challenge of rapid proliferation in stimulated B-cells reveals a requirement for de novo PtdCho synthesis. The inability to proliferate accounts for the lack of IgG production by CCTα-deficient B-cells, since class switch recombination is dependent on the DNA synthesis that accompanies proliferation. Interestingly, the low IgG levels and the hyper-IgM secretion phenotype exhibited by the CCTα-deficient animals in response to immunization are similar to the phenotypes of murine class switch recombination deficiencies. However, it is difficult to envision how a reduction in PtdCho synthesis would lead to a block in class-switch recombination, particularly since phospholipid synthesis and DNA synthesis are not co-dependent (4). In light of our analysis of CCTα-deficient B-cells and previous data showing that UPR-mediated splicing of Xbp-1 mRNA is a prerequisite for terminal differentiation of B-cells into antibody-secreting plasma cells (34), we speculate that XBP-1(S) might play a role in the cessation of B-cell proliferation. Further investigation of these questions should provide additional insight into the complex relationship of increased need for membrane lipids and protein production capacity, the UPR, and the function and fate of activated B-cells.
Supplementary Material
Acknowledgments
We thank Lois Richmond and Karen Miller for animal husbandry, Matthew Frank for computer assistance, and Charles Rock for critical reading of the manuscript.
This work was supported, in whole or in part, by National Institutes of Health Grants GM45737 (to S. J.), GM61970 (to J. W. B.), CA23944 (to C. S.), and Cancer Center (CORE) Support Grant CA21765. This work was also supported by the American Lebanese Syrian Associated Charities. The costs of publication of this article were defrayed in part by the payment of page charges. This article must therefore be hereby marked “advertisement” in accordance with 18 U.S.C. Section 1734 solely to indicate this fact.
The on-line version of this article (available at http://www.jbc.org) contains supplemental Figs. S1–S7.
Footnotes
The abbreviations used are: PtdCho, phosphatidylcholine; ER, endoplasmic reticulum; UPR, unfolded protein response; CCT, CTP:phosphocholine cytidylyltransferase; LPS, lipopolysaccharide; NP-KLH, 4-hydroxy-3-nitrophenylacetyl-conjugated keyhole limpet hemocyanin; KO, knock-out; WT, wild-type.
References
- 1.Jackowski, S. (1996) J. Biol. Chem. 271 20219-20222 [DOI] [PubMed] [Google Scholar]
- 2.Wiest, D. L., Burkhardt, J. K., Hester, S., Hortsch, M., Meyer, D. I., and Argon, Y. (1990) J. Cell Biol. 110 1501-1511 [DOI] [PMC free article] [PubMed] [Google Scholar]
- 3.Fagone, P., Sriburi, R., Ward-Chapman, C., Frank, M., Wang, J., Gunter, C., Brewer, J. W., and Jackowski, S. (2007) J. Biol. Chem. 282 7591-7605 [DOI] [PubMed] [Google Scholar]
- 4.Jackowski, S. (1994) J. Biol. Chem. 269 3858-3867 [PubMed] [Google Scholar]
- 5.Jackowski, S., and Fagone, P. (2005) J. Biol. Chem. 280 853-856 [DOI] [PubMed] [Google Scholar]
- 6.Reimold, A. M., Iwakoshi, N. N., Manis, J., Vallabhajosyula, P., Szomolanyi-Tsuda, E., Gravallese, E. M., Friend, D., Grusby, M. J., Alt, F., and Glimcher, L. H. (2001) Nature 412 300-307 [DOI] [PubMed] [Google Scholar]
- 7.Yoshida, H., Matsui, T., Yamamoto, A., Okada, T., and Mori, K. (2001) Cell 107 881-891 [DOI] [PubMed] [Google Scholar]
- 8.Sriburi, R., Bommiasamy, H., Buldak, G. L., Robbins, G. R., Frank, M., Jackowski, S., and Brewer, J. W. (2007) J. Biol. Chem. 282 7024-7034 [DOI] [PubMed] [Google Scholar]
- 9.Sriburi, R., Jackowski, S., Mori, K., and Brewer, J. W. (2004) J. Cell Biol. 167 35-41 [DOI] [PMC free article] [PubMed] [Google Scholar]
- 10.Van Der Sanden, M. H., Houweling, M., van Golde, L. M., and Vaandrager, A. B. (2003) Biochem. J. 369 643-650 [DOI] [PMC free article] [PubMed] [Google Scholar]
- 11.Devries-Simone, T., Li, Y., Yao, P. M., Stone, E., Wang, Y., Davis, R. J., Flavell, R., and Tabas, I. (2005) J. Cell Biol. 171 61-73 [DOI] [PMC free article] [PubMed] [Google Scholar]
- 12.Feng, B., Yao, P. M., Li, Y., Devlin, C. M., Zhang, D., Harding, H. P., Sweeney, M., Rong, J. X., Kuriakose, G., Fisher, E. A., Marks, A. R., Ron, D., and Tabas, I. (2003) Nat. Cell Biol. 5 781-792 [DOI] [PubMed] [Google Scholar]
- 13.Zhang, D., Tang, W., Yao, P. M., Yang, C., Xie, B., Jackowski, S., and Tabas, I. (2000) J. Biol. Chem. 275 35368-35376 [DOI] [PubMed] [Google Scholar]
- 14.Clement, J. M., and Kent, C. (1999) Biochem. Biophys. Res. Commun. 257 643-650 [DOI] [PubMed] [Google Scholar]
- 15.Karim, M. A., Jackson, P., and Jackowski, S. (2003) Biochim. Biophys. Acta 1633 1-12 [DOI] [PubMed] [Google Scholar]
- 16.Wang, L., Magdaleno, S., Tabas, I., and Jackowski, S. (2005) Mol. Cell. Biol. 25 3357-3363 [DOI] [PMC free article] [PubMed] [Google Scholar]
- 17.Jackowski, S., Rehg, J. E., Zhang, Y.-M., Wang, J., Miller, K., Jackson, P., and Karim, M. A. (2004) Mol. Cell. Biol. 24 4720-4733 [DOI] [PMC free article] [PubMed] [Google Scholar]
- 18.Tian, Y., Zhou, R., Rehg, J. E., and Jackowski, S. (2007) Mol. Cell. Biol. 27 975-982 [DOI] [PMC free article] [PubMed] [Google Scholar]
- 19.Jacobs, R. L., Devlin, C., Tabas, I., and Vance, D. E. (2004) J. Biol. Chem. 279 47402-47410 [DOI] [PubMed] [Google Scholar]
- 20.Tian, Y., Pate, C., Andreolotti, A., Wang, L., Tuomanen, E., Boyd, K., Claro, E., and Jackowski, S. (2008) J. Cell Biol. 181 945-957 [DOI] [PMC free article] [PubMed] [Google Scholar]
- 21.Kruisbeek, A. M. (2008) Current Protocols in Immunology, Unit 3.1.4, John Wiley and Sons, Inc., New York [DOI] [PubMed]
- 22.Lykidis, A., Murti, K. G., and Jackowski, S. (1998) J. Biol. Chem. 273 14022-14029 [DOI] [PubMed] [Google Scholar]
- 23.Back, S. H., Schroder, M., Lee, K., Zhang, K., and Kaufman, R. J. (2005) Methods 35 395-416 [DOI] [PubMed] [Google Scholar]
- 24.Rickert, R. C., Roes, J., and Rajewsky, K. (1997) Nucleic Acids Res. 25 1317-1318 [DOI] [PMC free article] [PubMed] [Google Scholar]
- 25.Gunter, C., Frank, M., Tian, Y., Murti, K. G., Rehg, J. E., and Jackowski, S. (2007) Biochim. Biophys. Acta 1771 845-852 [DOI] [PMC free article] [PubMed] [Google Scholar]
- 26.Shapiro-Shelef, M., and Calame, K. (2005) Nat. Rev. Immunol. 5 230-242 [DOI] [PubMed] [Google Scholar]
- 27.Lykidis, A., and Jackowski, S. (2000) Prog. Nucleic Acids Res. Mol. Biol. 65 361-393 [DOI] [PubMed] [Google Scholar]
- 28.Waite, K. A., and Vance, D. E. (2000) J. Biol. Chem. 275 21197-21202 [DOI] [PubMed] [Google Scholar]
- 29.Baburina, I., and Jackowski, S. (1998) J. Biol. Chem. 273 2169-2173 [DOI] [PubMed] [Google Scholar]
- 30.Brewer, J. W., Hendershot, L. M., Sherr, C. J., and Diehl, J. A. (1999) Proc. Natl. Acad. Sci. U. S. A. 96 8505-8510 [DOI] [PMC free article] [PubMed] [Google Scholar]
- 31.Brewer, J. W., and Hendershot, L. M. (2005) Nat. Immunol. 6 23-29 [DOI] [PubMed] [Google Scholar]
- 32.Calfon, M., Zeng, H., Urano, F., Till, J. H., Hubbard, S. R., Harding, H. P., Clark, S. G., and Ron, D. (2002) Nature 415 92-96 [DOI] [PubMed] [Google Scholar]
- 33.Shaffer, A. L., Shapiro-Shelef, M., Iwakoshi, N. N., Lee, A. H., Qian, S. B., Zhao, H., Yu, X., Yang, L., Tan, B. K., Rosenwald, A., Hurt, E. M., Petroulakis, E., Sonenberg, N., Yewdell, J. W., Calame, K., Glimcher, L. H., and Staudt, L. M. (2004) Immunity 21 81-93 [DOI] [PubMed] [Google Scholar]
- 34.Iwakoshi, N. N., Lee, A. H., Vallabhajosyula, P., Otipoby, K. L., Rajewsky, K., and Glimcher, L. H. (2003) Nat. Immunol. 4 321-329 [DOI] [PubMed] [Google Scholar]
- 35.Gass, J. N., Gifford, N. M., and Brewer, J. W. (2002) J. Biol. Chem. 277 49047-49054 [DOI] [PubMed] [Google Scholar]
- 36.van, A. E., Romijn, E. P., Maggioni, C., Mezghrani, A., Sitia, R., Braakman, I., and Heck, A. J. (2003) Immunity 18 243-253 [DOI] [PubMed] [Google Scholar]
- 37.Gass, J. N., Jiang, H. Y., Wek, R. C., and Brewer, J. W. (2008) Mol. Immunol. 45 1035-1043 [DOI] [PMC free article] [PubMed] [Google Scholar]
- 38.Little, J. L., Wheeler, F. B., Fels, D. R., Koumenis, C., and Kridel, S. J. (2007) Cancer Res. 67 1262-1269 [DOI] [PubMed] [Google Scholar]
- 39.Esko, J. D., Wermuth, M. M., and Raetz, C. R. H. (1981) J. Biol. Chem. 256 7388-7393 [PubMed] [Google Scholar]
- 40.Boggs, K. P., Rock, C. O., and Jackowski, S. (1995) J. Biol. Chem. 270 11612-11618 [DOI] [PubMed] [Google Scholar]
Associated Data
This section collects any data citations, data availability statements, or supplementary materials included in this article.


