Abstract
Lipin 1 is a bifunctional intracellular protein that regulates fatty acid metabolism in the nucleus via interactions with DNA-bound transcription factors and at the endoplasmic reticulum as a phosphatidic acid phosphohydrolase enzyme (PAP-1) to catalyze the penultimate step in triglyceride synthesis. However, livers of 8-day-old mice lacking lipin 1 (fld mice) exhibited normal PAP-1 activity and a 20-fold increase in triglyceride levels. We sought to further analyze the hepatic lipid profile of these mice by electrospray ionization mass spectrometry. Surprisingly, hepatic content of phosphatidate, the substrate of PAP-1 enzymes, was markedly diminished in fld mice. Similarly, other phospholipids derived from phosphatidate, phosphatidylglycerol and cardiolipin, were also depleted. Another member of the lipin family (lipin 2) is enriched in liver, and hepatic lipin 2 protein content was markedly increased by lipin 1 deficiency, food deprivation, and obesity, often independent of changes in steady-state mRNA levels. Importantly, RNAi against lipin 2 markedly reduced PAP-1 activity in hepatocytes from both wild type and fld mice and suppressed triglyceride synthesis under conditions of high fatty acid availability. Collectively, these data suggest that lipin 2 plays an important role as a hepatic PAP-1 enzyme.
Spontaneously arising mutations in the gene encoding lipin 1 (Lpin1) cause severe metabolic abnormalities in fatty liver dystrophic (fld) mice (1), which exhibit neonatal growth retardation, fatty liver, and dyslipidemia (2). These phenotypic manifestations abruptly resolve at ∼14 days of age. However, adult fld mice exhibit lipodystrophy, insulin resistance, and susceptibility to atherosclerotic lesion formation (3, 4). Recent evidence regarding the molecular functions of lipin 1 has begun to explain the severe metabolic phenotype of these mice.
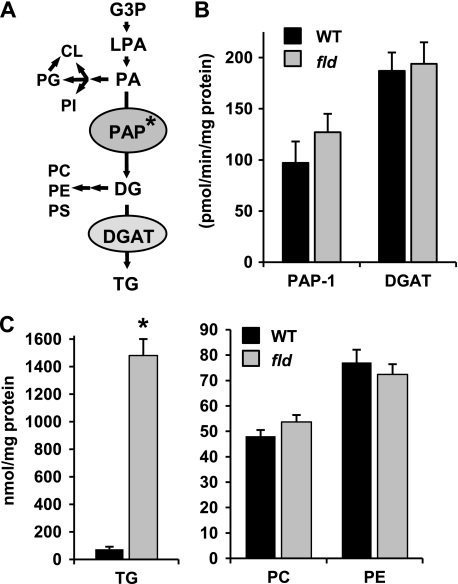
Lipin 1 catalyzes the Mg2+-dependent dephosphorylation of phosphatidic acid (phosphatidic acid (PA)2 phosphohydrolase (PAP-1) (5)) to form diacylglycerol (DG), the penultimate step in the Kennedy pathway of triglyceride (TG) synthesis (Fig. 1A). As proof of the importance of lipin 1-mediated PAP-1 activity, fld mice almost completely lack this enzymatic activity in adipose tissue, skeletal muscle, and heart (6), and the inability to synthesize TG in adipocytes may explain the defect in adipogenesis in fld mice.
FIGURE 1.
Lipin 1 deficiency does not affect PAP-1 activity in neonatal mice and leads to hepatic TG accumulation. A, the schematic depicts the pathways of TG synthesis from glycerol-3-phosphate (G3P) as well as the derivation of phospholipid. LPA, lysophosphatidic acid; PI, phosphatidylinositol; PE, phosphatidylethanolamine; PC, phosphatidylcholine; PS, phosphatidylserine. Asterisk, step that lipin proteins can catalyze. B, the graph illustrates mean hepatic PAP-1 or DG acyltransferase (DGAT) activity in P8 WT and fld littermate mice. C, the graphs depict mean hepatic TG (left) or phosphatidylcholine and phosphatidylethanolamine (right) levels in P8 WT and fld mice (n = 4) as quantified by ESI-MS. *, p < 0.01 versus littermate WT mice.
Interestingly, lipin 1 is a soluble protein, and significant lipin 1 localization to the nucleus has also been demonstrated (1). Moreover, recent evidence suggests that lipin 1 functions as a regulator of gene transcription via protein-protein interactions with DNA-bound transcription factors (7, 8), including the peroxisome proliferator-activated receptor α (PPARα) and its coactivator protein PPARγ-coactivator 1α (PGC-1α) (7). PAP-1 catalytic activity is not required for peroxisome proliferator-activated receptor α coactivation, and these two molecular functions seem to be completely separable. Thus, lipin 1 is poised to play important roles in controlling the metabolism of fatty acids at multiple regulatory levels.
Given the role of lipin 1 as an enzyme in TG synthesis, the hepatic phenotype of fld mice is somewhat surprising. First, neonatal fld mice exhibit severe hepatic steatosis because of over-accumulation of TG (2). Second, although other tissues of fld mice are severely deficient in PAP-1 activity, the liver of adult fld mice retains significant Mg2+-dependent PAP activity (6, 9) and normal rates of TG synthesis (10). These findings suggest that other PAP-1 enzymes are active in liver. Based on sequence homology in signature N- and C-terminal domains, two additional lipin family proteins (lipin 2 and lipin 3) have been identified (1). Importantly, lipin 2 and 3 exhibit PAP-1 activity, although the relative activity and Vmax varies (lipin 1 > lipin 2 > lipin 3) (9). In the current study we further evaluated the hepatic phenotype of fld mice by using mass spectrometry-based lipidomic profiling of glycerophospholipid species and subsequently characterized the function and regulation of the liver-enriched PAP-1 protein, lipin 2.
EXPERIMENTAL PROCEDURES
Animal Studies—Breeding pairs of fld/+× fld/+ mice were used to generate fld/fld (fld), fld/+, and WT littermate mice. Liver tissue was collected from db/db (male; 10 weeks old) and ob/ob (female; 18 weeks old) obese mice, each with lean, sexmatched littermate controls. PGC-1α–/– mice have been previously described (11).
Short-term fasting studies were performed with individually housed male mice which were either food deprived for 36 h (beginning at 2000) or food deprived 24 h (beginning at 2000) and then given ad libitum access to standard rodent chow for 12 h. All animal experiments were approved by the Animal Studies Committee of Washington University School of Medicine.
Mammalian Cell Culture—HepG2 cells were maintained in DMEM, 10% fetal calf serum. Primary mouse hepatocytes were isolated from mice as previously described (12). Adenoviral transductions were carried out by incubating hepatocytes with adenoviruses in a 5% fetal bovine serum, DMEM medium overnight at an multiplicity of infection of 8. Endpoints were collected 24 h later in lipin 2 overexpression studies or 72 h later when using RNAi. TG synthesis rates were quantified by using [3H]glycerol as previously described (7, 12).
DNA Constructs—Full-length triple HA-tagged mouse lipin 2 was cloned into pCDNA3 expression construct, subcloned into the Ad-track cytomegalovirus vector, and recombined into the Ad-EASY system. The lipin 2 shRNA oligonucleotide was designed to target nucleotides 145–164 of the mouse Lpin2 transcript and was cloned into the Invitrogen pENTR vector (Invitrogen) and then subcloned into the Ad-EASY system. Adenoviral-driven shRNA construct targeted to LacZ was utilized as a control. The pSPORT-lipin 3 expression vector has been previously described (7).
siRNA Oligonucleotides and Transfection—A Silencer siRNA construction kit (Ambion, Austin, TX) was used to synthesize three siRNAs for mouse lipin 2 and a scrambled, nonspecific sequence siRNA (control). The targeted nucleotide cDNA sequence for the three lipin 2 siRNAs are AACTCTACAAGGGCATTAACC (siRNA 50), AACCCAAACCAGCTGCTAAAG (siRNA 1118), and AAAGGCTCTTGAGCCTGAAGT (siRNA 1215). The siRNAs were transfected onto primary hepatocytes using Lipofectamine 2000 (Invitrogen). Based on efficiency of knockdown (supplemental Fig. 1A), siRNA 1118 was chosen for all metabolic studies. Transfection was carried out after the hepatocytes were cultured for 3 h in 6-well plates, and a dosage of 100 pmol of siRNA/well was used. Experiments were carried out 60–72 h post-siRNA transfection.
Mass Spectrometric Lipid Analysis—The quantitative analyses of TG and phospholipid species have been described (13, 14). In brief, lipids were extracted from mouse liver using a modified Bligh and Dyer technique in the presence of internal standards for electrospray ionization-mass spectrometric (ESI-MS) analysis. Electrospray ionization mass spectrometric analyses were performed utilizing a TSQ Quantum Ultra Plus triple-quadrupole mass spectrometer (Thermo Fisher Scientific, San Jose, CA) equipped with an automated nanospray apparatus (Nanomate HD, Advion Bioscience Ltd., Ithaca, NY).
PAP-1 Activity—Phosphatidic acid phosphatase (PAP-1) activity was determined by using a modification of the method of Carman and Lin (15) to measure phosphate release from Triton X-100/phosphatidic acid mixed micelles. Labeled phosphatidic acid was purified by thin layer chromatography after using [γ-32P]ATP and Escherichia coli diacylglycerol kinase to phosphorylate 1,2-dioleoyl-sn-glycerol. Samples of cell or tissue extracts (10 μl) were added to reaction mixtures (100 μl) containing a final concentration of 2 mm Triton X-100, 10 mm β-mercaptoethanol, 0.2 mm [32P]phosphatidic acid (10,000 cpm/nmol), 50 mm Tris-maleate (pH 7.0), and either no added Mg2+ or 1.5 mm MgCl2. After 20 min at 30 °C the reactions were terminated by adding 0.5 ml of 0.1 n HCl in methanol. [32P]Phosphate was extracted by vigorous mixing after adding 1 ml of chloroform and 1 ml of 1 m MgCl2. The amount of soluble [32P] phosphate in 0.5 ml of the aqueous phase was measured by scintillation counting. Mg2+-dependent PAP activity (PAP-1) was determined by subtracting activity obtained in the absence of MgCl2 from activity measured in the presence of 1.5 mm MgCl2.
DG Acyltransferase Activity—Measurements of DG acyltransferase activity was carried out under apparent Vmax conditions for 10 min at room temperature in a final volume of 200 μl as described (16). Briefly, each assay reaction contained 50 μg of liver membrane proteins, 5 mm MgCl2, 1.25 mg/ml bovine serum albumin, 200 mm sucrose, 100 mm Tris-HCl (pH 7.4), 25 μm [14C]oleoyl-CoA (American Radiolabeled Chemicals; final specific radioactivity: 18,000 dpm/nmol), and 200 μm sn-1,2-dioleoylglycerol (Sigma). The acyl acceptor (sn-1,2-dioleoylglycerol) was introduced into the reaction mixture as a liposome, which was prepared by mixing with phosphatidylcholine in at a molar ratio of 1:5 in a chloroform solution followed by evaporating chloroform under a stream of N2 and resuspending liposomes in water. Each individual assay reaction was started by adding liver membrane proteins to the reaction mixture and terminated by adding 1.5 ml of chloroform/methanol (1:2.2, v/v) after a 10-min incubation period. Total lipids were extracted from this final mixture and separated on Linear-K Preadsorbent TLC plates (Waterman Inc., Clifton, NJ) with hexane/ethyl ether/acetic acid (80:20:1, v/v/v). The spots corresponding to TG was scraped from the TLC plates and determined for 14C radioactivity using a scintillation counter. Reaction mixtures in which liver membrane proteins were omitted were used as blanks for background correction.
Northern and Western Blotting Analyses—Northern blotting analyses were performed using radiolabeled cDNA probes. Full-length cDNAs for mouse lipin 2 and lipin 3 were excised from the pCDNA3-HA-lipin 2 or pSPORT-lipin 3 expression vectors by restriction digest, gel-purified, and then labeled with [32P]dCTP using Klenow enzyme. Unincorporated nucleotides were removed by using NucTrap Probe Purification Columns (Stratagene). Hybridizations were performed using Quickhyb (Stratagene) for 2 h at 65 °C. Blots were washed and then exposed to autoradiographic film.
Western blotting studies were performed using antibodies directed against the HA epitope tag (Covance), lipin 2 (see below), phosphoserine 106 lipin (6), lipin 3 (Alpha Diagnostic), adipophilin (ADRP; see below), liver fatty acid-binding protein (a gift of Nick Davidson), calnexin (Stressgen), acetylated histone H3 (Upstate Biotechnology), or actin (Sigma). Polyclonal antibodies for lipin 2 and ADRP were generated by Proteintech Group Inc. by injecting rabbits with the recombinant keyhole limpet hemocyanin-conjugated peptide FPESTTKVSKRERSDHHPRTA (lipin 2) or MAAAVVDPQQSVVMRVANLPLVSSTYDLC (ADRP). Lipin 2 and ADRP antibodies were affinity-purified using the immunizing peptide.
Quantitative Real-time Reverse Transcription-PCR—Real-time reverse transcription-PCR was performed using the ABI PRISM 7500 sequence detection system (Applied Biosystems, Foster City, CA) and the SYBR green kit. Arbitrary units of target mRNA were corrected by measuring the levels of 36B4 RNA. The sequence of the oligonucleotides used in quantitative reverse transcription-PCR analyses can be found in supplemental Table 1.
Metabolic Labeling Studies—Primary hepatocytes isolated from adult WT and fld mice were plated onto 12-well plates. Hepatocytes were infected with adenovirus to overexpress lipin 2 and cultured in complete culture media for 20–24 h. After this initial culture period, the hepatocytes were washed three times with phosphate-buffered saline and incubated in Met- and Cys-free DMEM for 1 h. For pulse-chase studies, the medium was replaced with 1 ml of Met- and Cys-free DMEM containing 250 μCi of 35S-Promix (530 MBq/ml; Amersham Biosciences) for 2 h. For pulse-only studies, labeled methionine was administered for 30 min. After this pulse period, the hepatocytes were chased in 1 ml of DMEM containing 10 mm unlabeled Met and 3 mm Cys (1000× excess) for the specified time periods. After the specified times, cells were lysed in an immunoprecipitation buffer (150 mm NaCl, 5 mm EDTA, 50 mm Tris (pH 7.4), 0.0625 m sucrose, 0.5% Triton X-100, and 0.5% sodium deoxycholate) containing a mixture of protease inhibitors (Roche Applied Science). The 35S-labeled lipin 2 and albumin proteins in the cell lysates were immunoprecipitated and quantified by SDS-PAGE analyses as described for the analysis of 35S-labeled apoB proteins (10).
Liver Protein Fractionation by Gradient Centrifugation—Two adult male C57BL/6 mice were fasted overnight (14 h) and then sacrificed for tissue collection. Whole, fresh liver tissue from both mice was finely minced with a razorblade and then pooled. Minced livers were transferred to a Teflon-piston glass homogenizer with 2 ml of fractionation buffer (0.25 m sucrose, 10 mm HEPES, 1 mm EDTA (pH 7.4)) and homogenized with 4 stokes at 240 rpm. The homogenate was centrifuged for 5 min at 1000 × g. The pellet containing the nuclei was resuspended in 1-ml fractionation buffer. The post-nuclear supernatant was layered onto a 10-ml linear 20–50% (w/w) sucrose gradient. The gradient was centrifuged for 3 h at 150,000 × g in a 14 × 89-mm tube. The floating fraction was recovered with a tube slicer. Twelve fractions were collected, and proteins were separated by SDS-PAGE. An equal volume of each fraction was loaded so that the quantity of protein varied as is noted in Fig. 3C.
FIGURE 3.
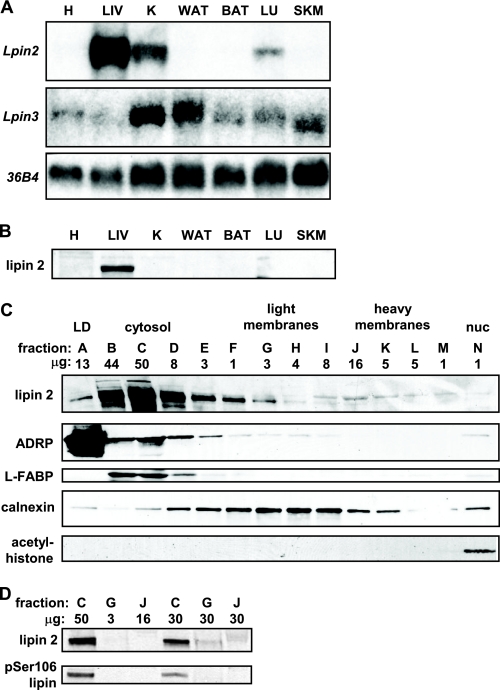
Lipin 2 is a hepatic-enriched lipin protein. A, the autoradiographs depict representative northern blots showing expression of Lpin2, Lpin3, or 36B4 (to control for loading) in WT mouse tissues (heart (H), liver (LIV), kidney (K), white adipose tissue (WAT), brown adipose tissue (BAT), lung (LU), skeletal muscle (SKM)). B, representative Western blots performed using a polyclonal antibody against lipin 2 and tissue lysates from WT mice are shown. C, the images depict results of Western blotting studies using hepatic lysates from WT mice fractionated by gradient centrifugation and probed with antibodies listed at left. LD, lipid droplet. The fractions are lettered alphabetically from the top to the bottom of the gradient. The gel was loaded by equal volumes, so the quantity of protein in each lane varies as is listed above each lane. L-FABP, liver fatty acid binding protein; nuc, nuclear. D, fractions C, G, and J from panel C were used in these Western blot studies. Each lane was loaded by volume (lanes 1–3) or by equal protein (lanes 4–6; 30 μg). Blots were then probed with antibodies against lipin 2 or phosphoserine 106 lipin.
Statistical Analyses—Statistical comparisons were made using analysis of variance or t tests. All data are presented as the means ± S.E., with a statistically significant difference defined as a p value <0.05.
RESULTS
Liver of fld Mice Exhibits Increased TG and Diminished PA Content—Despite the important role that lipin 1 plays in TG synthesis, livers of neonatal fld mice have a whitish appearance indicative of neutral lipid accumulation and contain very high levels of DG and TG (2, 17). Previous work has also demonstrated that hepatic PAP-1 activity is unchanged (9) or moderately decreased (6) in adult fld mice. However, PAP-1 activity in steatotic fld livers has not been assessed. We found that PAP-1 activity actually tended to be increased in post-natal day 8 (P8) fld mouse liver compared with littermate controls (Fig. 1B), confirming that this pathway is operative and that lipin 1 is not required for full PAP-1 activity. Hepatic DG acyltransferase activity was also unchanged in fld liver.
We next sought to analyze levels of hepatic lipid species downstream of lipin 1 in the Kennedy pathway by using ESI-MS. These analyses confirmed that total TG content was increased 20-fold in homozygous fld mouse liver at P8 compared with littermate control (WT) mice (Fig. 1C). The increase in TG content in fld mice was observed across all major TG species (supplemental Table 2). The content of other phospholipids derived from DG and, thus, downstream of PAP-1 (phosphatidylcholine, phosphatidylethanolamine, and phosphatidylserine (Fig. 1C and data not shown) were unchanged.
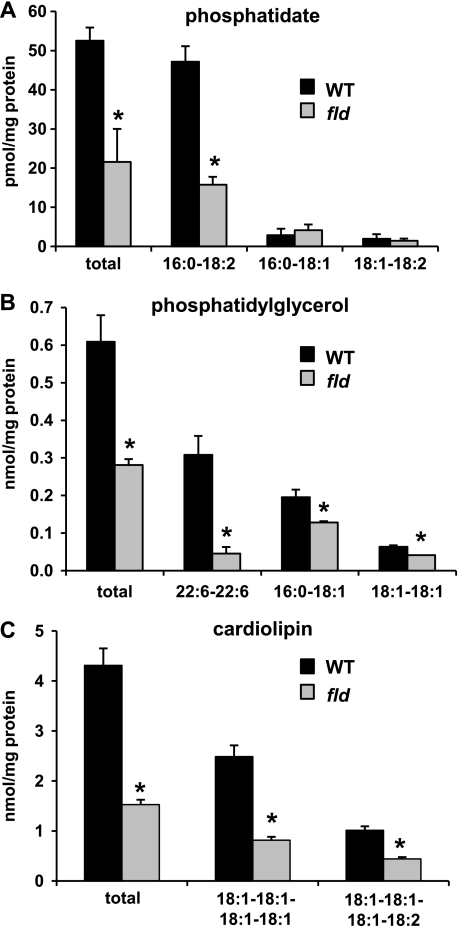
We next evaluated levels of lipid intermediates upstream of lipin 1 in the TG synthesis pathway. Surprisingly, the hepatic content of the PAP-1 substrate phosphatidic acid (PA) was markedly depleted in lipin 1-deficient livers (Fig. 2A). Phosphatidylglycerol (PG) levels were also significantly diminished in fld liver (Fig. 2B). This was due primarily to depletion of the most abundant PA and PG species (Fig. 2, A and B). Cardiolipin (CL), which is derived from PG, was also strikingly depleted in fld liver (Fig. 2C). PAP-1 activity is not required for the conversion of PA to PG or CL, and thus, depletion of these phospholipids is likely caused by diminished availability of PA. Conversely, phosphatidylinositol (PI) levels were unchanged between WT (4.18 ± 0.55 nmol/mg of protein) and fld (4.63 ± 0.49 nmol/mg of protein) mice.
FIGURE 2.
Diminished hepatic content of phosphatidate and its derivatives in fld liver. The graphs depict mean levels of phosphatidic acid (A), phosphatidylglycerol (B), and cardiolipin (C) in liver of P8 WT and fld littermate mice (n = 4) as quantified by ESI-MS. The x axis labels indicate the fatty acid chain length and degree of saturation of the fatty acid moieties of the glycerolipid. *, p < 0.01 versus littermate WT mice.
Lipin 2 Is a Hepatic-enriched Lipin Family Member—Given the preservation of PAP-1 activity in fld liver, we next sought to characterize the regulation and function of other lipin family proteins. Whereas expression of Lpin2 is quite high, the expression of Lpin3 mRNA was undetectable in liver by northern blotting analyses (Fig. 3A). When probed against mouse tissue lysates, antibodies raised against lipin 2 peptides detected a band in liver (Fig. 3B) that co-migrates with lipin 2 protein overexpressed via an adenovirus (data not shown). Other tissues that were examined were practically devoid of lipin 2 protein.
Lipin 1 is a soluble protein that can also be localized to the nucleus or associate with endoplasmic reticulum membranes (1, 6, 18). To determine the subcellular localization of lipin 2 in intact mouse liver, hepatic lysates were fractionated by sucrose gradient centrifugation (19). To reflect the absolute quantity of lipin 2 in the liver, the resulting fractions were loaded by volume so that the total protein loaded in each lane varied (as noted above the representative image in Fig. 3C). Lipin 2 localization was then evaluated by comparison with markers of the subcellular compartments including the lipid droplet (ADRP), soluble (liver fatty acid-binding protein), endoplasmic reticulum membrane (calnexin), and nuclear (acetylated histone H3) fractions. Small amounts of lipin 2 were detected in lipid droplet, endoplasmic reticulum membrane, and nuclear fractions (Fig. 3C). However, the majority of lipin 2 was detected in the soluble cytoplasmic fraction (Fig. 3C). This soluble fraction also contains the highest levels of lipin 2 protein when equal amounts of protein were loaded in each lane (Fig. 3D).
Similar to lipin 1 (6, 20), the lipin 2 band often appears as a doublet when well resolved, likely because of phosphorylation (18). The serine 106 residue of lipin 1 is a major site of phosphorylation (6), and the peptide sequence surrounding this site is conserved with lipin 2 (supplemental Fig. 1B). We confirmed that an antibody directed against phosphorylated serine 106 of lipin 1 also detected lipin 2 (supplemental Fig. 1B). Like lipin 1, the majority of phosphoserine 106 lipin 2 was detected in the soluble fraction of the liver lysates (Fig. 3D). Indeed, the majority of the phosphoserine 106 lipin 2 was found in the soluble fraction regardless of whether the gel was loaded for equal volume of the fractions or equal amounts of protein per lane (Fig. 3D). This suggests that under these conditions, the majority of lipin 2 protein is found in the cytoplasm but leaves open the possibility that, like lipin 1 (6), lipin 2 might translocate intracellularly in response to post-translational modification.
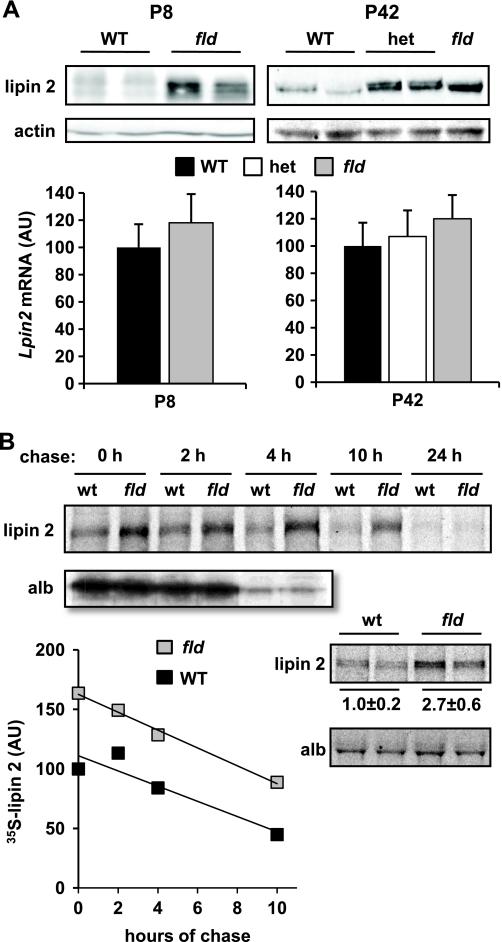
Lipin 2 Protein Is Increased in fld Mouse Liver via a Post-transcriptional Mechanism—Consistent with previous work (9, 10), Lpin2 mRNA expression was not changed in liver of P8 or P42 fld mice compared with littermate controls (Fig. 4A). However, lipin 2 protein content was increased severalfold in fld mice of either age (Fig. 4A). Moreover, at P42, loss of a single Lpin1 allele resulted in a significant increase in lipin 2 protein without affecting Lpin2 mRNA levels. The increase in lipin 2 protein levels in primary hepatocytes from fld mice is also preserved after several days in culture (data not shown). These data suggest that lipin 2 protein content is increased in fld liver independent of changes in steady-state Lpin2 mRNA levels.
FIGURE 4.
Rates of lipin 2 synthesis are induced in liver of fld mice. A, representative Western blots showing expression of lipin 2 and actin protein in hepatic lysates of WT, heterozygous, and fld mice at P8 and P42 are shown. The graphs below represent mean expression of Lpin2 mRNA in same mice. AU, arbitrary units. B, autoradiographs are representative of pulse-chase studies conducted with hepatocytes from WT or fld mice. Metabolic labeling and immunoprecipitation were performed as described under “Experimental Procedures.” The top image depicts radiolabeled lipin 2 or albumin at various times after chasing with unlabeled methionine. The intensity of the bands was quantified, normalized to protein, and the average of three experiments is plotted in the graph at the bottom. The lower autoradiograph depicts radiolabeled lipin 2 or albumin after a 30-min pulse with [35S]methionine. Quantification of the lipin 2 band intensity (normalized arbitrary units ± S.E.) is inset just under the autoradiograph.
We, therefore, sought to evaluate lipin 2 synthesis rates and turnover in pulse-chase experiments using metabolic labeling with [35S]methionine. As shown in Fig. 4B, the rate of disappearance of 35S-labeled lipin 2 was equal in hepatocytes isolated from WT and fld mice. However, the rate of lipin 2 synthesis in 30-min metabolic labeling studies (lower autoradiographs in Fig. 4B) was increased in fld hepatocytes, suggesting that the disconnect between mRNA and protein is due to increased rates of translation.
Lipin 2 Is Dynamically Regulated in Liver but Is Not a Target Gene of PGC-1α—The hepatic expression of Lpin1 is dramatically increased by 24 h of fasting (7). Similarly, both lipin 2 mRNA and protein expression were significantly induced by food deprivation (Fig. 5A), suggesting that lipin 2 levels are also under transcriptional control. Our original interest in lipin 1 stemmed from the finding that the fasting-induced increase in Lpin1 expression required an intact PGC-1α pathway in liver (7). However, hepatic Lpin2 expression was induced equally in WT and PGC-1α-deficient mice (Fig. 5B). Moreover, although Lpin1 expression is robustly activated by PGC-1α overexpression in hepatocytes, Lpin2 mRNA and lipin 2 protein were not changed after PGC-1α overexpression (Fig. 5C). Thus, the regulatory circuits that govern hepatic Lpin1 and Lpin2 expression are notably divergent.
FIGURE 5.
Lpin2 gene expression is increased by food deprivation but is not a target of PGC-1α. A, the graph represents mean hepatic expression of Lpin1 or Lpin2 in fasted or re-fed mice. *, p < 0.05 versus fasted control. Inset at top, representative Western blots showing expression of lipin 2 and actin protein. AU, arbitrary units. B, the graph represents mean hepatic expression of Lpin2 in fasted or re-fed WT or PGC-1α–/– mice. *, p < 0.01 versus fasted control. C, the graph represents mean expression of Lpin1 or Lpin2 in primary hepatocytes overexpressing PGC-1α and/or green fluorescent protein (GFP, control) as quantified by quantitative reverse transcription-PCR 48 h after infection. *, p < 0.01 versus green fluorescent protein control. Inset at top, representative Western blots showing expression of lipin 2 and PGC-1α protein.
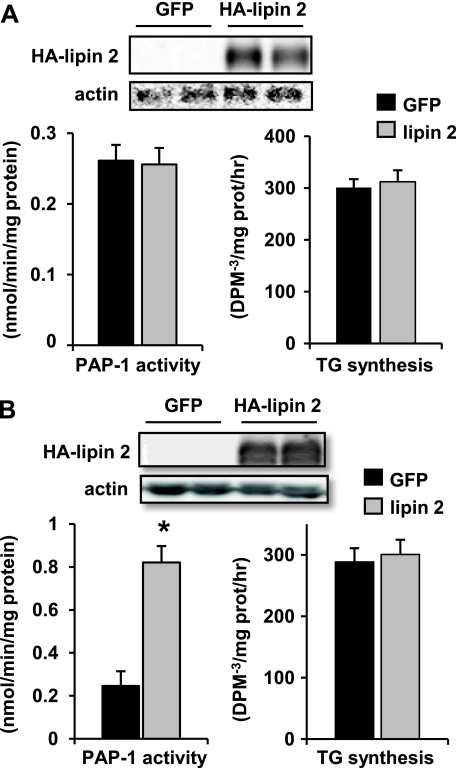
Lipin 2 Is an Important PAP-1 Enzyme in Liver—To evaluate the effects of lipin 2 on cellular PAP-1 activity, primary mouse hepatocytes were infected with an adenoviral vector to overexpress lipin 2. Lipin 2 adenovirus affected neither PAP-1 activity nor TG synthesis rates in hepatocytes (Fig. 6A). When HepG2 cells, which express little endogenous lipin 2, were infected with lipin 2 adenovirus, PAP-1 activity was robustly increased (Fig. 6B). However, this was also not sufficient to force an increase in TG synthesis rates, as assessed using [3H]glycerol as a tracer (Fig. 6B). Although we preferred to evaluate the metabolic effects of lipin 2 in bona fide hepatocytes, the high endogenous expression of lipin 2 and the regulated control of PAP-1 activity seem to preclude the interpretation of studies employing a gain-of-function approach in this cell type.
FIGURE 6.
Lipin 2 overexpression increases PAP-1 activity in HepG2 cells. The graphs depict mean PAP-1 activity (left) or rates of TG synthesis (right) in primary hepatocytes (A) and HepG2 cells (B) infected with adenovirus overexpressing HA-lipin 2 and/or green fluorescent protein (GFP). Rates of TG synthesis were determined in the presence of 0.3 mm bovine serum albumin-conjugated oleate. Representative Western blots using antibodies against HA epitope tag of lipin 2 or actin and lysates used for PAP-1 assays are inset at the top. *, p < 0.05 versus green fluorescent protein control.
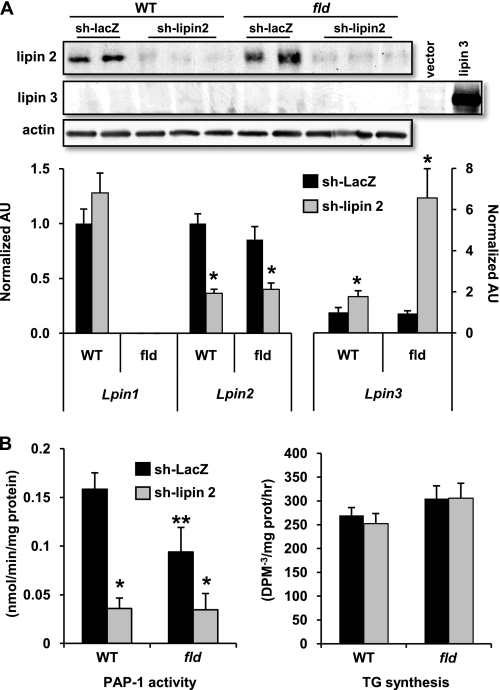
We, therefore, developed an adenovirus expressing lipin 2 shRNA, which markedly reduced lipin 2 protein in primary hepatocytes (Fig. 7A). Interestingly, lipin 2 knockdown led to a compensatory increase in Lpin3 mRNA expression, especially in fld hepatocytes (Fig. 7A). However, lipin 3 protein levels remained undetectable by Western blotting, and lipin 2 shRNA treatment significantly reduced hepatocyte PAP-1 activity in both WT and fld hepatocytes (Fig. 7B). Despite a marked decrease in PAP-1 activity, rates of TG synthesis were not significantly affected by lipin 2 knockdown in either genetic context (Fig. 7B). These findings suggest that even very low PAP-1 activity is sufficient for normal TG synthesis in hepatocytes under basal conditions.
FIGURE 7.
Loss of lipin 2 markedly impairs hepatocyte PAP-1 activity but does not affect basal rates of TG synthesis. A, the autoradiographs inset at top depict representative Western blots showing expression of lipin 2, lipin 3, or actin protein in hepatocytes from WT or fld mice infected with adenovirus driving expression of shRNA targeting lipin 2 or LacZ (control). As a positive control for the lipin 3 Western blot, HepG2 cells were transfected with expression vector for lipin 3 or empty vector control. The graphs below depict mean expression of lipin 1, 2, or 3 mRNA in same cells. *, p < 0.05 versus LacZ control. AU, arbitrary units. B, graphs depict mean PAP-1 activity (left) or rates of TG synthesis (right) in hepatocytes from WT or fld mice infected with lipin 2 shRNA or control shRNA (against LacZ). p < 0.05 versus LacZ control (*) and p < 0.05 versus WT infected with LacZ shRNA (**).
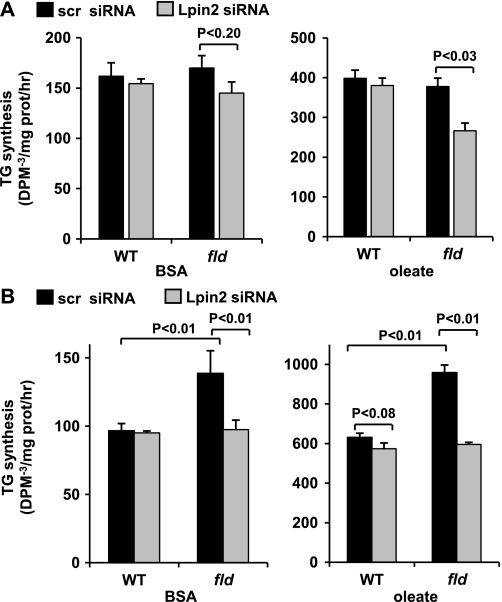
Given these surprising findings, we sought to evaluate the effects of lipin 2 knockdown in the context of increased fatty acid availability, which is a potent stimulus to induce TG synthesis. Due to concerns regarding potential increased sensitivity of steatotic hepatocytes to the toxic effects of adenovirus infection, we performed these experiments using siRNA oligonucleotide transfection. Lipin 2 or scrambled control siRNA were transfected into freshly isolated hepatocytes from P42 WT and fld mice. Again, lipin 2 knockdown led to a dramatic decrease in lipin 2 protein (supplemental Fig. 1A) and a marked diminution in hepatocyte PAP-1 activity (data not shown). Nonetheless, basal rates of TG synthesis were unchanged by lipin 2 siRNA even in fld hepatocytes (Fig. 8A). We, therefore, stimulated hepatocytes with oleic acid (0.5 mm) for 30 min before quantifying TG synthesis. As expected, oleate supplementation increased TG synthesis rates (note the difference in scale between the left- and right-hand graphs). In the context of exogenous oleate, lipin 1 deficiency combined with lipin 2 knockdown significantly suppressed TG synthesis rates (Fig. 8A), suggesting that PAP-1 activity had become rate-limiting.
FIGURE 8.
Lipin 2 knockdown abrogates TG synthesis under conditions of increased fatty acid availability. Graphs depict mean rates of TG synthesis under basal (bovine serum albumin with no additional fatty acids; left graph) or oleate-stimulated (0.5 mm for 30 min; right graph) conditions using hepatocytes isolated from WT or fld mice at postnatal day 42 (A) or day 14 (B). Significant differences between groups are as noted. BSA, bovine serum albumin.
We also probed the effects of lipin 2 knockdown in hepatocytes from P14 fld mice, which have increased cellular lipid levels and elevated rates of TG synthesis even without exogenous oleate (10). Lipin 2 siRNA administration led to a significant suppression of TG synthesis rates to levels observed in WT hepatocytes at base line and after oleate stimulation (Fig. 8B). Lipin 2 siRNA also tended to reduce TG synthesis rates after oleate treatment in WT hepatocytes of this younger age.
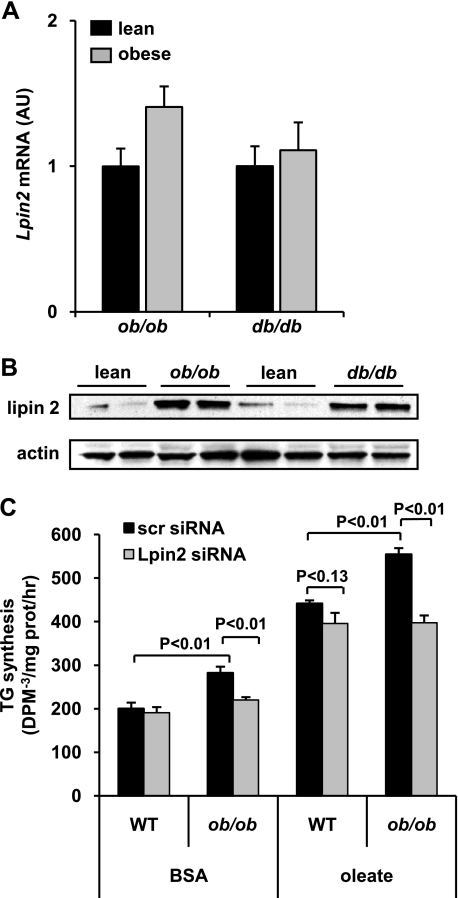
Increased Hepatic Expression of Lipin 2 Plays a Role in Increased Hepatic TG Synthesis Rates in ob/ob Mice—Given that lipin 2 knockdown impaired TG synthesis rates in response to increased fatty acid availability, we evaluated the role of lipin 2 in controlling TG synthesis in steatotic ob/ob hepatocytes. We found that the expression of Lpin2 mRNA was not induced in db/db and ob/ob mice compared with littermate controls (Fig. 9A). However, Western blotting analyses revealed a striking increase in lipin 2 protein levels in both obese mouse models compared with littermate lean controls (Fig. 9B). This again implicates post-transcriptional control of lipin 2 levels as an important means to influence lipin 2 activity.
FIGURE 9.
Lipin 2 is induced by obesity-related diabetes. A, the graph depicts mean expression of Lpin2 in liver of ob/ob, db/db, or matched littermate lean control mice. B, representative Western blots showing expression of lipin 2 and actin protein in the same mice. C, the graph depicts mean rates of TG synthesis under basal (bovine serum albumin (BSA) with no additional fatty acids) or oleate-stimulated (0.5 mm for 30 min) conditions using hepatocytes isolated from WT or ob/ob mice.
Hepatocytes from WT and ob/ob mice were then isolated and treated with lipin 2 siRNA to determine the effects of lipin 2 on hepatic TG synthesis. Interestingly, lipin 2 knockdown suppressed rates of TG synthesis in ob/ob hepatocytes to levels comparable with WT controls (Fig. 9C). Moreover, the oleatestimulated increase in TG synthesis in ob/ob hepatocytes was markedly blunted. These data collectively suggest that the increase in lipin 2 levels observed in ob/ob mice serves to boost the capacity for TG synthesis.
DISCUSSION
Lipin 1 is the first member of a family of Mg2+-dependent PA phosphohydrolase enzymes that catalyze the penultimate step in TG synthesis (5). Essentially no PAP-1 activity is detected in adipose tissue, muscle, and heart of lipin 1-deficient fld mice (6). However, liver of adult fld mice exhibits substantial hepatic PAP-1 activity (6, 9). Herein we found that hepatic PAP-1 activity was not altered in liver of neonatal fld mice, which have profound hepatic TG over-accumulation. It is likely that the high expression of lipin 2 in liver and the lack of expression of other lipins in striated muscle and adipose tissue may explain these tissue-specific differences. Indeed, lipin 2 is enriched in liver, which seems to be the primary site of its expression. Moreover, lipin 2 protein levels were increased in liver of both 8-day-old and adult fld mice compared with littermate controls, suggesting that lipin 2 is up-regulated to compensate for lipin 1 deficiency. Finally, RNAi studies demonstrated that lipin 2 knockdown caused a marked reduction in PAP-1 activity in both WT and fld cells and indicate that lipin 2 is an important PAP-1 enzyme in hepatocytes.
These data sharply contrast recent findings using lipin 2 shRNA in HeLa cells (18). In that study lipin 2 knockdown actually led to increased PAP-1 activity due to a compensatory induction of lipin 1 mRNA and protein. Although there is no obvious explanation for these differences, the relative importance of lipin 1 and 2 as PAP-1 enzymes is clearly cell type-specific. Additionally, our lipin 2 shRNA data also suggest that lipin 3 does not play a significant role as a PAP-1 enzyme in liver. Previous studies suggested that Lpin3 expression is elevated in fld liver and could compensate for lack of lipin 1 (9). In this study Lpin3 mRNA was also significantly induced by lipin 2 knockdown, especially in fld hepatocytes. However, the absolute expression of lipin 3 remains very low, as mRNA and protein were undetectable by Northern blot and Western blotting even after lipin 2 knockdown. When taken with the low specific activity of lipin 3 (9), its role as a PAP-1 enzyme in liver is probably minimal. However, PAP-1 activity was not completely abolished by combined lipin 1 deficiency with lipin 2 knock-down. The remaining activity is likely due to 1) residual lipin 2 protein content, 2) the actions of lipin 3, or 3) the presence of other PAP-1 enzymes that have not yet been identified.
Conversely, lipin 2 overexpression was not sufficient to increase PAP-1 activity in primary hepatocytes. The activity of lipin proteins seems to be highly regulated by compartmentalization and/or post-translational modification (6, 18). It is likely that these factors limit PAP-1 activity in hepatocytes. However, in HepG2 cells lipin 2 overexpression caused a robust increase in PAP-1 activity. It is worth noting that HepG2 cells express little endogenous lipin 2, whereas hepatocytes express an abundance of this protein. Nonetheless, lipin 2 overexpression did not stimulate TG synthesis in HepG2 cells despite a 4-fold increase in PAP-1 activity. Also, marked reductions in hepatocyte PAP-1 activity did not affect rates of TG synthesis under basal conditions, even in fld hepatocytes. This residual activity seems to be sufficient for normal TG synthesis under these conditions. It is generally accepted that the glycerol-3-phosphate acyltransferase step in this pathway is rate-limiting for TG synthesis (21), and our data are consistent with this.
As evidenced by experiments with adult fld mice or adenovirus overexpression, increased lipin 2 expression per se does not drive TG synthesis or accumulation. It is likely that lipin 2 up-regulation in neonate fld mice is not the primary driving force for hepatic steatosis. Rather, fatty acid availability strongly impacts triglyceride synthesis rates, and increased supply of lipid to the liver secondary to lipodystrophy and/or high dietary fat content is probably the primary stimulus. Consistent with this, the hyperlipidemia and fatty liver phenotypes of fld mice coincidentally occur and resolve (2). Lipin 2 up-regulation likely plays a permissive role by increasing the capacity for TG synthesis stimulated by high fatty acid availability. When hepatocytes were challenged with high levels of endogenous or exogenous fatty acids, we unveiled the latent phenotype elicited by loss of lipin 2 and demonstrated significant reductions in rates of TG synthesis. Although obesity is at the other end of the phenotypic spectrum from lipodystrophy, obese mouse models also have high circulating lipid levels as well as increased hepatic lipin 2. Our findings suggest that lipin 2 is also involved in the increased rates of TG synthesis in obese hepatocytes as well. Further experiments are warranted to determine whether chronic suppression of lipin 2 in obese liver would show efficacy at reducing hepatic steatosis.
The fatty liver of fld mice is a metabolic signature of this model. Previous work has shown that the hepatic content of DG and TG is significantly increased in these mice (2, 17). We explored the hepatic lipid profile of these mice further by using ESI-MS analysis with the hypothesis that the substrate of lipin 1, phosphatidic acid, would accumulate in these livers. Most surprisingly, PA was markedly depleted in liver of fld mice. This contrasts a recent report that PA accumulates in the endoneurium of fld mice (22). Lipin 2 does not seem to be expressed in the endoneural compartment, and it is possible that this somehow explains the observed differences. In addition, ESI-MS analyses demonstrated that phosphatidylglycerol and cardiolipin, which are derived from PA, were also depleted in fld liver. Cardiolipin is a critical component of the mitochondrial membrane (23), and abnormalities in cardiolipin synthesis and remodeling cause mitochondrial dysfunction in several genetic models (24, 25). It is tempting to speculate that cardiolipin deficiency contributes to impairments in mitochondrial fatty acid oxidation in hepatocytes from neonatal fld mice (3) and potentially exacerbates hepatic steatosis in this model.
We also demonstrate herein that the regulatory circuits that control the expression of Lpin1 and Lpin2 are significantly divergent. Although both genes are induced by acute food deprivation (Fig. 5 and Ref. 26), the induction of Lpin1 required the presence of the PGC-1α coactivator (7), whereas Lpin2 does not. This fits with data indicating that steady-state Lpin2 mRNA levels are not affected by glucocorticoids (26)3 or diabetes (Fig. 9), which cause a marked increase in hepatic PGC-1α expression (27, 28). Our previous work showed that one of the biological consequences of lipin 1 activation by PGC-1α during food deprivation was to feed-forward and enhance PGC-1α activity as a transcriptional coactivator (7). It remains to be determined whether lipin 2 also acts in the nucleus as a transcriptional regulatory protein and a component of the PGC-1 complex bound to chromatin in the nucleus.
Finally, we also determined that lipin 2 protein content was highly regulated independent of changes in steady-state mRNA levels. In fld mice, lipin 2 protein levels were increased, whereas Lpin2 expression was not. This feature of lipin 2 regulation was not unique to fld mice, as ob/ob and db/db mice also exhibit increased lipin 2 protein independent of changes in Lpin2 mRNA. The results of subsequent metabolic labeling studies indicate that increases in steady-state lipin 2 protein levels are mediated via increased rates of lipin 2 translation rather than enhanced protein stability. Translational control of lipin 2 is likely an important regulatory nodal point, and quantification of protein levels will be crucial for complete interpretation of future results.
Summary—The absence of lipin 1 results in a surprising hepatic phenotype that is likely explained at least in part by a compensatory activation of the liver-enriched lipin family member, lipin 2. The studies herein demonstrate that lipin 2 is an important hepatic PAP-1 enzyme that is under the control of unique regulatory mechanisms. Given recent evidence that genetic variations or mutations in the human gene encoding lipin 2 are linked to the development of diabetes (29) and a rare inflammatory bone disease (30, 31), further work will be needed to define the full spectrum of metabolic pathways regulated by lipin 2 and to understand the molecular mechanisms that control lipin 2 activity.
Supplementary Material
This work was supported, in whole or in part, by National Institutes of Health Grant R01 DK078187 (to B. N. F.), R01 HL73939 (to Z. C.), R01s DK52753 and DK28312 (to J. C. Lawrence, Jr. (deceased)), and P01 HL57278 (to R. W. G. and X. H.). This work was also supported, in part, by the Digestive Diseases Research Core Center (National Institutes of Health Grant P30 DK52574) and the Clinical Nutrition Research Unit Core Center (National Institutes of Health Grant P30 DK56341) at the Washington University School of Medicine. The costs of publication of this article were defrayed in part by the payment of page charges. This article must therefore be hereby marked “advertisement” in accordance with 18 U.S.C. Section 1734 solely to indicate this fact.
The on-line version of this article (available at http://www.jbc.org) contains supplemental Tables 1 and 2 and Fig. 1.
Footnotes
The abbreviations used are: PAP-1, phosphatidic acid (PA) phosphohydrolase; PGC-1α, peroxisome proliferator-activated receptor α coactivator 1α; ADRP, adipophilin; P-, post-natal day; ESI-MS, electrospray ionization mass spectrometry; DG, diacylglycerol; TG, triglyceride; WT, wild type; DMEM, Dulbecco's modified Eagle's medium; HA, hemagglutinin; shRNA, short hairpin RNA; siRNA, small interfering RNA; PG, phosphatidylglycerol; CL, cardiolipin; PI, phosphatidylinositol.
M. C. Gropler and B. N. Finck, unpublished observations.
References
- 1.Peterfy, M., Phan, J., Xu, P., and Reue, K. (2001) Nat. Genet. 27 121–124 [DOI] [PubMed] [Google Scholar]
- 2.Langner, C. A., Birkenmeier, E. H., Ben-Zeev, O., Schotz, M. C., Sweet, H. O., Davisson, M. T., and Gordon, J. I. (1989) J. Biol. Chem. 264 7994–8003 [PubMed] [Google Scholar]
- 3.Rehnmark, S., Giometti, C. S., Slavin, B. G., Doolittle, M. H., and Reue, K. (1998) J. Lipid Res. 39 2209–2217 [PubMed] [Google Scholar]
- 4.Reue, K., Xu, P., Wang, X. P., and Slavin, B. G. (2000) J. Lipid Res. 41 1067–1076 [PubMed] [Google Scholar]
- 5.Han, G. S., Wu, W. I., and Carman, G. M. (2006) J. Biol. Chem. 281 9210–9218 [DOI] [PMC free article] [PubMed] [Google Scholar]
- 6.Harris, T. E., Huffman, T. A., Chi, A., Shabanowitz, J., Hunt, D. F., Kumar, A., and Lawrence, J. C., Jr. (2007) J. Biol. Chem. 282 277–286 [DOI] [PubMed] [Google Scholar]
- 7.Finck, B. N., Gropler, M. C., Chen, Z., Leone, T. C., Croce, M. A., Harris, T. E., Lawrence, J. C., Jr., and Kelly, D. P. (2006) Cell Metab. 4 199–210 [DOI] [PubMed] [Google Scholar]
- 8.Santos-Rosa, H., Leung, J., Grimsey, N., Peak-Chew, S., and Siniossoglou, S. (2005) EMBO J. 24 1931–1941 [DOI] [PMC free article] [PubMed] [Google Scholar]
- 9.Donkor, J., Sariahmetoglu, M., Dewald, J., Brindley, D. N., and Reue, K. (2007) J. Biol. Chem. 282 3450–3457 [DOI] [PubMed] [Google Scholar]
- 10.Chen, Z., Gropler, M. C., Norris, J., Lawrence, J. C., Jr., Harris, T. E., and Finck, B. N. (2008) Arterioscler. Thromb. Vasc. Biol. 28 1738–1744 [DOI] [PMC free article] [PubMed] [Google Scholar]
- 11.Leone, T. C., Lehman, J. J., Finck, B. N., Schaeffer, P. J., Wende, A. R., Boudina, S., Courtois, M., Wozniak, D. F., Sambandam, N., Bernal-Mizrachi, C., Chen, Z., Holloszy, J. O., Medeiros, D. M., Schmidt, R. E., Saffitz, J. E., Abel, E. D., Semenkovich, C. F., and Kelly, D. P. (2005) PLoS Biol. 3 e101. [DOI] [PMC free article] [PubMed] [Google Scholar]
- 12.Chen, Z., Fitzgerald, R. L., Averna, M. R., and Schonfeld, G. (2000) J. Biol. Chem. 275 32807–32815 [DOI] [PubMed] [Google Scholar]
- 13.Han, X., and Gross, R. W. (2001) Anal. Biochem. 295 88–100 [DOI] [PubMed] [Google Scholar]
- 14.Han, X., Yang, J., Cheng, H., Ye, H., and Gross, R. W. (2004) Anal. Biochem. 330 317–331 [DOI] [PubMed] [Google Scholar]
- 15.Carman, G. M., and Lin, Y. P. (1991) Methods Enzymol. 197 548–553 [DOI] [PubMed] [Google Scholar]
- 16.Mostafa, N., Bhat, B. G., and Coleman, R. A. (1993) Biochim. Biophys. Acta 1169 189–195 [DOI] [PubMed] [Google Scholar]
- 17.Reue, K., and Doolittle, M. H. (1996) J. Lipid Res. 37 1387–1405 [PubMed] [Google Scholar]
- 18.Grimsey, N., Han, G. S., O'Hara, L., Rochford, J. J., Carman, G. M., and Siniossoglou, S. (2008) J. Biol. Chem. 283 29166–29174 [DOI] [PMC free article] [PubMed] [Google Scholar]
- 19.Wolins, N. E., Quaynor, B. K., Skinner, J. R., Tzekov, A., Croce, M. A., Gropler, M. C., Varma, V., Yao-Borengasser, A., Rasouli, N., Kern, P. A., Finck, B. N., and Bickel, P. E. (2006) Diabetes 55 3418–3428 [DOI] [PubMed] [Google Scholar]
- 20.Huffman, T. A., Mothe-Satney, I., and Lawrence, J. C., Jr. (2002) Proc. Natl. Acad. Sci. U. S. A. 99 1047–1052 [DOI] [PMC free article] [PubMed] [Google Scholar]
- 21.Gonzalez-Baro, M. R., Lewin, T. M., and Coleman, R. A. (2007) Am. J. Physiol. 292 G1195–G1199 [DOI] [PMC free article] [PubMed] [Google Scholar]
- 22.Nadra, K., Charles, A. S., Medard, J. J., Hendriks, W. T., Han, G. S., Gres, S., Carman, G. M., Saulnier-Blache, J. S., Verheijen, M. H., and Chrast, R. (2008) Genes Dev. 22 1647–1661 [DOI] [PMC free article] [PubMed] [Google Scholar]
- 23.Mileykovskaya, E., Zhang, M., and Dowhan, W. (2005) Biochemistry 70 154–158 [DOI] [PubMed] [Google Scholar]
- 24.Schlame, M., and Ren, M. (2006) FEBS Lett. 580 5450–5455 [DOI] [PubMed] [Google Scholar]
- 25.Chicco, A. J., and Sparagna, G. C. (2007) Am. J. Physiol. Cell Physiol. 292 33–44 [DOI] [PubMed] [Google Scholar]
- 26.Manmontri, B., Sariahmetoglu, M., Donkor, J., Khalil, M. B., Sundaram, M., Yao, Z., Reue, K., Lehner, R., and Brindley, D. N. (2008) J. Lipid Res. 49 1056–1067 [DOI] [PMC free article] [PubMed] [Google Scholar]
- 27.Herzig, S., Long, F., Jhala, U. S., Hedrick, S., Quinn, R., Bauer, A., Rudolph, D., Schutz, G., Yoon, C., Puigserver, P., Spiegelman, B., and Montminy, M. (2001) Nature 413 179–183 [DOI] [PubMed] [Google Scholar]
- 28.Yoon, J. C., Puigserver, P., Chen, G., Donovan, J., Wu, Z., Rhee, J., Adelmant, G., Stafford, J., Kahn, C. R., Granner, D. K., Newgard, C. B., and Spiegelman, B. M. (2001) Nature 413 131–138 [DOI] [PubMed] [Google Scholar]
- 29.Aulchenko, Y. S., Pullen, J., Kloosterman, W. P., Yazdanpanah, M., Hofman, A., Vaessen, N., Snijders, P. J., Zubakov, D., Mackay, I., Olavesen, M., Sidhu, B., Smith, V. E., Carey, A., Berezikov, E., Uitterlinden, A. G., Plasterk, R. H., Oostra, B. A., and van Duijn, C. M. (2007) Diabetes 56 3020–3026 [DOI] [PubMed] [Google Scholar]
- 30.Ferguson, P. J., Chen, S., Tayeh, M. K., Ochoa, L., Leal, S. M., Pelet, A., Munnich, A., Lyonnet, S., Majeed, H. A., and El-Shanti, H. (2005) J. Med. Genet 42 551–557 [DOI] [PMC free article] [PubMed] [Google Scholar]
- 31.Al-Mosawi, Z. S., Al-Saad, K. K., Ijadi-Maghsoodi, R., El-Shanti, H. I., and Ferguson, P. J. (2007) Arthritis Rheum. 56 960–964 [DOI] [PubMed] [Google Scholar]
Associated Data
This section collects any data citations, data availability statements, or supplementary materials included in this article.


