

Abstract
We have undertaken a structural assessment of Streptococcus pneumoniae 11A polysaccharide as well as two clinical isolates related to 11A. The clinical isolates were labeled 11Aα and 11Aβ. The result of our experiments is a revision to the old structure for S. pneumoniae 11A polysaccharide. The new structure differs from the old structure in both the primary connectivities and acetylation pattern. We also show that 11A contains an acetylglycerol-PO4 moiety, a substitution that is heretofore unknown in the bacterial polysaccharide literature. The two clinical isolates were also structurally characterized. 11Aα was determined to be identical to 11A. 11Aβ is a new serotype, which differs from 11A in the absence of the acetylation of the glycerol-PO4 moiety and a different acetylation pattern of the saccharides. Thus, we propose that the acetylglycerol is the structural basis for 11Aα and 11Aβ subtypes.
The polysaccharide (PS)2 capsule of Streptococcus pneumoniae is recognized as the most important virulence factor of pneumococci. It is expressed by almost all pathogenic pneumococci and has been shown to increase the virulence of a pneumococcal strain by more than a million-fold in an animal model system (1). The capsule shields pneumococci from the host phagocytes, and its shielding capacity can be neutralized when the host produces antibodies to the capsule and to fix complement on pneumococci. Thus, the capsular PS is used as the antigen in all pneumococcal vaccines that are clinically used. Because of their impact on human health, pneumococcal capsules have been extensively investigated both serologically, genetically, and biochemically. Many years of serological studies have identified 91 serologically distinct capsule types (2, 3). Recently, the nucleotide sequences of the capsule gene loci of all 91 different capsule types have been determined (4, 5).
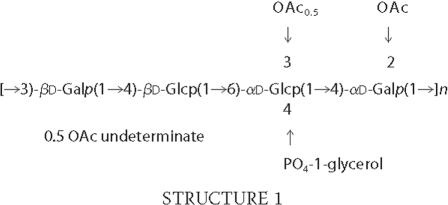
With the use of monoclonal antibodies, serologic heterogeneity was noted recently among pneumococcal isolates that were typed as 11A using the quellung reaction (6). To avoid confusion, we have provisionally named the common variant 11Aα and the less common variant 11Aβ. Because 11A PS is a component of the 23-valent pneumococcal PS vaccine (7), it is important to understand the chemical basis of the serological heterogeneity among pneumococci that are typed as serotype 11A. However, there is only limited information on structure of pneumococcal serotype 11A PS, and the structure has not been examined with modern tools. Forty years ago, the structural model for S. pneumoniae serotype 11A PS was proposed to be a linear polymer containing d-glucose, d-galactose, glycerol, phosphate, and O-acetyl groups in the molar ratio of 2:2:1:1:2 based upon analysis of chemically modified PS (8). About 20 years ago, Richards et al. (9, 10) proposed the model for 11A PS based on both NMR and chemical degradation studies. They proposed a linear repeating unit structure with four monosaccharides, a pendant glycerol phosphate moiety, and 2 mol of acetate as described in Structure 1,
To explain the serological heterogeneity among the pneumococcal isolates expressing 11A serotype, we investigated the 11A PS structure using three preparations of capsular PS (11A PS commercially available from ATCC, 11Aα PS purified from an 11Aα strain of pneumococcus, and 11Aβ PS purified from an 11Aβ strain) and modern NMR equipment and methods. Modern NMR equipment, such as cryogenically cooled probes (11), allows the acquisition of heteronuclear data on samples of PSs using 13C at natural abundance at reasonable concentrations (5 mg/ml PS) in a reasonable amount of time (∼6 h for an 1H-13C HSQC). Modern pulse sequences such as HSQC-TOCSY and HMBC are also extremely useful for the assignment of the HSQC spectrum as these experiments correlate heteronuclear spins in a given residue (HSQC-TOCSY and HMBC) or across glycosidic linkages (HMBC).
EXPERIMENTAL PROCEDURES
Preparation of Capsular PS—Purified 11A PS was purchased from ATCC (Manassas, VA). 11Aα and 11Aβ PSs were purified as described below from pneumococcal strains 3054-06 and 3455-06, which express serotypes 11Aα and 11Aβ, respectively (6). Pneumococci were grown overnight at 37 °C in 4 liters of a chemically defined medium (JRH Biosciences, Lenexa, KS) (12) supplemented with choline chloride (1 g/liter), sodium bicarbonate (2.5 g/liter), and cysteine-HCl (0.73 g/liter). Pneumococcal lysate was obtained by adding deoxycholate (0.05%) to the medium and removing the cell debris by centrifugation. Crude PS was obtained from the lysate by selective ethanol precipitation, i.e. discarding the material precipitating at 50% ethanol and harvesting the material precipitating at 70% ethanol. The crude PS was dissolved in 120 ml of 0.2 m NaCl and dialyzed in 10 mm Tris-HCl (pH 7.4). The crude PS was then loaded onto a column (10 × 2.5 cm) containing DEAE-Sepharose (Amersham Biosciences), and PS was eluted with a linear gradient of NaCl from 0 to 2 m. The resulting fractions were tested for the presence of 11Aα or 11Aβ PS with the inhibition assay described below. The PS-containing fractions were pooled, dialyzed, and lyophilized. The lyophilized PS was dissolved in water (10 mg/ml), and 20-30 mg of PS was loaded onto a Sephacryl S-300 HR (Amersham Biosciences) column (100 × 1.5 cm). PS was eluted from the column with 10 mm Tris-HCl (pH 7.4) buffer containing 100 mm NaCl. All the fractions were again tested for 11Aα or 11Aβ PS with the inhibition assay. 11Aα or 11Aβ PS that eluted early from the column were pooled and lyophilized. De-O-acetylation was performed using alkali hydrolysis as described (13).
Inhibition Assay for 11Aα and 11Aβ PS—The assay for the capsular PS is an inhibition-type enzyme-linked immunosorbent assay described previously (6). Briefly, the wells of enzyme-linked immunosorbent assay plates (Corning Costar Corp., Acton, MA) were coated at 37 °C with 1 μg/ml PS solution for 5 h in phosphate-buffered saline. 11A PS was used for 11Aα assay, and 11Aβ PS purified as below was used for 11Aβ assay. After washing the plates with phosphate-buffered saline containing 0.05% Tween 20, an appropriately diluted sample was added to the well along with a monoclonal antibody. Monoclonal antibody Hyp11AM2 was used for 11Aα assay, and monoclonal antibody Hyp11AM1 was used for 11Aβ assay. After 60 min of incubation in a humid incubator at 37 °C, the plates were washed and incubated for 1 h with alkaline phosphatase-conjugated goat anti-mouse immunoglobulin (Sigma). The amount of the enzyme immobilized to the wells was determined with para-nitrophenyl phosphate substrate (Sigma) in diethanolamine buffer. The absorbance at 405 nm was read with a microplate reader (BioTek Instruments Inc, Winooski, VT).
NMR Spectroscopy—NMR data were acquired at 322 K (7) on a Varian Inova 600-MHz spectrometer equipped with a cryogenically cooled HCN probe. All data were base-line corrected using a 3rd order Bernstein polynomial fit algorithm. A one-dimensional 1H proton spectrum with presaturation of the water resonance was acquired with 16 transients, a spectral width of 5997 Hz and 8192 points. Spectrum was transformed without apodization. Two-dimensional 1H-1H TOCSY (150- and 60-ms mix time) was acquired with 16 and 32 transients, respectively, spectral widths of 6000.6 Hz, and 4096 points in F2 and 5994.6 Hz and 512 point in F1. Apodization prior to Fourier transform was performed using a 90°-shifted sinebell in F2 and 90°-shifted sinebell squared in F1. Two-dimensional 1H-1H nuclear Overhauser effect spectroscopy (400-ms mix time) was acquired with 16 and 32 transients, respectively, spectral widths of 6000.6 Hz, and 8192 points in F2 and 5994.6 Hz and 512 points in F1. Apodization prior to Fourier transform was performed using a 90°-shifted sinebell in F2 and 90°-shifted sinebell squared in F1. Two-dimensional 1H-1H gradient-selected COSY was acquired with 16 transients, spectral widths of 6000.6 Hz in both F2 and F1, and 4096 and 256 points in F2 and F1, respectively. Apodization prior to Fourier transform was performed with 1°-shifted sinebell in both dimensions. Two-dimensional 1H-13C gradient-selected HSQC (with and without multiplicity editing) was acquired with 32 transients, spectral widths of 6000.6 Hz in F2 and 33167.5 Hz in F1, and 1024 and 256 points in F2 and F1, respectively. Two-dimensional 1H-13C HSQC-TOCSY was acquired with 128 transients, spectral widths of 6000.6 Hz in F2 and 30143.2 Hz in F1, with 1024 points and 256 points in F2 and F1, respectively, and 15-, 35-, 50-, and 75-ms mix times,. Two-dimensional 1H-13C HMBC was acquired with 128 transients, spectral widths of 6000.6 Hz in F2 and 33167.5 Hz in F1, with 1024 points and 512 points in F2 and F1, respectively, and 4, 8, 10, 12, 14, and 20 Hz multiple bond coupling and 140 Hz 1JCH coupling. Apodization prior to Fourier transform was performed using a 90°-shifted sinebell in F2 and 90°-shifted sinebell squared in F1. 1H-31P HMBC spectra were acquired on a 500-MHz Varian spectrometer equipped with a pentaprobe with 64 transients, spectral widths of 4497.7 Hz in F2, and 4040 Hz in F1, with 1024 points and 256 points in F2 and F1, respectively, and 29.79 Hz multiple bond coupling and 5 Hz 1JHP coupling. Minimal apodization prior to Fourier transform was performed using a 1°-shifted sinebell in F2 and 1°-shifted sinebell squared in F1. Chemical shifts were referenced relative to DSS or DMSO-d6 (0.00 ppm for 1H and 13C for DSS or 2.712 ppm δH and 39.56 ppm δC for DMSO). 31P chemical shifts were referenced indirectly to the proton frequency. Data processing was performed using Mestrenova.
RESULTS
1H and 13C Chemical Shift Assignment of the De-O-acetylated 11A PS—To investigate the 11A PS structure, we first obtained 1H spectra of the de-O-acetylated and native 11A PSs. As expected, de-O-acetylation reduced spectral complexity, and therefore the spectrum of de-O-acetylated PS was analyzed first. Although there appeared to be only two anomeric peaks (at 5.17 and 4.97 ppm), this was due to obscuring of two additional peaks (4.54 and 4.51 ppm) by residual water. The two obscured peaks were clearly observed in the 1H-13C HSQC spectrum (Fig. 1, black), which clearly showed all four anomeric peaks (black arrows). The presence of these four peaks indicates that the repeat unit is composed of four residues, two each in the α (1JCH = 176 and 175 Hz) and β configuration (1JCH = 166 and 163 Hz). The four anomeric peaks were termed α1 (5.17 ppm), α2 (4.97 ppm), β1 (4.54 ppm), and β2 (4.51 ppm) based upon their H-1 chemical shifts. Based upon previous work, these four peaks should correspond to two d-glucose and two d-galactose residues, one each of the α and β isomers. All further assignments began with the chemical shifts of the anomeric resonances.
FIGURE 1.

Overlay of the 1H-13C HSQC spectra of native (red) and de-O-acetylated (black) S. pneumoniae 11A PS. Peaks marked with an asterisk are peaks that show connectivities in the HMBC spectra and do not shift markedly between the two samples. Peaks marked with the pound sign are involved in connectivities as indicated in the HMBC spectra. The black arrows indicate the four anomeric resonances observed for the core polysaccharide.
In the 2.4-0.5 ppm region of the NMR spectrum, no significant peaks were observed suggesting that the de-O-acetylated core is fully de-O-acetylated and contains no hexoses with methyl groups (e.g. rhamnose). In this region, minor peaks were observed, and these minor peaks arose from contaminating C-PS (teichoic acid). Based upon the intensity of the peak arising from the N-methylphosphocholine of C-PS (10) at 3.22 ppm, the de-O-acetylated 11A PS contains 1.6 mol % C-PS, whereas the native sample contains 1.3 mol % C-PS (14). This degree of contaminants is consistent with previous findings (14).
Each peak in the 1H-13C HSQC spectrum of the core 11A PS (Fig. 1, black) was identified based upon the combination of data from the following experiments: 1H-1H TOCSY (75 ms and 150 isotropic mix time), 1H-1H gradient-selected COSY, 1H-1H nuclear Overhauser effect spectroscopy (50-, 100-, and 250-ms mix time), 1H-13C gradient-selected HSQC with adiabatic decoupling, and 1H-13C gradient-selected HSQC with multiplicity editing, 1H-13C HMBC (140 Hz 1JCH, 8 and 12 Hz multiple-bond coupling), and 1H-13C gradient-selected HSQC-TOCSY (140 1JCH and 35-ms mix time with direct correlations inverted). Briefly, TOCSY and COSY spectra were used to create spin systems arising from each anomeric proton. The HSQC-TOCSY and HSQC was used to assign 13C chemical shift(s) to each 1H resonance. The HMBC spectra were used to generate anomeric (inter-residue) connectivities as well as connectivities for other resonances (intra-residue). Long range COSY peaks were used to confirm the connectivities identified by the HMBC experiment (15). Each set of assignments was performed independently twice.
The assignments of the 1H-13C HSQC spectrum of the core 11A PS is summarized in Table 1. The d-galactose and d-glucose residues could be differentiated based upon the chemical shift of the H-2 (3.93 versus 3.64 for the α-anomers and 3.67 versus 3.39 for the β-anomers). This leads to the assignment of α1 and β2 as d-galactose and α2 and β1 as d-glucose. Additionally, galactose can be differentiated from glucose by the weak coupling of the H-4 (16). The 1H-1H TOCSY for α1 and β2 showed weak coupling from H-4 to H-5, whereas that for α2 and β1 showed strong coupling for H-4 to H-5. This supports the assignment of α1 and β2 as α-d-galactose and β-d-galactose and α2 and β1 as α-d-glucose and β-d-glucose. The assignment of the remaining resonances proceeds from these assignments directly.
TABLE 1.
Chemical shift assignment of de-O-acetylated 11A PS
| Residue | 1 | 2 | 3 | 4 | 5 | 6 | 6′ |
|---|---|---|---|---|---|---|---|
| αGal (α1) | 5.17a | 3.93 | 4.02 | 4.12 | 4.25 | 4.17 | 3.88 |
| 96.76 | 69.14 | 69.76 | 79.95 | 71.89 | 69.01 | 69.01 | |
| αGlc (α2) | 4.97 | 3.64 | 3.90 | 4.10 | 4.33 | 3.78 | 3.82 |
| 100.9 | 72.20 | 72.94 | 74.97 | 70.82 | 61.67 | 61.67 | |
| βGlc (β1) | 4.54 | 3.39 | 3.67 | 3.67 | 3.60 | 3.80 | 3.83 |
| 103.2 | 73.74 | 75.12 | 79.55 | 75.49 | 61.67 | 61.67 | |
| βGal (β2) | 4.51 | 3.67 | 3.77 | 3.72 | 4.16 | 3.98 | 3.85 |
| 103.7 | 70.35 | 78.65 | 75.78 | 65.88 | 60.92 | 60.92 | |
| Glycerol | 3.67/3.61 | 3.91 | 3.98/3.91 | ||||
| 62.99 | 71.56 | 67.44 | |||||
| PO4 | 3.91 | 3.98 | 4.10 | ||||
| (−0.23) | (−0.23) | (−0.23) |
Chemical shifts (1H/13C[31P]) are in ppm and are referenced to DSS-d6 and DMSO-d6. Numbers in italics are tentative assignments due to a high degree of overlap.
Determination of the Inter-residue Linkages in De-O-acetylated 11A PS—The glycosidic linkages can be unambiguously identified from the anomeric region of the HMBC spectrum acquired with 8 Hz multiple bond coupling (Fig. 2). This region shows the H-C-O-C connectivities arising from the anomeric protons that are essential to the proper arrangement of the residues in the primary sequence. The following inter-residue connectivities were observed: [-α-d-Gal(1→3)β-d-Gal-], [-α-d-Glc(1→4)α-d-Gal-], [-β-d-Glc(1→6)α-d-Gal-], and [-β-d-Gal(1→4)β-d-Glc-]. This finding showed that the α-d-;Galactose (α1) residue is linked at H-1, H-4, and H-6. The glycosidic linkage assignments were unambiguous for several reasons. First, connectivities were observed both from the anomeric proton to the connecting carbons and to the anomeric carbons from the connecting proton, ensuring the correctness of these assignments. Second, there was absolutely no ambiguity in linking the 13C shifts of the residue. The multiplicity-edited 1H-13C HSQC was crucial to determination of the [-β-d-Glc(1→6)α-d-Gal-] linkage because of the unusual 13C chemical shift of the α-d-Gal H-6 (because of its substitution) and the overlap of the α-d-Gal H-6 in the 1H dimension. Finally, long range COSY cross-peaks were observed for α-d-galactose H-1/β-d-galactose H-3 and for α-d-glucose H-1/α-d-galactose H-4, which confirm these connectivities (data not shown).
FIGURE 2.

1H-13C HMBC spectrum of de-O-acetylated S. pneumoniae 11A PS. Cross-peaks showing connectivities are indicated in the figure. Nomenclature is indicated in Table 1.
Determination of the Linkage of the Phosphate in De-O-acetylated 11A PS—To determine the linkage of the glycerol phosphate, we acquired one-dimensional 31P spectra (supplemental Fig. 1B) and two-dimensional 1H-31P HMBC spectra of de-O-acetylated polysaccharide (Fig. 3A (black)). The de-O-acetylated polysaccharide has a single 31P peak at -0.31 ppm. This indicates that the core polysaccharide has a single phosphorous moiety with no heterogeneity in its local environment. This is in accord with 31P chemical shifts of di-substituted phosphodiesters, consistent with the presence of the glycerol-phosphatesaccharide moiety (17). The 1H-31P HMBC data show three peaks (one is below the contour threshold) with the same 31P chemical shift (Fig. 3A, black). Two of the peaks are significantly more intense than the third and arise from the H-3 (3.98 and 3.91 ppm δH) of the glycerol moiety, confirming that connectivity. The other resonance corresponds to the α-d-glucose H-4 (α2) resonance (4.12 ppm δH), confirming the connectivity of the glycerol to this residue.
FIGURE 3.

1H-31P HMBC of different S. pneumoniae PS. A, ST11A native (red) and de-O-acetylated (black). B, ST11A native (red) and ST11Aβ native (green). C, de-O-acetylated ST11A (red) and ST11Aβ (green). D, ST11Aβ native (green) and de-O-acetylated (black).
Structure of De-O-acetylated 11A PS—We can then combine the results described above to determine the structure of the core ST11A polysaccharide. The α-d-Gal (α1) residue has three substitutions (H-1, H-4, and H-6), and α-d-Glc (α2) has only one PS substitution (H-1), as well as the pendant glycerol-phosphate moiety at H-4 as indicated by the 1H-31P data (Fig. 3A). In toto, all of the data lead to the structure shown in Fig. 4 (Table 1).
FIGURE 4.

Revised structure of de-O-acetylated S. pneumoniae 11A PS.
Assignment of the Native 11A PS—The assignments of the core polysaccharide can be used to determine the assignments and acetylation of the native 11A polysaccharide. The one-dimensional 1H spectrum of native 11A PS is much more complex than the core polysaccharide spectrum, but this can be easily understood upon inspection of the 1H-13C HSQC spectrum (Fig. 1, red). There are six anomeric resonances (peaks between 95 and 104 ppm δC), and three sites of acetylation (peaks in the region between 4.7 and 5.7 ppm δH and 66 ppm to 76 ppm δC). Two of these anomeric peaks have the same chemical shifts as these peaks in the core structure (4.96, 100.8 (α2) and 4.56, 103.2 (β1)). With these as starting points, the six spin systems corresponding to the six anomeric resonances can be assigned. For example, the glycerol peaks do not shift from the de-O-acetylated to the native structure nor do the peaks associated with the β-d-glucose (β1) spin system or with α-d-glucose (α2) (Tables 1 and 2). There are new peaks that arise from the glycerol (this identity is confirmed by the multiplicity-edited 1H-13C HSQC and see below) and from the α-d-glucose because of acetylation of those residues. From these starting points, it is rather straightforward to assign the remaining spin systems (Table 2). Peak α2 (4.96 ppm), α3 (5.01 ppm), and α4 (5.07 ppm) all arise from the same residue in the repeat (α-d-Glc), but the changes in chemical shift reflect its variable acetylation (see below). Peak β2 has shifted downfield by 0.1 ppm δH as a result of O-acetylation at C-4. Peak α1 is perturbed because of the acetylation of the 2-position of the α-d-Glc linked to its C-4 position; this peak shifts by 0.05 ppm δH and 1.0 ppm δC. Peak β1 is not perturbed from the core structure because it is neither acetylated nor are any carbons proximal to it.
TABLE 2.
Chemical shift assignment of native 11A PS
| Residue | 1 | 2 | 3 | 4 | 5 | 6 | 6′ | O-Acetyl |
|---|---|---|---|---|---|---|---|---|
| αGal (α1) | 5.12a | 3.96 | 4.03 | 4.12 | 4.26 | 4.18 | 3.89 | |
| 95.74 | 69.58 | 69.59 | 79.63 | 72.12 | 68.81 | 68.8 | ||
| αGlc (α2) | 4.96 | 3.63/3.79 | 3.89 | 4.09 | 4.32/4.41 | ND | ||
| 100.8 | 72.28/70.65 | 73.00 | 74.89 | 70.94/70.82 | ND | |||
| αGlc (α2) | 5.01 | 3.79 | 5.24 | 4.32 | 4.41 or 4.12 | ND | 2.19 | |
| 100.7 | 70.65 | 74.71 | 72.33 | ND | 21.17 | |||
| αGlc (α2) | 5.07 | 4.84 | 4.10 | 4.20 | 4.32 | ND | ||
| 98.44 | 73.65 | 70.89 | 74.68 | 64.45 | ND | |||
| βGlc (β1) | 4.56 | 3.39 | 3.68 | 3.67 | 3.61 | 3.98 | ||
| 103.2 | 73.76 | 75.11 | 80.32 | 75.38 | ND | |||
| βGal (β2) | 4.62 | 3.72 | 3.99 | 5.59 | 4.12 | ND | 2.18 | |
| 103.8 | 70.47 | 75.11 | 67.03 | 71.66 | ND | 20.93 | ||
| Glycerol | 3.67/3.59 | 3.90 | 3.98/3.91 | |||||
| 63.05/63.04 | 71.58 | 67.45/67.40 | ||||||
| Glycerol-Ac | 4.25/4.16 | 3.87 | 3.88/3.80 | 2.12 | ||||
| 63.35/63.32 | 71.62 | 67.19/67.25 | 20.91 | |||||
| PO4 | 3.90/3.98 | 3.91/3.98 | 3.80/3.88 | |||||
| (−0.23) | (−0.31) | (−0.70) |
Chemical shifts (1H/13C[31P]) are in ppm and are referenced to DSS-d6 and DMSO-d6. Numbers in italics are tentative assignments due to a high degree of overlap. ND means not determined.
31P Assignment of Native 11A PS—The one-dimensional 31P spectrum (supplemental Fig. 1A) shows a change in the phosphate; there are now three discrete 31P chemical shifts. This is shown clearly in the 1H-31P HMBC spectrum of the native 11A PS (Fig. 3A, red). The proton resonances corresponding to -0.21 and -0.31 ppm δP are the same, 3.98 and 3.91 ppm δH. These are the H-3 of the glycerol seen in the core structure. A new set of peaks also appears at 3.88 and 3.80 ppm δH and -0.70 ppm δP. These new peaks are still the H-3 of the glycerol that has been shifted upfield. This is because of acetylation of the H-1 of the glycerol (discussed below). As expected, there is no change in the linkage of the glycerol-phosphate moiety to the polysaccharide (Table 2).
Determination of the Inter-residue Linkages of the Native 11A PS—Far fewer peaks were observed in the 1H-13C HMBC of the native PS than in the de-O-acetylated HMBC under the same experimental conditions, notably in the anomeric region (Fig. 5). Additional HMBC experiments were run with multiple bond couplings of 4, 10, 14, and 20 Hz to find parameters that would yield all of the anomeric (inter-residue) linkages for native 11A. The 20 and 14 Hz HMBC spectra were able to discern a few additional peaks (data not shown), but these were intra-residue peaks that were able to be determined via the HSQC-TOCSY. Three of the four peaks that are involved in connectivities between residues have minor chemical shift changes between the core and native structures (Fig. 1, denoted by asterisk). These peaks are easily mapped from the de-O-acetylated assignments. The one connected peak that shifts significantly is the β-d-Gal H-3 (Fig. 1, denoted by pound sign), which is adjacent to a fully acetylated residue. Fortuitously, its 1H chemical shift is not overlapped and lends itself to ready assignment. Therefore, even considering the limited set of observed HMBC cross-peaks with which to assign connectivities, we are able to confirm that the primary structure of 11A is a branched tetrasaccharide, consistent with what was seen for the core PS.
FIGURE 5.

Overlay of the 1H-13C HMBC spectra of native (red) and de-O-acetylated (black) 11A PS. Spectra were acquired with identical parameters, 140 Hz 1JCH, and 8 Hz multiple bond coupling (125-ms delay).
Determination of the O-Acetylation of the Native 11A PS—In contrast to previous NMR studies (9, 10), modern equipment (cryo-cooled probes) and methods (such as the HMBC (18-21)) allow direct determination of acetate linkages (22, 23). Cryo-cooled probes give ∼4 times more signal/noise than conventional room temperature probes (11, 24). This allows for routine detection of carbon-correlated experiments, like the HSQC and HMBC, using natural abundance 13C. This is not always necessary, however, as it has been shown how to incorporate 13C post-isolation for NMR studies (25). The HMBC experiment can detect multiple carbon correlations from a given proton, typically three bonds away (H-C-X-C, where X is any heteroatom but typically oxygen in PSs). This corresponds to correlations from the anomeric proton to the intra-residue C-3 and C-5 and the inter-residue glycosidic carbon. HMBC correlations arising from the CH3 of acetyl groups will be more intense that those arising from CHs (because of the three identical protons of the acetyl methyl versus 1 for the CH). Correlation from the acetyl methyl group can lead to the detection of four bond couplings because of the very strong coupling of the carbonyl and the much greater initial intensity. As shown in Fig. 6, three correlations were detected arising from the acetate methyl (Fig. 6A) and two to the acetate carbonyl (Fig. 6B) by the HMBC experiment. The two most intense peaks (2.18 and 2.11 ppm δH) in Fig. 6A correlate to the carbon chemical shifts of the peak at 5.59 ppm and to the carbon chemical shifts of the CH2 with δH of 4.26 and 4.15 ppm, respectively. The peaks at 4.26/4.15 are quite intense relative to the rest of the carbohydrate peaks. In fact, the δC (∼63.3 ppm) indicates that they are glycerol peaks, rather than sugar peaks. This is further supported by both the 1H-13C HSQC-TOCSY (15, 35, 50, and 75-ms mix time), the 1H-1H TOCSY, the 1H-13C HMBC, and the multiplicityedited heteronuclear single quantum coherence spectroscopy,3 which all confirm that these peaks are part of a glycerol spin system.4 Based upon carbon chemical shifts and the 1H-31P data, the site of acetylation is C-1 (the carbon farthest from the phosphate, Fig. 7). Based upon relative intensities and comparison of integrals, the glycerol is O-acetylated with 0.5 eq of acetate per mol of repeating unit.
FIGURE 6.

Regions of the 1H-13C HMBC spectrum of native S. pneumoniae 11A PS showing connectivities for three acetate peaks. A, connectivities from the acetate methyl to carbon chemical shift of substituted residues. B, connectivities from the substituted residues to the carbonyls of the acetate. There is no connection for the carbonyl from the peak at 5.59 ppm.
FIGURE 7.

Revised structure of native S. pneumoniae 11A PS and 11Aα PS.
The second major site of O-acetylation is C-4 of the β-d-Galp residue (β2), giving rise to the new peak at 5.59 ppm. This was determined through the combination of 1H-1H TOCSY, 1H-1H COSY, 1H-13C HMBC, and 1H-13C HSQC-TOCSY. Based upon relative intensities and comparison of integrals, this residue is O-acetylated with 1.0 eq of acetate per mol of repeating unit. The remaining two peaks in the “anomeric” region, which arise from acetylation (5.24 and 4.84 ppm δh), are the acetylated C-2 and C-3 of the α-d-Glcp residue (α2 in core nomenclature). Acetylation occurs at either the C-3 (∼60%) or the C-2 position (∼40%), but they do not appear to be O-acetylated simultaneously. The peak at 5.01 ppm δH is α-d-glucose-acetylated at C-2, and the peak at 5.07 ppm δH is acetylated at C-2. Based upon relative intensities and comparison of integrals, these residues are O-acetylated with 0.9 eq of acetate per mol of repeating unit. This leads to the native structure as represented in Fig. 7.
Determination of the Structure of 11Aα and 11Aβ, Two Clinical Isolates—Once we have determined the structure of 11A PS from ATCC, we investigated 11Aα and 11Aβ PS purified in our laboratory. The 1H-13C HSQC spectra of de-O-acetylated 11Aα PS and 11Aβ PS matched exactly with the spectrum acquired from de-O-acetylated 11A PS (supplemental Fig. 2). Native 11Aα 1H-13C HSQC spectrum overlays with the spectrum of native 11A exactly, indicating no structural differences. As discussed below, ST11Aα differs from ST11A in the degree of acetylation (Table 4); the sites are identical. The 1H-13C HSQC of the native 11Aα and 11Aβ differ significantly (data not shown), indicating significant structural differences. These differences are also observed between ST11A and ST11Aβ, as would be expected. The spectrum of native 11Aβ PS differs significantly from native 11A PS, most notably in two regions (Fig. 8). The first difference is the absence of peaks at 4.26/4.15 δH corresponding to acetylated glycerol (Fig. 8, boxed area). The second region is the anomeric peak of β-d-galactose (β2), which in 11Aβ spectrum appears with chemical shifts identical to the de-O-acetylated structure. The first difference is ascribed to 11Aβ PS missing the acetylglycerol found in 11A PS; there is no evidence elsewhere in the spectra of acetylated glycerol. The 1H-31P HMBC spectra of de-O-acetylated 11A PS and 11Aβ PS match exactly (Fig. 3, B-D). There is no change to the 1H-31P HMBC spectra of ST11Aβ in the native or de-O-acetylated form (Fig. 3D). The second difference can be ascribed to the very low level of acetylation seen in the β-d-galactose H-3 (Table 4). 11Aβ PS, in contrast to 11A PS, is partially acetylated at this residue (0.3 mol eq in 11Aβ PS versus 1.0 mol eq in 11A PS) (Table 4). All of these data lead to the structure of ST11Aβ presented in Fig. 9 (Table 3).
TABLE 4.
Acetylation patterns of 11A serotypes (mol eq)
| Serotype | β-d-galactose H3 | α-d-glucose H2 | α-d-glucose H3 | Glycerol |
|---|---|---|---|---|
| 11A | 1.0 | 0.54 | 0.36 | 0.5 |
| 11Aα | 1.0 | 0.6 | 0.5 | 0.5 |
| 11Aβ | 0.3 | 1.0 | 0.4 | 0.0 |
FIGURE 8.

Overlay of the 1H-13C HSQC of ST11A and ST11Aβ. The box indicates the H-1 peaks of the acetylated glycerol, which are missing in ST11Aβ. See text for further details.
FIGURE 9.

Structure of ST11Aβ.
TABLE 3.
Chemical shift assignment of native 11Aβ PS
| Residue | 1 | 2 | 3 | 4 | 5 | 6 | 6′ | O-Acetyl |
|---|---|---|---|---|---|---|---|---|
| αGal (α1) | 5.12a | NDb | ND | ND | ND | ND | ||
| 95.75 | ND | ND | ND | ND | ND | |||
| αGal (α1) | 5.18 | 3.94 | 4.03 | 4.13 | 4.26 | 4.19 | 3.91 | |
| 96.76 | 73.09 | 69.71 | 79.89 | 71.95 | 68.89 | 68.89 | ||
| αGlc (α2) | 4.97 | 3.63 | 3.90 | 4.11 | 4.34/4.43 | 3.79 | 3.81 | |
| 100.9 | 72.27 | 72.97 | 75.05 | 70.88/70.80 | 61.60 | 61.60 | ||
| αGlc (α2) | 5.02 | 3.80 | 5.25 | 4.07/4.34 | 4.19 | 3.84 | ||
| 100.66 | 70.66 | 74.74 | 80.35/72.36 | 71.90 | 60.91 | |||
| αGlc (α2) | 5.09 | 4.85 | 4.11 | 4.21 | 4.32 | 3.74 | ||
| 98.46 | 73.67 | 70.78 | 74.79 | 64.49 | 60.29 | |||
| βGlc (β1) | 4.56 | 3.39 | 3.68 | 3.68 | 3.60 | 3.65 | 3.99 | |
| 103.2 | 73.79 | 75.17 | 79.61 | 75.51 | 61.11 | 61.05 | ||
| βGal (β2) | 4.51 | 3.68 | 3.78 | 3.72 | 4.17 | ND | ||
| 103.8 | 70.37 | 79.59 | 75.81 | 65.90 | ND | |||
| Glycerol | 3.67/3.60 | 3.87/3.90 | 3.99/3.91 | |||||
| 63.05 | 71.61 | 67.50 | ||||||
| PO4 | 4.11 | 3.99 | 3.91 | |||||
| (−0.23) | (−0.23) | (−0.23) |
Chemical shifts (1H/13C[31P]) are in ppm and are referenced to DSS-d6 and DMSO-d6. Numbers in italics are tentative assignments due to a high degree of overlap. Acetyl resonances could not be unambiguously assigned to specific residues.
ND means not determined.
DISCUSSION
Structural analysis of 11A PS is not simple because it cannot be easily hydrolyzed into repeating units and is heterogeneously and multiply acetylated. To simplify the analysis, we first studied the de-O-acetylated PS to determine the core structure of 11A PS before analyzing the PSs from serotypes 11Aα and 11Aβ. Instead of the linear structure (→6αGlc1→4αGal1→ 3βGal1→4βGlc1) (Fig. 1) proposed by Richards et al. (9, 10), we found the repeating unit of the core structure of all three PS to be a branched tetrasaccharide (→6(αGlc1→4)αGal1→ 3βGal1→4βGlc1) (Fig. 7). The branch model is unambiguous because the α-galactose residue has connections at both C-4 and C-6 (Fig. 2). Because Richards et al. (9, 10) presented very limited one-dimensional 1H and 13C data in publications, we could not reconcile their NMR results with ours. However, our branch model is consistent with the data of Richards et al. (9, 10) obtained from degradative chemical analysis (10). Furthermore, it is interesting to note that Kennedy et al. (8) had some (but inconclusive) evidence for a branched core structure of 11A PS over 40 years ago. The biosynthetic mechanism can be readily provided for the branched core structure. For instance, 11A serotype pneumococci may produce the repeating unit (αGlc1→4αGal1→3βGal1→4βGlc1). Genetic studies have shown that the genes for all the transferase enzymes necessary to make this repeating unit are in the capsule gene locus of serotype 11A (4). Furthermore, the transferase enzyme gene locations reflect the exact order of the chemical structure (i.e. βGal transferase gene is located 5′ to αGal transferase gene etc.). Prior to completing the synthesis of the repeating unit, glycerol-phosphate would be added to αGlc and acetyl residues to appropriate sites. Once the synthesis of the repeating unit is complete, the repeating unit would be exported to the outside of the bacteria and then the polymerase would link βGlc of one repeating unit to αGal of another repeating unit by an 1→6 linkage. This polymerization step would readily create a repeating unit with a branch.
Although previous studies identified three O-acetylation residues, they identified acetylation sites only for two residues and left the third acetylation site as “indeterminate.” Our studies have now identified all the O-acetylation sites. 11A PS and 11Aα PS have the identical acetylation patterns (Table 4), and they are fully acetylated (1.0 mol eq) at the βGal H-3 and are also acetylated at either the αGlc H-2 or H-3, and about 40% of acetylation is found at the H-2 site and 60% at the H-3 site. In addition, both PSs are partially acetylated (0.5 mol eq) on the glycerol moiety of αGlc, and this glycerol was the indeterminate site in the previous studies. The acetylation pattern for 11Aβ PS is very different from those of 11A and 11α (Table 4). 11Aβ PS is only partially acetylated at the βGal H-3, fully acetylated at αGlc H-2 (1.0 mol eq), and partially acetylated at αGlc H-3 (0.4 mol eq). Unlike 11A and 11Aα, 11Aβ PS appears to be simultaneously acetylated at both αGlc H-2 and H-3 positions. A striking difference is that 11Aβ PS contains no acetylated glycerol. Because 11Aα PS and 11Aβ PS have the repeating units with the identical core structure, the acetylation differences must be the structural basis for their serologic difference. But because of multiple acetylation differences, more studies are necessary before their serological differences can be explained.
Consistent with our chemical studies, genetic studies found three genes (wcjE, wcwC, and wcwT) encoding acetyltransferases in the 11A capsule gene locus (4). wcwT is present in the genome of all members of serogroup 11 (i.e. serotypes 11A, 11B, 11C, 11D, and 11F), but wcwC and wcjE are found only in the genome of serotypes 11A, 11F, and 11D. Because αGlc is acetylated in all members of the serogroup 11, wcwT would likely encode the acetyltransferase for αGlc. The acetyltransferase wcjE is defective in 11Aβ.5 It is believed that the wcjE gene product is responsible for acetyl transfer to the glycerol moiety. Because 11Aα PS and 11Aβ PS differ only in acetylation, comparison of their capsule gene loci may help us identify role of the remaining two acetyltransferase genes.
Although glycerol is present in other pneumococcal capsules (e.g. serogroups 15, 18, and 23), glycerol is uncommon among capsular PSs (26). There have been no reports of acetylated glycerol, as far as we are aware. Thus, our discovery of acetylated glycerol is novel. In future studies of capsular PS, one should look for acetylated glycerol because it may produce small serological differences that may have been ignored so far. Furthermore, glycerol polymer is the main component of teichoic acid of some bacteria, and the glycerol polymer is known to be decorated with alanine or N-acetylglucosamine (27). It may be interesting to consider if the teichoic acid can be acetylated.
Acetyl groups can be an important epitope for antibodies, and acetylation differences have been associated with immunological escapes. Capsular PSs of 9V and 9N serotypes differ only in acetylation (13). 9V serotype was discovered in the 1930s because a patient infected with the 9V strain could not be treated with antisera prepared for other members of serogroup 9 (28). Also, 15B PS and 15C PS differ in O-acetylation (15B PS is acetylated) (29), and the two serotypes differ in their susceptibility to antibodies induced with a pneumococcal vaccine (30). Furthermore, serotypes 15B and 15C can reversibly interconvert because their acetyltransferase genes (cps15bM/cps15 cM) have repeat TA and can be reversibly activated or inactivated (29). Opsonization by antibodies in defense of pneumococcal infections is of paramount importance in a robust immune response. A preliminary study suggests that some human sera can opsonize one 11A subtype but not the other.5 Thus, the presence or absence of acetylation of the glycerol phosphate moiety can affect the immune response to pneumococcal infections. 11A is a component of currently marketed adult pneumococcal adult vaccine (7), but it is not part of the currently marketed pediatric vaccine (31, 32). Thus, one should investigate if currently available pneumococcal vaccines elicit antibodies capable of opsonizing pneumococci producing 11Aα PS as well as 11Aβ PS.
Recent improvements in NMR technology permit determination of the capsular PS structure with whole bacteria without the need to purify the PS from clinical isolates (33, 34). Also, monoclonal antibodies can be better than polyclonal antibodies in recognizing small serological differences. These improved analytical technologies (NMR and monoclonal antibodies) should help us to discover novel pneumococci serotypes among clinical isolates that are not currently typeable. This has already happened for the “well characterized” serotypes 11A and 6A. These experiences suggest that pneumococci are capable of expressing more diverse capsular PS structures than we have anticipated.
Supplementary Material
Acknowledgments
We thank Dave Detlefson of Novatia for acquiring 1H-31P HMBC data and John Hennessey for useful discussions.
This work was supported, in whole or in part, by National Institutes of Health Grant AI-30021 (to M. H. N.). The costs of publication of this article were defrayed in part by the payment of page charges. This article must therefore be hereby marked “advertisement” in accordance with 18 U.S.C. Section 1734 solely to indicate this fact.
The on-line version of this article (available at http://www.jbc.org) contains supplemental Figs. 1 and 2.
Footnotes
The abbreviations used are: PS, polysaccharide; COSY, correlation spectroscopy; DMSO, dimethyl sulfoxide; HMBC, heteronuclear multiple bond coherence spectroscopy; HSQC, heteronuclear single quantum coherence spectroscopy; HSQC-TOCSY, heteronuclear single quantum coherence-total correlation spectroscopy; TOCSY, total correlation spectroscopy.
Multiplicity editing creates peaks with either positive or negative intensities depending on whether an even or odd number of protons are attached to the carbon. CH and CH3 groups will have the same sign, which will be the opposite sign of CH2 groups.
E. R. Zartler, R. J. Porambo, J. Yu, and M. H. Nahm, manuscript in preparation.
M. H. Nahm, unpublished results.
References
- 1.Avery, O. T., and Dubos, R. (1931) J. Exp. Med. 54 73-89 [DOI] [PMC free article] [PubMed] [Google Scholar]
- 2.Henrichsen, J. (1995) J. Clin. Microbiol. 33 2759-2762 [DOI] [PMC free article] [PubMed] [Google Scholar]
- 3.Park, I. H., Pritchard, D. G., Cartee, R., Brandao, A., Brandileone, M. C. C., and Nahm, M. H. (2007) J. Clin. Microbiol. 45 1225-1233 [DOI] [PMC free article] [PubMed] [Google Scholar]
- 4.Bentley, S. D., Aanensen, D. M., Mavroidi, A., Saunders, D., Rabbinowitsch, E., Collins, M., Donohoe, K., Harris, D., Murphy, L., Quail, M. A., Samuel, G., Skovsted, I. C., Kaltoft, M. S., Barrell, B., Reeves, P. R., Parkhill, J., and Spratt, B. G. (2006) PLoS Genet. 2 e31. [DOI] [PMC free article] [PubMed] [Google Scholar]
- 5.Park, I. H., Park, S., Hollingshead, S. K., and Nahm, M. H. (2007) Infect. Immun. 75 4482-4489 [DOI] [PMC free article] [PubMed] [Google Scholar]
- 6.Yu, J., Carvalho, M., Beall, B., and Nahm, M. H. (2008) J. Med. Microbiol. 57 171-178 [DOI] [PubMed] [Google Scholar]
- 7.Abeygunawardana, C., Williams, T. C., Sumner, J. S., and Hennessey, J. P. (2000) Anal. Biochem. 279 226-240 [DOI] [PubMed] [Google Scholar]
- 8.Kennedy, D. A., Buchanan, J. G., and Baddiley, J. (1969) Biochem. J. 115 37-45 [DOI] [PMC free article] [PubMed] [Google Scholar]
- 9.Richards, J. C., Perry, M. B., and Kniskern, P. J. (1985) Can. J. Biochem. Cell Biol. 63 953-968 [DOI] [PubMed] [Google Scholar]
- 10.Richards, J. C., Perry, M. B., and Moreau, M. (1988) Adv. Exp. Med. Biol. 228 595-596 [Google Scholar]
- 11.Kotsubo, V., and Nast, R. (1995) Adv. Cryo. Eng. 41 1857-1864 [Google Scholar]
- 12.Vanderijn, I., and Kessler, R. E. (1980) Infect. Immun. 27 444-448 [DOI] [PMC free article] [PubMed] [Google Scholar]
- 13.McNeely, T. B., Staub, J. M., Rusk, C. M., Blum, M. J., and Donnelly, J. J. (1998) Infect. Immun. 66 3705-3710 [DOI] [PMC free article] [PubMed] [Google Scholar]
- 14.Xu, Q. W., Abeygunawardana, C., Ng, A. S., Sturgess, A. W., Harmon, B. J., and Hennessey, J. P. (2005) Anal. Biochem. 336 262-272 [DOI] [PubMed] [Google Scholar]
- 15.Otter, A., and Bundle, D. R. (1995) J. Magn. Res. 109 194-201 [DOI] [PubMed] [Google Scholar]
- 16.Duus, J. O., Gotfredsen, C. H., and Bock, K. (2000) Chem. Rev. 100 4589-4614 [DOI] [PubMed] [Google Scholar]
- 17.Merchant, T. E., and Glonek, T. (1990) J. Lipid Res. 31 479-486 [PubMed] [Google Scholar]
- 18.Bax, A., and Subramanian, S. (1986) J. Magn. Reson. 67 565-569 [Google Scholar]
- 19.Gasmi, G., Massiot, G., and Nuzillard, J. M. (1996) Magn. Reson. Chem. 34 185-190 [Google Scholar]
- 20.Reynolds, W. F., Mclean, S., Tay, L.-L., Yu, M., Enriquez, R. G., Estwick, D. M., and Pascoe, K. O. (1997) Magn. Res. Chem. 35 455-462 [Google Scholar]
- 21.Summers, M. F., Marzilli, L. G., and Bax, A. (1986) J. Am. Chem. Soc. 108 4285-4294 [DOI] [PubMed] [Google Scholar]
- 22.Cerda-Garcia-Rojas, C. M., Zamorano, G., Chavez, M. I., Catalan, C. A. N., and Joseph-Nathan, P. (2000) Magn. Res. Chem. 38 494-499 [Google Scholar]
- 23.Tezuka, Y. (1997) Carbohydr. Res. 305 155-161 [Google Scholar]
- 24.Russell, D. J., Hadden, C. E., Martin, G. E., Atholl, A., Zens, A. P., and Carolan, J. L. (2000) J. Nat. Prod. (Lloydia) 63 1047-1049 [DOI] [PubMed] [Google Scholar]
- 25.Yu, F., and Prestegard, J. H. (2006) Biophys. J. 91 1952-1959 [DOI] [PMC free article] [PubMed] [Google Scholar]
- 26.Kamerling, J. P. (2000) in Streptococcus pneumoniae Molecular Biology and Mechanisms of Diseases (Tomasz, A., ed) pp. 81-114, Mary Ann Liebert, New Rochelle, NY
- 27.Neuhaus, F. C., and Baddiley, J. (2003) Microbiol. Mol. Biol. Rev. 67 686-723 [DOI] [PMC free article] [PubMed] [Google Scholar]
- 28.Vammen, B. (1939) J. Immun. 37 359-365 [Google Scholar]
- 29.van Selm, S., van Cann, L. M., Kolkman, M. A. B., van der Zeijst, B. A. M., and van Putten, J. P. M. (2003) Infect. Immun. 71 6192-6198 [DOI] [PMC free article] [PubMed] [Google Scholar]
- 30.Rajam, G., Carlone, G. M., and Romero-Steiner, S. (2007) Clin. Vaccine Immunol. 14 1223-1227 [DOI] [PMC free article] [PubMed] [Google Scholar]
- 31.Kim, J. S., Laskowich, E. R., Arumugham, R. G., Kaiser, R. E., and Mac-Michael, G. J. (2005) Anal. Biochem. 347 262-274 [DOI] [PubMed] [Google Scholar]
- 32.Kim, J. S., Laskowich, E. R., Michon, F., Kaiser, R. E., and Arumugham, R. G. (2006) Anal. Biochem. 358 136-142 [DOI] [PubMed] [Google Scholar]
- 33.Li, W., Lee, R. E. B., Lee, R. E., and Li, J. H. (2005) Anal. Chem. 77 5785-5792 [DOI] [PubMed] [Google Scholar]
- 34.Gudlavalleti, S. K., Szymanski, C. M., Jarrell, H. C., and Stephens, D. S. (2006) Carbohydr. Res. 341 557-562 [DOI] [PubMed] [Google Scholar]
Associated Data
This section collects any data citations, data availability statements, or supplementary materials included in this article.