

Abstract
Phase diagrams of lipid mixtures can show several different regions of phase coexistence, which include liquid-disordered, liquid-ordered, and gel phases. Some phase regions are small, and some have sharp boundaries. The identity of the phases, their location in composition space, and the nature of the transitions between the phases are important for understanding the behavior of lipid mixtures. High fidelity phase boundary detection requires high compositional resolution, on the order of 2% compositional increments. Sample artifacts, especially precipitation of crystals of anhydrous cholesterol, can occur at higher cholesterol concentrations unless precautions are taken. Fluorescence resonance energy transfer (FRET) can be used quantitatively to find phase boundaries and even partition coefficients of the dyes between coexisting phases, but only if data are properly corrected for non-FRET contributions. Self-quenching of dye fluorescence can be significant, distorting the data at dye concentrations that intuitively might be considered acceptable. Even more simple than FRET experiments, measurements of single dye fluorescence can be used to find phase boundaries. Both FRET and single dye fluorescence readily detect formation of phase domains that are much smaller than the wavelength of light, i.e. “nanoscopic” domains.
Keywords: ternary mixture, phase boundary, FRET, single dye fluorescence, nanoscopic domains, cholesterol
1. Introduction
A description of the behavior of a complex mixture of bilayer components includes a picture of the average, long-time relative positions of all components within the bilayer. The thermodynamic phase diagram for the lipid components over all of composition space is a good start toward such a complete description of lipid mixtures. Two useful approaches to this description have been experimental measurement of phase boundaries, a strategy that is not limited as to number of components; and phase identification.
Bilayer mixtures of lipids with 2 components can show complex behavior, including phase separations [1]. Mixtures of 3 components, still far fewer than in a real biomembrane, show much more complex phase behaviors [2]. For example, 3-component mixtures containing cholesterol, but not 2-component mixtures, have been found to separate into coexisting macroscopic domains of liquid-ordered + liquid disordered phases [3-5]. Systematic characterization in the form of a thermodynamic phase diagram is crucial in order to make sense of the complex behaviors. How then to detect the boundaries?
Here we discuss the use of several fluorescence methods for detecting phase boundaries, especially in constant temperature, multicomponent mixtures2. Because some features of the phase diagrams span only a few percent in composition space, and because it can be important to know if some features are actually straight lines in composition space, there is a minimal requirement in number of samples in order to thoroughly examine all compositions. We have found that ~3% compositional increments are barely adequate, whereas 2% increments are sufficient to describe most features [2]. The large number of samples needed to examine all of composition space for a 3-component mixture constrains the types of techniques that can be used to map an entire isothermal phase diagram to those that require only a few minutes per measurement. Thus, several varieties of fluorescence techniques can be suitable, but for example, NMR methods, although uniquely valuable for characterizing order and motion, are less suitable for examination of many hundreds of samples.
A simple case is the first order phase transition at room temperature in the bilayer mixture of DPPC/DLPC. The temperature-dependent phase behavior was established in 1977 by van Dijck et al [8] by use of differential scanning calorimetry. Their results are shown in Figure 1. These phase separations are macroscopic, as shown in the Figure 2 image of a giant unilamellar vesicle (GUV) at 25 C, at composition DPPC/DLPC = 4/1, within the region identified [8] as having two coexisting phases, Lα + Lβ (respectively, the fluid-disordered phase and the gel or solid-ordered phase). The value of obtaining a clear microscopy image is that a given composition can be determined to be within a 2-phase region, and also that the coexisting phases are clearly seen to be macroscopic. Here we examine two different fluorescence methods that are not limited to detecting phase domains that are macroscopic, and that can be used to characterize the entire pattern of phase behavior as a function of composition for multicomponent mixtures: FRET and single-dye fluorescence.
Figure 1.

Temperature-composition phase diagram for DPPC/DLPC aqueous bilayers, from [1]. Small filled circles with short vertical line error bars, DSC data. Solid lines, data fit to a thermodynamic model [1]. FRET data using donor/acceptor dye pairs DHE/C18:0-DiO and C18:0-DiO/C18:2-DiI are in good agreement with [1] at both the liquidus (◇) and the solidus boundary (◯).
Figure 2.
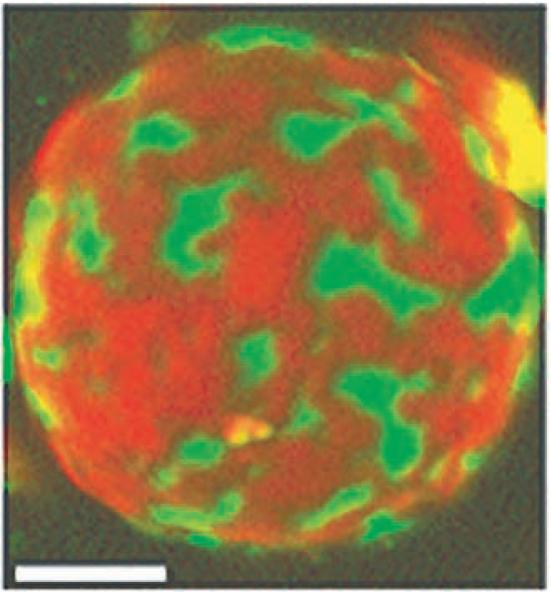
Giant unilamellar vesicle of DPPC/DLPC = 4/1 at 25C, showing coexisting Lα (green) and Lβ (red) phases. Green fluorescent Bodipy-PC and red-orange fluorescent C20:0-DiI are present at 1 dye/1000 total lipids. Image is from confocal fluorescence microscopy, color-merged using the public domain NIH Image program. The bar represents 5 micron.
2. Fluorescence resonance energy transfer (FRET) to detect phase boundaries
2.1 General principles
The FRET experiment is based upon FRET becoming either less (or more) efficient as a fluorescent donor and fluorescent acceptor separate from each other (or co-localize) when phases separate [2]. In Figure 1 the open diamonds show the liquidus boundary and the open circles the solidus boundary of the temperature-composition phase diagram for DPPC/DLPC, determined by use of the dialkylcarbocyanine dyes, C18:2-DiO and C18:0-DiI. In this experiment, donor and acceptor molecules tend to separate from each other because they partition differently into the different membrane environments Lα + Lβ. Phase boundaries are revealed by pronounced reductions in FRET compared with the FRET values in the adjacent 1-phase regions, as donors and acceptors become effectively separated by their differential partitioning. In general the phase boundaries are marked more clearly the stronger the dye partition, a principle which has been extended by Silvius [9], who developed donor and acceptor dyes having especially strong partition into solid or fluid bilayers.
2.2 Correcting FRET data
In order to use FRET results quantitatively, the experimental measurements must be corrected. Various factors can influence the measured fluorescence, in addition to the energy transfer:
(i) The most trivial kind of sample-to-sample differences in vesicle concentration can produce significant variation in measured fluorescence intensities. This effect can be corrected by use of a normalization signal for each sample, most conveniently, direct excitation of the acceptor dye, as in Figure 3b.
Figure 3.

In a mixture of DPPC/DLPC at 20C, the phase boundaries (vertical dotted lines) are marked by reduced FRET when dyes separate into Lα and Lβ phases. The actual boundary compositions were determined by computer fitting of the FRET data, measured as fluorescence of C18:0-DiO when DHE is excited (a), is corrected successively by normalization by direct excitation of DiO in each sample (b); subtraction of DHE fluorescence bleed-through into the DiO channel (c); and finally by subtraction of signal from vesicles that contain no dyes (d). For comparison, the final, fully corrected FRET is shown in (a), (b), and (c) as filled grey circles.
(ii) Bleed-through of donor fluorescence into the acceptor fluorescence detection channel is often significant and must be corrected. This bleed-through correction of the contribution from donor fluorescence to the signal measured at the acceptor emission requires a separate sample that contains only the donor fluorophor. By measuring the donor's maximum fluorescence together with the donor's fluorescence at the acceptor emission wavelength, the bleed-through in the actual samples of interest is readily corrected from the measured donor maximum emission. This correction is shown in Figure 3c.
(iii) Depending upon the relative intensity of the measurements, subtraction of any non-fluorescence background signals from a separate vesicle bilayer sample without any fluorophors, Figure 3d, can be significant.
(iv) A drifting instrument baseline may also require correction over the course of several hours of data collection.
(v) These samples are suspensions that scatter the incident and the emitted light. Light scattering from multilamellar vesicle suspensions can be significant even at ~ 10 micromolar total lipid concentration. This light scattering, rather than the actual absorbance which is already sufficiently small, should be kept low enough that no correction is needed for an “inner filter effect”. On the other hand, especially for dilute fluorophors and small FRET values, signal should be maximized. One way to optimize these factors is to prepare a sample suspension at much higher concentration than that intended for measurements, then to record a series of fluorescence readings at the excitation and emission wavelengths of interest as a function of total lipid concentration. Look for a concentration that is well below where deviations from linearity are observed. Note that light scattering can lead to increased as well as decreased fluorescence signal [10].
(vi) Sample concentrations should be established by quantitative means, not by assuming as correct the nominal concentration of the lipid supplier, which we find to be accurate only to within ~10%. For phospholipids, a phosphate assay [11] can provide accuracy of better than 1% by using a sufficient number of replicates. For cholesterol, preparation of a stock solution in chloroform to 3 significant figure accuracy is readily achieved by use of an analytical balance and volumetric flask.
One dye pair among many that we have found to provide good data is dehydroergosterol (DHE)/C18:0-DiO. The FRET method can extract the equilibrium partition coefficient, Kp, from data, as originally discussed [2]. Fitting of DHE/C18:O-DiO data yields Kp = 6.1 and 0.12, respectively (values > 1 here mean favoring the Lα phase). A good fit to data implies absence of a significant “additional location” of the dyes, e.g. at domain interfaces. In fact, for dyes that are well-fit by a model of coexistence of two phases in DPPC/DLPC bilayers, poor fit to the data for a different mixture provides a strong warning that a picture of coexisting, well-defined phases might not adequately describe the phase behavior of a particular region of the phase diagram. An example of the latter is shown in Figure 4 for the binary mixture brain-sphingomyelin/DOPC, probed using FRET with DHE/perylene and with C18:2-DiO/C18:2-DiI. The fluorescence curves show no hint of enhanced FRET to indicate that dyes are co-localizing, as would be expected from the dye structures. We infer for brain-sphingomyelin/DOPC that the dye behaviors are not described by partition between two coexisting phases with the majority of the dye located within the two phases.
Figure 4.

In bilayers of brain-sphingomyelin/DOPC at 23C, expected Lα + Lβ phase separation is not shown by changes in FRET for either C18:2-DiO/C18:2-DiI (△) or DHE/perylene (◯).
2.3 The tie-line problem
In order to make quantitative use of FRET measurements by fitting data to find partition coefficients, the data must fall on a thermodynamic tie line. For a binary mixture, no ambiguity exists. However, for mixtures of 3 or more components, the tie lines are not known in advance and must be determined experimentally, even when phase boundaries can be readily identified from abrupt changes in fluorescence as a function of composition [12].
2.4 The cholesterol precipitation problem
Samples that contain cholesterol at mole fractions greater than ~ 0.4 require special attention. We and others have found that at room temperature, the step of sample preparation during which the lipid mixture exists as a dry film commonly results in precipitation of crystals of anhydrous cholesterol, which are characteristic of the dry lipid film but which are not in equilibrium with the fully hydrated bilayer that is actually of interest [13]. These cholesterol crystals do not re-dissolve into the bilayer during subsequent steps of sample preparation. The McElhaney laboratory [14] has solved this problem by warming samples to ~ 20C above the temperature of the highest melting lipid during solvent removal. Two other methods that have proven to be effective even at the highest cholesterol concentration in the bilayer of 66 mole % are rapid solvent exchange, or RSE [15], and lyophilization from a good solvent at reduced temperature, or low-temperature trapping, LTT [13].
2.5 Choosing dyes
Which dyes to use? In a favorable case, FRET for donors that separate from acceptors when phases coexist can reveal both phase boundaries. However, when the slope of the FRET curve within the 2-phase region happens to be an approximate match to the slope of the FRET curve just outside the 2-phase region, the boundary will not be well-determined. Figure 5 shows FRET from DHE to C18:2-DiO in the mixture brain-sphingomyelin /DOPC/cholesterol for samples prepared along constant mole fraction 0.55 of the sphingomyelin. The boundary of Lα + Lo coexistence, determined by use of GUV imaging, is shown by the arrow, but this boundary is not detected in this FRET experiment because the slope to the left of the boundary nearly matches the curve shape where FRET drops as the dyes separate in the 2-phase region. Sometimes this problem is solved when an entire data set that covers all of composition space is examined, allowing boundary extrapolation over a short distance compared with a longer stretch of well-determined boundary. But too often a given donor/acceptor pair do not provide sufficient sensitivity over some large regions of the phase diagram. In this case, in order to detect certain boundaries with good sensitivity, different dye pairs can be used, such as perylene/C18:0-DiI or DHE/C18:0-DiO, including cases where donor and acceptor concentrate together into the same phase, e.g. C18:0-DiO + C18:0-DiI or C18:2-DiO + C18:2-DiI.
Figure 5.

In 3-component mixtures of brain-sphingomyelin/DOPC/cholesterol at 23C, along a trajectory of sphingomyelin mole fraction fixed at 0.55, FRET from DHE to C18:2-DiO fails to reveal the boundary (marked by the arrow) of Lα + Lo coexistence.
2.6 Dye partition coefficients
The FRET experiment can make use of rather high concentrations of acceptor and donor probes in order to provide a large signal-to-noise ratio to clearly identify phase boundaries. However, the value of the FRET experiment is greater when all non-FRET contributions are eliminated, as discussed in 2.2. Then, these FRET data can be interpreted in terms of dye partition between coexisting phases. Thus, in addition to determination of phase boundaries, FRET data analysis can be interpreted to measure some characteristic properties of the phases, e.g. preference for longer or shorted hydrocarbon chains, double bonds vs saturated chains, ordered vs disordered [16].
2.7 Detection of “nanoscopic” domains
FRET measurements also detect phase boundaries when the size of the coexisting domains is not macroscopic, i.e. much smaller than the wavelength of visible light. A well-defined example of such a bilayer that has coexisting “nanoscopic” domains is the same DPPC/DLPC bilayer mixture that we have been considering, but now with the entire system confined to a sufficiently small size that the dimensions of any coexisting phases cannot be macroscopic. Bilayer vesicles that are extruded through a defined pore size polycarbonate filter, or else prepared by ethanol injection provide appropriately small vesicles. When a DPPC/DLPC mixture dissolved in ethanol is injected into rapidly stirred buffer, the resulting single-bilayer vesicles are on the order of 30 nm diameter [17]. The size of coexisting domains when e.g. 5% of one phase has formed (i.e. detection of a small amount of a second phase) must be smaller than ~ 7 nm diameter. Figure 6 shows a FRET experiment for this case. Clearly, domains on the order of 7 nm diameter are readily detected.
Figure 6.

In mixtures of DPPC/DLPC, in ~ 30 nm diameter vesicles prepared by ethanol injection into buffer, FRET from C18:2-DiO to C20:O-DiI clearly reveals the boundaries of Lα + Lβ coexistence (arrows), even though size of some phase domains is “nanoscopic”.
For 3-component mixtures of DPPC/DLPC/cholesterol, at cholesterol concentrations greater than ~ 16 mole %, GUVs labeled with various fluorescent dyes appear to be uniform. Figure 7 shows a GUV labeled with a red-orange fluorescent dye C20:0-DiI together with a green fluorescent dye, Bodipy-PC at 17% cholesterol and [DPPC] = 70% of the total PC. However, FRET experiments such as those shown in Figure 8 suggest that coexisting phase domains still provide distinct environments that enable fluorescent dyes to separate from each other, with a consequent loss of FRET, even for bilayers that do not show macroscopic phase separation. The uniformly-labeled GUV shown in Figure 7 essentially describes the appearance of bilayers at the sample point shown by the filled circle in Figure 8, within a region of “nanoscopic” phase coexistence that is not revealed by vesicle imaging.
Figure 7.

A giant unilamellar vesicle of composition DPPC/DLPC/cholesterol = .58/.25/.17, labeled with Bodipy-PC and with C20:0-DiI shows uniform fluorescence when examined by confocal fluorescence microscopy. The bar shows 5 microns.
Figure 8.

FRET in mixtures of DPPC/DLPC/cholesterol at 23C, at constant cholesterol mole fraction = 0.175, is measured as DPPC/DLPC is varied. Donor/acceptor are C18:2-DiO/C20:0-DiI. Phase boundaries are shown by the arrows.
3. SINGLE DYE FLUORESCENCE TO DETECT BOUNDARIES
3.1 General principles
A second fluorescence method makes use of any fortuitous differences in the fluorescence value of a single dye between bilayer compositions that are in equilibrium when phases separate. This experiment is thus even more simple than is a FRET experiment. Whatever the details of the fluorescence difference, the detection of the fluorescence differences can determine the phase boundaries, and Kp can be extracted from the shape of the curve. In general, chromophores located in the interfacial region of the bilayer (DiO, DiI, DiD, headgroup rhodamine and NBD labels and other polar chromophores) are good candidates to respond to changes in the properties both within a single phase and to changes between phases.
3.2 The self-quenching problem
Consider again the bilayer mixture DPPC/DLPC. The behavior of the single dye C18:0-DiI is shown in Figure 9. The curve is well-fit by partition between boundaries at χDPPC = 0.26 and 0.84, with C18:0-DiI at a concentration of 1 dye/10,000 total lipids (open circles) showing a preference of 5-6 -fold in favor of the Lβ over the Lα phase. At the higher concentration of 1 dye/500 total lipids (triangles) deviation is observed from the simple model of partition between coexisting phases. Self-quenching of the dye strongly affects the shape of the fluorescence within the region of 2-phase coexistence, and must be considered for proper data interpretation. Fluorescent dyes vary greatly in extent of self-quenching. In general, the dependence of fluorescence on dye concentration is a function of the extent of nonrandom mixing of the dye within each phase, the dye photophysical parameters, and the value of the partition coefficient.
Figure 9.

In mixtures of DPPC/DLPC at 23C, fluorescence of the single dye C18:0-DiI can be fit to a simple partition model. At 1 dye/10,000 total lipids, the fit yields a Kp of 0.15 (dye favors Lβ) (◯). At 1 dye/500 total lipids, self-quenching of the DiI distorts the fluorescence curve (△). Fitting the curve yields the misleading value of Kp = 0.74.
Two other dyes that also have the same indocarbocyanine chromophore but with different alkyl chains, C18:2-DiI and C20:0-DiI, are shown at a concentration of 1 DiI/250 lipids over the same range of DPPC/DLPC compositions in Figure 10. These dyes partition with even stronger preference between the coexisting phases than does C18:0-DiI, and therefore they show more pronounced deviation from the behavior of dilute dyes that partition between coexisting phases. An important point about this self-quenching is that for such high dye concentrations, a large portion of the fluorescence is lost when a small amount of the phase appears into which the dye preferentially partitions. But these would be precisely the samples identified as being near the boundary of a 2-phase region. In giant vesicles imaged using such high dye concentrations and used to determine phase boundaries, one of the boundaries is likely to be wrong. A second point is that an experimentally determined dependence of fluorescence on dye concentration can be a confirmation of the general model that two phases coexist with dye partitioning between them.
Figure 10.

In mixtures of DPPC/DLPC at 23C, fluorescence of single dyes shows dramatic self-quenching at dye concentrations of 1 dye/250 total lipids. C20:0-DiI (△), C18:2-DiI (◯). The boundaries of the Lα + Lβ 2-phase coexistence are shown by the vertical dotted lines.
Conclusions
For a 3-component lipid bilayer mixture, mapping the phase behavior over all of composition space at sufficient resolution to identify straight lines and small phase regions requires ~ 1000 samples. Among the few techniques that are practical for study of such large numbers of samples are the fluorescence techniques, FRET and single-dye fluorescence. These have sufficient sensitivity to phase changes, as well as short measurement time. Moreover, both FRET and single-dye fluorescence can detect separation of phase domains that are “nanoscopic”: much smaller than the wavelength of visible light.
Acknowledgments
The authors are grateful for the assistance of Adam Hammond in the preparation of the figures. This work was supported by grants to GWF from the National Science Foundation (MCB-0315330) and the donors of the Petroleum Research Fund of the American Chemical Society (38464-AC7).
Footnotes
We would like to add that one fluorescence method that we do not discuss here, fluorescence quenching by a spin-labeled lipid, has been shown to detect the existence of domains that are compositionally distinct on the scale of nanometers [6,7]. This is smaller than the size scale needed for detection by FRET, which requires domains on the order of 5 - 10 nanometers for detection. In the fluorescence quenching experiment, one of the lipid components is typically a spin-labeled fluorescence quenching lipid, rather than a lipid chosen for physical or biological relevance.
References
- [1].Tenchov BG. Nonuniform Lipid Distribution in Membranes. Prog. Surf. Sci. 1985;20:275–340. [Google Scholar]
- [2].Feigenson GW, Buboltz JT. Ternary Phase Diagram of Dipalmitoyl-PC/Dilauroyl-PC/Cholesterol: Nanosocpic Domain Formation Driven by Cholesterol. Biophys. J. 2001;80:2775–2788. doi: 10.1016/S0006-3495(01)76245-5. [DOI] [PMC free article] [PubMed] [Google Scholar]
- [3].Dietrich C, Bagatolli LA, Volovyk AN, Thompson NL, Levi M, Jacobson K, Gratton E. Lipid rafts reconstituted in model membranes. Biophys. J. 2001;80:1417–1428. doi: 10.1016/S0006-3495(01)76114-0. [DOI] [PMC free article] [PubMed] [Google Scholar]
- [4].Samsonov VV, Mihalyov I, Cohen FS. Characterization of cholesterolsphingomyelin domains and their dynamics in bilayer membranes. Biophys. J. 2001;81:1486–1500. doi: 10.1016/S0006-3495(01)75803-1. [DOI] [PMC free article] [PubMed] [Google Scholar]
- [5].Veatch SL, Keller SL. Separation of Liquid Phases in Giant Vesicles of Ternary Mixtures of Phospholipids and Cholesterol. Biophys. J. 2003;85:3074–3083. doi: 10.1016/S0006-3495(03)74726-2. [DOI] [PMC free article] [PubMed] [Google Scholar]
- [6].London E, Feigenson GW. Fluorescence Quenching in Model Membranes. 1. Characterization of Quenching Caused by a Spin-Labeled Phospholipid. Biochemistry. 1999;20:1932–1938. doi: 10.1021/bi00510a032. (1981) [DOI] [PubMed] [Google Scholar]
- [7].Ahmed SN, Brown DA, London E. On the Origin of Sphingolipid/Cholesterol-Rich Detergent Insoluble Cell Membranes: Physiological Concentrations of Cholesterol and Sphingolipid Induce Formation of a Detergent-Insoluble, Liquid-Ordered Phase in Model Membranes. Biochemistry. 1997;36:10944–10953. doi: 10.1021/bi971167g. [DOI] [PubMed] [Google Scholar]
- [8].Van Dijck PWM, Laper AJ, Oonk MAJ, de Gier J. Miscibility properties of binary phosphatidylcholine mixtures. Biochim. Biophys. Acta. 1977;470:58–69. doi: 10.1016/0005-2736(77)90061-x. [DOI] [PubMed] [Google Scholar]
- [9].Silvius JR. Fluorescence Energy Transfer Reveals Microdomain Formation at Physiological Temperatures in Lipid Mixtures Modeling the Outer Leaflet of the Plasma Membrane. Biophys. J. 2003;85:1034–1045. doi: 10.1016/S0006-3495(03)74542-1. [DOI] [PMC free article] [PubMed] [Google Scholar]
- [10].Kuntz E, Bishai F, Augenstein L. Quantitative emission spectroscopy in media where appreciable light scattering occurs. Nature. 1966;212:980–983. [Google Scholar]
- [11].Kingsley PB, Feigenson GW. The Synthesis of a Perdeuterated Phospholipid: 1,2-Dimyrsitoyl-sn-Glycero-3-Phosphocholine-d72. Chem. Phys. Lipids. 1979;24:135–147. [Google Scholar]
- [12].Chiang Y-W, Zhao J, Wu J, Shimoyama Y, Freed JH, Feigenson GW. New method of determining tie-lines in coexisting membrane phases using spin-label ESR. Biochim. Biophys. Acta. 2005;1668:99–105. doi: 10.1016/j.bbamem.2004.11.010. [DOI] [PubMed] [Google Scholar]
- [13].Huang J, Buboltz JT, Feigenson GW. Maximum solubility of cholesterol in phosphatidylcholine and phosphatidylethanolamine bilayers. Biochim.Biophys.Acta. 1417:89–100. doi: 10.1016/s0005-2736(98)00260-0. [DOI] [PubMed] [Google Scholar]
- [14].McMullen TPW, Lewis RNAH, McElhaney RN. Calorimetric and spectroscopic studies of the effects of cholesterol on the thermotropic phase behavior and organization of a homologous series of linear saturated phosphatidylethanolamine bilayers. Biochim. Biophys. Acta. 1999;1416:119–134. doi: 10.1016/s0005-2736(98)00214-4. [DOI] [PubMed] [Google Scholar]
- [15].Buboltz JT, Feigenson GW. A novel strategy for the preparation of liposomes: rapid solvent exchange. Biochim.Biophys.Acta. 1999;1417:232–245. doi: 10.1016/s0005-2736(99)00006-1. [DOI] [PubMed] [Google Scholar]
- [16].Vaz WLC, Melo E. Fluorescence spectroscopic studies on phase heterogeneity in lipid bilayer membranes. J. Fluor. 2001;11:255–271. [Google Scholar]
- [17].Batzri S, Korn ED. Single Bilayer Liposomes Prepared without Sonication. Biochim. Biophys. Acta. 1973;298:1015–1019. doi: 10.1016/0005-2736(73)90408-2. [DOI] [PubMed] [Google Scholar]