

Abstract
A new class of water-soluble C60 transfecting agents has been prepared using Hirsch−Bingel chemistry and assessed for their ability to act as gene-delivery vectors in vitro. In an effort to elucidate the relationship between the hydrophobicity of the fullerene core, the hydrophilicity of the water-solubilizing groups, and the overall charge state of the C60 vectors in gene delivery and expression, several different C60 derivatives were synthesized to yield either positively charged, negatively charged, or neutral chemical functionalities under physiological conditions. These fullerene derivatives were then tested for their ability to transfect cells grown in culture with DNA carrying the green fluorescent protein (GFP) reporter gene. Statistically significant expression of GFP was observed for all forms of the C60 derivatives when used as DNA vectors and compared to the ability of naked DNA alone to transfect cells. However, efficient in vitro transfection was only achieved with the two positively charged C60 derivatives, namely, an octa-amino derivatized C60 and a dodeca-amino derivatized C60 vector. All C60 vectors showed an increase in toxicity in a dose-dependent manner. Increased levels of cellular toxicity were observed for positively charged C60 vectors relative to the negatively charged and neutral vectors. Structural analyses using dynamic light scattering and optical microscopy offered further insights into possible correlations between the various derivatized C60 compounds, the C60 vector/DNA complexes, their physical attributes (aggregation, charge) and their transfection efficiencies. Recently, similar Gd@C60-based compounds have demonstrated potential as advanced contrast agents for magnetic resonance imaging (MRI). Thus, the successful demonstration of intracellular DNA uptake, intracellular transport, and gene expression from DNA using C60 vectors suggests the possibility of developing analogous Gd@C60-based vectors to serve simultaneously as both therapeutic and diagnostic agents.
Keywords: C60, fullerenes, nonviral vector, gene transfection, cytotoxicity
Introduction
Delivery of exogenous nucleic acids such as DNA into cells (transfection) holds great promise for disease prevention and therapy (aka: gene therapy).(1) Genetic material delivered into the cell modifies the function of such cells generally by altering the production of proteins. The selection of appropriate DNA carriers is a common problem for gene therapy, and better gene delivery agents are still being sought. Viral vectors (such as retroviral, lentiviral, adenoviral) and nonviral vectors (such as liposomal and polymeric) have both been used as gene delivery agents in the past. Although viral vectors are efficient carriers due to their natural ability to penetrate cells, they have also often been shown to provoke undesirable immune responses, thus limiting their usefulness.(2) Nonviral vectors often prove less immunogenic, but improvement is needed to increase their overall transfection efficiency. To increase such efficiency, effort should be directed at increasing the vector’s ability to promote efficient DNA condensation, intracellular transport, and sustained gene expression. Additionally, the cytocompatibility of nonviral vectors must be well understood before they can be further optimized and become a viable option for gene therapy.3–7
Fullerene (C60) derivatives have been extensively studied for a variety of medical applications(8) including their use as neuroprotective agents,(9) HIV-1 protease inhibitors,(10) bone-disorder therapy agents,(11) X-ray contrast agents,(12) and slow-release agents for drug delivery.(13) Recently, C60-based reagents have also been examined as DNA transfection vectors and tested for the ability to mediate gene transfer.14–18 These first generation C60-based transfection vectors have shown promise, but a few have also exhibited high cytotoxicity.(16) As many of the C60 derivatives previously described in the literature have only been slightly soluble in aqueous solutions, it has also been suggested that one possible reason for such observed cytotoxicity was due to the use of organic solvents that were necessary to dissolve those first generation C60-based transfection agents.14,16 Thus, the search for new materials and enhanced protocols are key objectives in the continuing development of C60-based transfection vectors, including the design, construction, and testing of new reagents that are water soluble and able to effect enhanced gene delivery without promoting significant cytotoxicity.
Herein we report transfection efficiencies, cytotoxicity profiles, and biophysical structure/activity studies for a new class of water-soluble C60 vectors prepared using the Hirsch−Bingel reaction19,20 which is one of the simplest, highest-yielding, and most versatile C60 functionalization methods known. As shown in Figure 1, the structurally derivatized C60 vectors reported herein were synthesized to yield either positively charged, negatively charged, or neutral chemical structures when solvated under physiological conditions. These vectors, which have been analyzed for their ability to promote DNA transfection, offer the opportunity to elucidate the roles that hydrophobicity (due to the fullerene core), hydrophilicity (due to the water soluble substituents), and overall charge state displayed by the C60 derivatives have on DNA transfection, gene expression, and cytotoxicity.
Figure 1.

Depiction of the structures of the derivatized C60 vectors; the positively charged amino-C60 compounds (I−IV), the neutral serinolamide-C60 compound (V), and the negatively charged C3-C60 compound (VI) (chemical structures depicted at neutral pH in aqueous solution; counterions in solution not shown).
Experimental Section
Materials
All compounds were reagent grade or better. C60 was purchased from MER Corporation (Tucson, AZ). All solvents were HPLC grade purchased from Fisher (Pittsburgh, PA). Materials for culturing cells, including Dulbecco’s modified Eagle’s medium (DMEM), trypsin, and phosphate buffer saline (PBS), were obtained from Gibco (Gibco Life, Grand Island, NY). Complete osteogenic medium containing minimum essential medium (MEM), 10 mM β-glycerophosphate, 50 µg/mL ascorbic acid, and 10 vol % fetal bovine serum was obtained from Gemini Bio-Products (Calabasas, CA). Cytopure was purchased from Q-Biogene (Solon, OH). A plasmid DNA (7.2 kbp) containing the gene for a red-shifted wavelength variant of the enhanced green fluorescent protein (eGFP) under the transcriptional control of the cytomegalovirus (CMV) immediate-early gene promoter was used as the DNA construct from which reporter gene expression was measured in the transfection assays. Plasmid DNA was prepared in bulk from transformed bacterial sources and purified to homogeneity using commercial kits (Qiagen; Germantown, MD) employing anion-exchange chromatography.
C60 Sample Preparation
The amino-C60 adducts (I−IV), the seri-C60 adduct (V), and the C3-C60 adduct (VI) were synthesized and characterized according to previously published procedures.21–23 Compounds I−V were mixtures of regioisomers.
Stock solutions of individual compounds I−VI were prepared by weight and filtered for sterilization using a cellulose acetate membrane filter (0.2 µm pore diameter) prior to use in forming transfection mixtures. Standard solutions were prepared at a concentration 10 µg/µL for each of these compounds in both tris EDTA (TE) solution (10 mM tris, 1 mM EDTA, pH = 7.4), and in serum-free DMEM in separate reaction vials.
Cell Culture
NIH 3T3 mouse fibroblast cells (ATCC # CRL-1658) and HEK 293 cells (human embryonic kidney; ATCC # CRL-1573) were cultured in DMEM containing 10% FBS in a 5% CO2 atmosphere at 37 °C prior to collection and plating in individual assay wells used for transfection studies. For subculture of cells, routinely on reaching 80% confluence, the cells were washed with PBS, detached using trypsin-EDTA, harvested by centrifugation, resuspended in culture medium and counted in a Coulter counter prior to plating in multiwell dishes for subsequent transfection assays. Marrow stromal cells (MSCs) were harvested from Wistar rats as previously described.(24) MSCs were cultured for 6 days in the presence of 10−8 M dexamethasone in complete osteogenic media before use in transfection studies and cultured under identical environmental conditions to 3T3 and HEK 293 cells.
Preparation of Solutions for the Transfection Studies
Mixtures of individual derivatized C60 vector material and plasmid DNA were allowed to form a complex in serum-free DMEM, as described below, prior to adding to cells in the transfection assays. Each C60-vector solution was added dropwise to a solution of plasmid DNA to obtain a final volume of 200 µL. Each resulting solution was then vortexed briefly and allowed to stand for 30 min at room temperature to allow complete assembly of the vector/DNA complex, which was then used immediately in the transfection experiment. The final DNA mass of each solution remained constant at 10 µg while the concentration of the C60 derivative was varied to obtain a range of C60-reagent-to-DNA-base-pair (bp) ratios (defined here as “R” values). The value of DNA mass was fixed at 10 µg per well since it showed the most optimum transfection among different DNA masses used (1−12 µg) for transfection at R = 16.8. Each solution was prepared in triplicate.
Transfection Experiments
NIH 3T3 cells, HEK 293 cells and MSCs were used for transfection studies. Transfections of NIH 3T3 cells were carried out with C60/DNA complexes in a range of R values (0.42−42). For HEK 293 cells and MSCs, transfections were performed only at R = 4.2 and R = 16.8. Cells were plated at 40,000 cells/cm2 in 96 well tissue culture plates and incubated overnight to permit cell attachment to the well surface. The culture medium was then replaced by the serum-free transfection mixture for various time periods (2 h, 8 h, 24 or 48 h) (transfection time). After exposing the cells for the respective periods of time to the serum-free transfection mixture, the cells were washed with PBS and the medium was replaced with complete medium (containing FBS). The cells were then further incubated for 8 h, 24 or 48 h (incubation time) before GFP fluorescence was measured using a flow cytometer. For comparative purposes, control cell populations were also transfected with plasmid DNA alone (no C60 vector), or with plasmid DNA complexed with an optimal level of one of two commercially available transfection reagents; such that the DNA was complexed with either 25 kDa polyethylenimine (PEI), or with Cytopure transfection reagent, which is reported by the manufacturer to exhibit very low levels of cytotoxicity. The DNA/PEI complexes were assembled using a well-established protocol(25) and the cytopure/DNA complexes were assembled as per the manufacturer’s instructions and optimized to obtain an optimal level of DNA transfection/GFP expression within the NIH 3T3 cell type. Below is a brief description of the conditions which gave the optimal level of transfected NIH 3T3 cells using 25 kDa PEI and Cytopure. For PEI, the polymer was dissolved in PBS as 1 mg/mL stock solution. DNA/polymer complexes were prepared in serum-free DMEM to achieve a ratio of polymer to DNA of 4. The complexes (100 µL) were then incubated at 25 °C for 10−15 min and then added to cell wells that contained 100 µL of serum-free DMEM. For Cytopure, 1.1 µL of Cytopure stock was diluted to 50 µL with serum-free DMEM. The Cytopure mixture was then added slowly to 1 µg of DNA diluted to 50 µL with serum-free DMEM. The transfection mixture was vortexed, left standing for 15 min at room temperature and added to cell wells that contained 100 µL of serum-free DMEM. After 24 h of transfection, the cells were washed and the medium was replaced with the serum-containing medium.
For purposes of this study, a “positive transfection” result was defined to be “expression of GFP”, not simply plasmid DNA uptake into cells. As such, successful “transfection” as described herein also relates to cell viability for sufficient time to ensure GFP gene expression, which was determined by cell fluorescence levels above a defined background threshold level (determined using nontransfected cells to set lower detection limit parameter) with flow cytometry. Cells were prepared for flow cytometry by trypsinization after being washed with sterile PBS to remove cell debris and any residual gene-delivery agents. Cells were then analyzed using flow cytometry (Beckmann-Coulter). Cells that were transfected successfully expressed GFP protein and were detected at 470/515 nm (excitation/emission) by the flow cytometer.
Transfection efficiency has been determined as the percent of cells that express GFP per study sample relative to the total number of cells passing through the flow cytometer per study sample (10,000 events counted for each transfection sample).(25)
Preparation of Solutions for Cytotoxicity Studies
The C60/DNA complex solutions were prepared as described above. C60 vector solutions without DNA (0−10 µg/µL) were prepared by diluting the C60 stock solution with serum-free DMEM.
Cytotoxicity Experiments
All cytotoxicity studies were performed on NIH 3T3 cells. The concentration of cultured cells was determined prior to cell plating using a Coulter counter and the cells were plated on 96 well clear-bottom plates at a density of 40,000 cells/cm2. After incubating overnight to allow cell attachment, the medium in each well was replaced either with 200 µL of the C60 vector alone or with C60 vector/DNA solutions prepared as described above. The cells were exposed to the solutions for either 2, 8 or 24 h before the cytotoxicity was determined. Control cell samples were plated and grown under identical conditions as those described for treated cell samples, with the exception that neither C60 compounds nor transfection mixtures were added to the control cells. All transfection and control experiments were performed and analyzed in triplicate as described below.
The LIVE/DEAD viability/cytotoxicity assay (Molecular probes, Eugene, OR) was used to determine cytotoxicity levels in cells treated with either C60-vector or C60-vector/DNA solutions. This assay makes use of 2 different fluorescent dyes, calcein AM and ethidium homodimer (EThD-1), to measure the number of live and dead cells respectively. The lipid permeable dye, calcein AM, when taken up by living cells with intact plasma membranes, emits green fluorescence (excitation/emission: 495/515 nm) upon being cleaved by esterase enzymes in the cells. Conversely, the EThD-1 dye emits red fluorescence (excitation/emission: 528/617 nm) on binding to nucleic acids released from dead cells, and is excluded by the intact cell membranes of viable cells. This assay was preferred over the 3-(4,5-dimethylthiazol-2-yl)-2,5-diphenyltetrazolium bromide (MTT) assay for evaluation of cell viability because C60-vectors compounds I and II interacted and attached to the MTT-formazan making the formazan crystals insoluble for the next colorimetric assay. Similar effects have been reported for single-walled carbon nanotubes.(26) The reagents were prepared and added to the wells according to the manufacturer’s guidelines. At the time points indicated, the media from the wells was aspirated and replaced with the LIVE/DEAD reagent, after washing the cells with PBS. The plates were then incubated in the dark at room temperature for additional 30 min before being measured for fluorescence.
Fluorescence of each sample well was measured by using a fluorescent microplate reader (TECAN Safire2). Fluorescence of each sample well was normalized to percent of both LIVE (no C60 compounds or transfection mixtures treatment condition) and DEAD (70% methanol treated) control cell groups. These normalized fractions are defined as the fraction of live and dead cells, respectively, in each of the C60-treated samples. Since GFP fluorescence has excitation/emission wavelengths of 470/515 nm, close to that of calcein AM, there was a possibility that GFP fluorescence could interfere with the calcein AM (LIVE) measurement leading to potential errors for those wells containing C60 vector/DNA mixtures. Thus, a baseline fluorescence intensity of each sample well at 495/515 nm was obtained before the addition of the live cell/dead cell dyes. This intensity was then subtracted from the final calcein AM detection intensity.
Dynamic Light Scattering
For the dynamic light scattering (DLS) experiments, a standard solution with concentration 10 µg/µL of each of the C60 vectors was prepared in each of these solvents: HPLC grade water, 10 mM Tris/EDTA solution, and serum-free DMEM. These solvents were filtered through a 0.22 µm syringe filter (Millpore, MILLEX- GP) prior to use. The size of standard 100 nm polystyrene beads in Tris/EDTA solution and in serum-free DMEM was measured to confirm that no discrepancies were detected with the data acquisition system.
DLS measurements were conducted using a Wyatt Technologies Dawn EOS instrument equipped with a quasi-elastic light scattering interface module (Wyatt QELS unit). The scattering angle used for detection was 90° at a constant temperature of 25 °C. A 30 mW GaAs laser at λ = 690 nm was used. Data analysis and size distribution computations were performed using the vendor supplied software (Astra V) and a multi-τ digital recorder (Wyatt QELS).
Statistics
Statistical analysis was performed between groups for the live/dead assay and for flow cytometry studies. The results are reported as means ± standard deviation. Groups were analyzed by ANOVA with significance defined by a p-value < 0.05, and pairwise comparison was performed using the Tukey test. The cytotoxicity studies had four samples per group, and the transfection studies had three samples per group.
Results and Discussion
Initial screening was performed on each of the six different derivatized C60 samples, compounds I−VI (Figure 1). The different C60-vector/DNA complexes were assembled at various R values (0.42−42) and each analyzed for its ability to affect transfection in NIH 3T3 cells under serum-free conditions. Serum-free conditions were used in these studies to ensure that derivatized nanomaterial/DNA complexes were not compromised by serum lipids and/or proteins, and that the DNA complexes were imported into the cells based on the individual physical properties of the complexes themselves, without the potential aid of serum proteins acting as carrier. The best transfection efficiencies were routinely observed after allowing transfection mixtures to remain on cells for 24 h (transfection time), then removing the transfection mixtures and incubating cells for an additional 24 h (incubation time) in the presence of serum for maximal gene expression to be detected. Unless otherwise noted, all transfection efficiency data presented below were for cells transfected for 24 h under serum-free conditions and incubated for an additional 24 h in the presence of serum. All C60-conjugated transfection mixtures showed the ability to transfect cells with exogenous DNA with statistically significant differences relative to unconjugated DNA alone (naked DNA) (Table 1). “Transfection efficiency” as reported in Table 1 is defined as the ratio of GFP-positive cells as determined by fluorescence under flow cytometry per total number of cells counted in the flow cytometer. No statistical difference was observed between the transfection efficiencies of the different groups at R = 0.42 and R = 4.2. For R values above 4.2, compounds III and IV exhibited a statistical difference in transfection efficiencies compared to the other compounds. Both of these compounds exhibited an increased transfection efficiency relative to the other C60 compounds studied, with a maximum transfection efficiency of 31% at R = 16.8. At larger values of R the efficiency dropped off. At R = 16.8, their transfection efficiencies were comparable to that of 25 kDa PEI containing and Cytopure transfection reagent containing complexes. 25 kDa PEI is a widely used and well-studied nonviral vector, while Cytopure is a biodegradable polymeric transfection reagent that exhibits very low cytotoxicity and is reported to work on a broad spectrum of cell types, including hard-to-transfect primary cell isolates.
Table 1. Transfection Efficiencies of C60/DNA Transfection Mixtures at Various R Values Presented as a Quotient of GFP-Fluorescent Cells Relative to the Total Number of Cells Analyzed as Measured by Flow Cytometrya.
| transfection efficiency (%) at various R values |
|||||
|---|---|---|---|---|---|
| C60 vector | R = 0.42 | R = 4.2 | R = 8.4 | R = 16.8 | R = 42 |
| IV | 0.53 ± 0.13 | 0.42 ± 0.18 | 1.32 ± 0.57 | 31.33 ± 4.24 | 2.40 ± 0.13 |
| III | 0.43 ± 0.31 | 0.37 ± 0.21 | 0.99 ± 0.15 | 28.33 ± 4.94 | 1.86 ± 0.24 |
| II | 0.30 ± 0.20 | 0.58 ± 0.14 | 0.60 ± 0.13 | 0.32 ± 0.06 | 0.41 ± 0.17 |
| I | 0.27 ± 0.15 | 0.45 ± 0.28 | 0.62 ± 0.10 | 0.34 ± 0.04 | 0.43 ± 0.14 |
| V | 0.17 ± 0.12 | 0.36 ± 0.27 | 0.23 ± 0.10 | 0.11 ± 0.03 | 0.09 ± 0.05 |
| VI | 0.27 ± 0.21 | 0.15 ± 0.06 | 0.48 ± 0.25 | 0.10 ± 0.01 | 0.14 ± 0.04 |
| naked DNA | 0.01 ± 0.005 | ||||
| PEI (25 kDa) | 28.7 ± 3.5 | ||||
| Cytopure | 35.2 ± 5.1 | ||||
10,000 events were counted for each sample. C60 vectors are listed in order of their measured efficiency at promoting transfection in NIH 3T3 cells under serum-free conditions.
To assess the transfection ability of C60 vectors in different cell types, studies were also performed on two other cell types: HEK 293 cells and MSCs. HEK 293 cells were chosen since they are another standard cell line used routinely for transfection assays, while MSCs were chosen due to their eminence as primary cells for tissue engineering. Based on the initial screening results of each of the various derivatized C60 compounds for transfection-promoting ability in NIH 3T3 cells as reported in Tables 1 and 2, transfection studies were also performed on HEK 293 cells and MSCs using compounds III and IV at ratios of R = 4.2 and R = 16.8. Table 2 lists the transfection efficiencies obtained for such studies. HEK 293 cells exhibited increased transfection efficiency with an increase in R values. However, HEK 293 cells' transfection efficiencies were lower than those observed for NIH 3T3 cell at similar R values. MSCs exhibited low transfection efficiencies overall, and no increase in transfection efficiency was observed with increase in R values. Transfected cells were visualized by fluorescence microscopy for morphological analysis after transfection (micrographs not shown). Positive transfection of cells with the plasmid coding for green fluorescent protein could be easily discerned by this technique. However, variations in transfection efficiency among the different cell types tested here is not surprising, as cell type is a major factor in determining the level of transfection and gene expression from nonviral vectors as noted previously.(27) Differences in cell characteristics, such as cell mitosis rates, can play an important role in transgene expression, and may explain the differences in the level of gene expression among the various cell lines studied here.28,29
Table 2. Comparison of Transfection Efficiencies for Octa-Amino C60 Compound III and Dodeca-Amino C60 Compound IV at R = 4.2 and R = 16.8 for NIH 3T3 Cells, HEK 293 Cells and MSCs under Serum-Free Transfection Conditionsa.
| transfection efficiencies (%) |
||
|---|---|---|
| cell line studied at distinct R-values | III/DNA | IV/DNA |
| NIH 3T3 (R = 4.2) | 0.37 ± 0.21 | 0.42 ± 0.18 |
| NIH 3T3 (R = 16.8) | 28.33 ± 4.94 | 31.33 ± 4.24 |
| HEK 293 (R = 4.2) | 0.54 ± 0.08 | 0.60 ± 0.10 |
| HEK 293 (R = 16.8) | 7.66 ± 0.22 | 10.05 ± 0.03 |
| MSC (R = 4.2) | 0.09 ± 0.03 | 0.39 ± 0.03 |
| MSC (R = 16.8) | 0.05 ± 0.01 | 0.07 ± 0.02 |
Transfection efficiency values are presented as a quotient of GFP (+) cells relative to the total viable cells present in the transfected sample well as measured by flow cytometry. [10,000 events were counted for each sample.]
Figures 2 a, b and c display the fraction of viable NIH 3T3 cells as a function of the C60 vector (no DNA present) concentration after 2, 8, or 24 h post-treatment incubation times, respectively. Incubation with C60 compounds for 2 h resulted in a viable cell fraction greater than 50% for all C60 vector solutions. Lowest overall cell viability was observed with compound I (0.55 ± 0.08) at 10 µg/µL, and no statistically significant increase in cell viability was observed with decreasing compound I concentration. For all other C60 compounds tested, there was a general trend of increased cell viability with decreased C60 compound concentration.
Figure 2.

Fraction of live NIH 3T3 cells after incubation with the different C60 vectors as a function of derivatized fullerene concentration after (a) 2 h, (b) 8 h, or (c) 24 h C60-incubation times respectively, under serum-free conditions. Error bars represent mean ± standard deviation for n = 4.
At the 8 h C60 incubation time, the fraction of live cells was higher than 50% for all C60 solutions tested except those exposed to compound I. For compound I, the cell viability was the lowest (0.51 ± 0.04) at 10 µg/µL, but no statistically significant increase in cell viability was observed with decreasing compound I concentration. For all other C60 vectors, there was a general trend of increased cell viability with decreased compound concentration, but at each compound concentration tested, the cell viability was lower in the 8 h time point than in the corresponding sample concentration at the 2 h time point.
At the 24 h C60 incubation time point, only cells treated with compounds III and IV exhibited greater than 50% cell viability at all concentrations tested, with an increase in cell viability with decreased C60 compound (III and IV) concentration. All other compounds showed a general trend of increased viability with a decrease in compound concentration, with cell viability values lower than 50% at 10 µg/µL.
Figures 3 a, b and c display the cell viability of NIH 3T3 cells cultured in the presence of the various C60-vector/DNA mixtures as a function of both C60 compound concentration and R values after 2, 8 or 24 h post-transfection time, respectively. Cell viability at the two hour post-transfection time point for compound I/DNA and compound II/DNA mixtures increased from 0.19 ± 0.0 at 10 µg/µL (R = 42) to 0.70 ± 0.15 at 0.1 µg/µL (R = 0.42). The fraction of live cells was greater than 50% for all other C60 derivative/DNA solutions at the 2 h post-transfection time point.
Figure 3.

Fraction of live NIH 3T3 cells after incubation with the different C60/DNA transfection mixtures as a function of C60 compound concentration and varying R value after (a) 2 h, (b) 8 h, or (c) 24 h post-transfection incubation time, under serum-free conditions respectively. Error bars represent the mean ± standard deviation for n = 4.
At the 8 h post-transfection time point, the fraction of live cells for compound I/DNA and compound II/DNA was less than 50% at all concentrations and R values tested. For all other samples, the trend was similar to that of the 2 h post-transfection time point, with cell viability greater than 50% and an increase in viability observed with a decrease in transfection mixture concentration.
At the 24 h time point, cells treated with the compound V/DNA mixture exhibited greater than 50% cell viability at all concentrations tested, while compound I/DNA, compound II/DNA exhibited less than 50% cell viability. Cells treated with compounds III/DNA, IV/DNA and VI/DNA mixtures resulted in cell viabilities less than 50% at 4 µg/µL (R = 16.8) and 10 µg/µL (R = 42), but greater than 50% viability when added at lower concentrations.
DLS and optical microscopy studies were performed to help elucidate the biophysical structure/activity relationships that might exist between the various C60 complexes. These studies were carried out to help generate correlations between the different C60 vectors, and the various C60 vector/DNA structural attributes resulting in the different transfection efficiencies and cytotoxicity results observed under serum-free conditions. Table 3 presents the DLS measurements on the various C60 vector compounds I−VI when dissolved alone in either water (4 µg/µL), in a 10 mM Tris/EDTA solution (4 µg/µL), in serum-free DMEM (4 µg/µL), or when dissolved in complex with DNA in 10 mM Tris/EDTA (4 µg/µL, R = 16.8) or as a complex with DNA in serum-free DMEM (4 µg/µL, R = 16.8). The concentration of 4 µg/µL was chosen for DLS experiments since compounds III and IV exhibited maximum transfection efficiency at this concentration of C60. The Rh values in Table 3 provide qualitative information about the transfection mixture aggregate behavior which can readily be seen in Figures 4 and 5. The Rh parameter obtained from the DLS measurements, and shown in Table 3, corresponds to the radius of a monodisperse hypothetical sphere having the same diffusion constant as that of the C60 compound aggregates or the C60/DNA mixture aggregates under study. The polydispersity index (PDI) provides a metric for describing the size distribution. PDI values between 0 and 0.05 indicate more monodisperse particles, and values above 0.05 indicate broadened size distributions.(30) Clearly, the Rh values shown in Table 3 for the various C60 compounds and C60/DNA complexes are average values for quite polydisperse populations of aggregates. Previous work by our group and others using atomic force microscopy (AFM) and cryo transmission electron microscopy (cryo-TEM) have shown that derivatized C60 compounds form aggregates that are irregularly shaped in solution.31,32 The Rh values observed for these C60 compounds and the C60/DNA mixtures suggests that these reagents also form such irregularly shaped aggregates when in aqueous solutions, including when dissolved in solutions of physiological ionic strength such as DMEM. Such qualitative information about the aggregate behavior provides valuable information for understanding the transfection and toxicity results, as discussed below.
Table 3. Hydrodynamic Radius (Rh) of the Different C60 Derivatives in Water (4 µg/µL), 10 mM Tris/EDTA Solution (4 µg/µL), Serum-Free DMEM (4 µg/µL), in Complex with DNA in 10 mM Tris/EDTA Solution (4 µg/µL, R = 16.8), and in Complex with DNA in Serum-Free DMEM (4 µg/µL, R = 16.8).
|
IV |
III |
II |
I |
V |
VI |
|||||||
|---|---|---|---|---|---|---|---|---|---|---|---|---|
| solutions | Rh (nm) | PDI | Rh (nm) | PDI | Rh (nm) | PDI | Rh (nm) | PDI | Rh (nm) | PDI | Rh (nm) | PDI |
| water | 50 | 0.43 | 47 | 0.51 | 126 | 0.33 | 650 | 0.55 | 90 | 0.39 | 72 | 0.37 |
| Tris EDTA | 35 | 0.33 | 33 | 0.40 | 83 | 0.29 | 446 | 0.46 | 51 | 0.42 | 58 | 0.22 |
| serum-free DMEM | 29 | 0.26 | 34 | 0.28 | 61 | 0.31 | 150 | 0.24 | 47 | 0.45 | 20 | 0.33 |
| in complex with DNA [Tris/EDTA] | 125 | 0.24 | 146 | 0.31 | 366 | 0.43 | 503 | 0.52 | 803 | 0.33 | 834 | 0.55 |
| in complex with DNA [serum-free DMEM] | 111 | 0.36 | 163 | 0.44 | 440 | 0.34 | 485 | 0.42 | 721 | 0.22 | 803 | 0.41 |
Figure 4.

Representative morphologies of NIH 3T3 cells and the C60/DNA complexes at R = 0.42 ten minutes after transfection. The optical images represent complexes formed with compound (a) I, (b) II, (c) III, (d) IV, (e) V, and (f) VI. All images are shown at the same magnification.
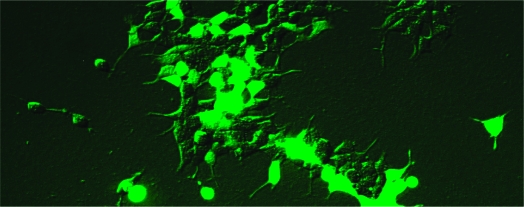
Figure 5.

Representative optical microscopy images of NIH 3T3 cells incubated with C60/DNA complexes formed using compounds (a) III and (b) VI at R = 0.42 twenty four hours post-transfection. All images are shown at the same magnification.
All C60 compounds display a broadly distributed aggregate size in each solvent tested (water, 10 mM Tris/EDTA solution, and serum-free DMEM). The compounds had aggregate sizes between 47 and 650 nm (PDI = 0.33−0.51) and between 33 and 446 nm (PDI = 0.29−0.46) in plain water and 10 mM Tris/EDTA solution, respectively. In the presence of DNA, there is an increase in Rh for all formulations. In general, the Rh values decrease in the order V, VI > I > II > III, IV in the presence of DNA. Presumably, this trend is the result of the influence of the various structures of the C60 derivatives on the condensation behavior of the DNA in the transfection mixture. In the case of cationic polymers, the condensation process with DNA has been thought to rely predominantly on electrostatic interactions with minor contributions from other interactions such as hydrophobic interactions, hydrogen bonding, and van der Waals forces.(5) In case of the positively charged C60 derivatives, the hydrophobicity of the C60 core, and electrostatic interactions between the water-soluble functional groups and the DNA are the main contributors to the condensation process.8,14,16 Compound I, with two adducts on the fullerene core, has less positive charge than the hexa-amino C60 adduct of compound II and the octa-amino adduct of compound III. Fewer electrostatic interactions between functionalized C60 vectors and the DNA sugar−phosphate backbone can lead to a decrease in condensation capacity, resulting in larger C60-vector/DNA complexes. Compound V, although polar, has no net charge at neutral pH; while compound VI will possess a negative charge, the same as that of DNA. Thus, for compounds V and VI, hydrophobicity is presumably the only interaction contributing to the formation of the DNA condensates, and this interaction appears insufficient to fully condense the DNA, leading to large C60 vector/DNA complex aggregates.
The relatively large sizes for the C60 vector/DNA complexes, and in particularly for those formed from compounds I, II, V and VI, may be a reason for the poor transfection efficiencies observed with these compounds. This may also be a reason for the low transfection efficiency reported for a similar positively charged amino-C60 compound with a monoadduct on the fullerene core.(17) However, increased positive charge-state alone is insufficient to solely predict increased transfection capability of amino-derivatized fullerenes. Variation in transfection protocol and/or cell types can also dramatically affect transfection efficiencies, as positively charged amino-derivatized C60 similar to compound IV have previously been shown to be inefficient at effecting transfection.(17) In general, the condensation behavior of nonviral vector/DNA complexes is governed by several factors including the molecular weight of the DNA condensing agent, the density of the charges on the condensing agent, and the ratio of composition (R values) between the condensing vector and the DNA.(5) In addition, it is now well-documented that the size of the transfection vector/DNA complex is one of the most important parameters for efficient DNA delivery into cells, with the most efficient uptake observed for complex with sizes <150−200 nm in diameter.(5) The Rh values shown in Table 3 suggest that only DNA complexes formed with compounds III and IV satisfy these criteria.
On addition of the C60-vector/DNA complexes to cells, the complexes formed with compounds I and II immediately aggregated further to form large clusters, even at the lowest R value tested of 0.42. Figure 4a−f shows the optical microscopy images of all C60-vector/DNA complexes at R = 0.42 ten min after their addition to NIH 3T3 cells. Large, irregularly shaped aggregates (shown as brown) can clearly be seen for complexes formed with compound I (Figure 4a) and for complexes formed with compound II (Figure 4b). The aggregate concentration is greater and more densely distributed for compound I than for compound II. No such increased aggregation propensity was seen for the other C60 vector/DNA complexes (Figure 4c−f). However, time-dependence of aggregation could be observed for compound III and compound VI. Figure 5a,b shows the optical microscopy images of compound III/DNA, and compound VI/DNA complexes at R = 0.42 at 24 h post-transfection time. The images show the presence of large sized aggregates, more densly distributed for compound VI than for compound III.
Interestingly, addition of compound III/DNA mixtures caused cell morphological changes when added to cultured cells, causing the attached cells to round up from the substratum surface in contrast to the usual planar, extended/elongated shapes the cells assumed in the normal growth state. Figure 4c gives the best visual representation of this effect. This shape change may be attributed to the depolymerization/disruption of either the actin or tubulin networks of the cytoskeleton by the complexes, and/or to the disruption/inhibition of focal adhesion plaques formed on the cell surface. However, this observation at R = 0.42 does not have any noticeable effects on cell proliferation, as flow cytometry measurements indicate no statistically significant difference in the number of cells for those treated with compound III/DNA complexes relative to the controls cells (no C60/DNA complexes added).
Our results indicate that compounds III and IV, when complexed with DNA, bring about the highest levels of transfection when compared to the other derivatized C60 compounds under evaluation in this study. At the optimal ratio of compound III or IV to DNA (R = 16.8), approximately 30% of cells are expressing GFP at 24 h post-transfection time. However, at 24 h post-transfection, there is only approximately 30% viability in cells treated with these two tranfection mixtures. This result is in contrast to cell viability of greater than 50% in cells treated with the compounds III or IV alone at equivalent C60 concentrations (4µg/µL) as that when in complex with DNA at R = 16.8. The temporal increase in aggregate sizes for these C60/DNA complexes (not seen in the free C60 compounds alone) leads to precipitation onto the cell surface when these mixtures are left in the culture medium for 24 h (e.g., see Figure 5). This effect may explain the higher levels of cell death in the transfection mixture-treated cells.
The overall trend observed in these studies was that increased cell death was observed with an increase in either C60 concentration alone or for increased R values in C60/DNA mixtures, irrespective of the chemical nature of the C60 compound, with compounds III and IV exhibiting the least toxicity when free in solution, but not necessarily when complexed with DNA (under these conditions, compound V seems to exhibit the least cell toxicity). Also, higher levels of cytotoxicity seem to correlate more with complex aggregate formation induced by the presence of DNA in the mixtures, leading to the formation of visible precipitates. Such deposition of aggregates onto the cell surface will impair normal functioning of the plasma membrane and thereby contribute to cell death.(31) There may also be other slow processes contributing to cell death for the positively charged C60 vectors in the C60/DNA solutions at the longer (8 and 24 h) transfection times. Following cellular entry, the presence of positively charged amino-C60 compounds (I−IV) (individuals or as aggregates) inside the cell or nucleus may lead to disruptions to other cellular functions, such as interfering with histone−DNA interactions and/or other cellular processes.(7)
The favorable transfection efficiencies of compounds III and IV suggest that these compounds have some characteristics in common with other positively charged amino-C60 derivatives previously cited in the literature which are reported to effect transfection in cells. These similarities include having a flexible linker situated between the fullerene core and the positively charged amino groups.14,16 Although the results presented here suggest that the structures of compounds III and IV will result in higher levels of transfection than those previously reported by others, direct comparison of our results with the results from others using different structurally derivatized positively charged amino C60 vectors is not possible, since the structure of the C60 vectors, the cell lines tested, and the methodologies used are not consistent.
Another distinct feature of all the C60 vectors reported here is their water solubility which obviates the need to use organic solvents such as dimethylformamide (DMF) in the preparation of the transfection mixture; the high cytotoxicity observed for some other C60-based transfection agents has been attributed to the toxicity of DMF.14,16
The comparable transfection efficiencies of compounds III and IV on NIH 3T3 cells to those of commercially available nonviral vectors 25 kDa PEI and Cytopure is encouraging. 25 kDa PEI is a widely used nonviral vector and is quite often used as a standard for comparing new nonviral vectors.33,34 However, it has also been associated with high cytotoxicity. This high cytotoxicity has been attributed more to free PEI than to the PEI/DNA complex. However, in case of compound III or IV, at the optimal R = 16.8, their complexes with DNA show higher toxicity (30% viability) compared to the free compounds III or IV alone (greater than 50% cell viability). Since the cytotoxicity seems to correlate more with complex aggregate formation induced by the presence of DNA in the mixtures, future refinement of the C60/DNA complex preparation protocol, such as disaggregating these complexes with phosphate buffer and/or NaCl, should potentially lead to lower cytotoxicity while maintaining the same level of transfection efficiency, or potentially even increase these transfection efficiency levels. Furthermore, although not addressed in this study (for reasons of maintaining uniformity in C60/DNA complex formation and cellular entry), the presence of serum proteins on enhanced C60/DNA complex uptake, and on subsequent cell viability during extended transfection times, would also be worth examining, and could be expected to lower the observed cellular cytotoxicity levels seen in this study.
The small, but statistically significant, expression of the reporter protein from C60/DNA conjugates formed from compounds V and VI was surprising and interesting since these samples do not possess a net positive charge under the physiological conditions used to form the complexes, although there have been limited reports of other nonpositive charged nanoparticles translocating into cells(35) and, indeed, also demonstrating gene transfection.(36) Thus, at least for some derivatized C60 molecules, the hydrophobic nature of the C60 carbon nanostructures may be the common important property in their binding to DNA and their subsequent translocation into the interior of the cell. There is now a growing body of work that suggests that carbon nanomaterials such as fullerenes, metallofullerenes and carbon nanotubes, due the hydrophobicity of their carbon sheaths, have the ability to efficiently translocate into the interior of cells irrespective of the charge of their water-solubilizing moieties.8,9,37–41 In addition, carbon nanomaterials such as Gd@C60, Gd@C82, Gd@C80 and Gd@ultrashort single-walled carbon nanotubes (Gd@US-tubes) have shown potential as high-performance magnetic resonance imaging (MRI) contrast agents38,39,42–48 suitable for advanced applications such as tracking and/or delivery of magnetically labeled cells by MRI in vivo. These reports, along with the favorable C60-based gene transfection results reported here and by others,8,14–16 offer opportunities for development of analogous Gd@C60-based vectors to monitor noninvasively the biodistribution and pharmacokinetics of gene therapy vectors in vivo.(49)
Conclusion
A new class of water-soluble C60 transfecting agents with positively charged, negatively charged, or neutral chemical functionalities under physiological conditions was prepared using Hirsch−Bingel chemistry. Transfection, cytotoxicity and biophysical structure/activity studies were performed in an effort to elucidate the relationship between the hydrophobicity of the fullerene core, the hydrophilicity of the water-solubilizing groups, and the overall charge state of the C60 vectors in gene delivery/expression. All C60 derivatives showed statistically significant transfection efficiency compared to naked DNA. However, only two positively charged C60 derivatives, namely, an octa-amino derivatized C60 and a dodeca-amino derivatized C60 vector, showed efficient in vitro transfection. All C60 vectors showed an increase in toxicity in a dose-dependent manner. Increased levels of cellular toxicity were observed for positively charged C60 vectors relative to the negatively charged and neutral vectors. Structural analyses using dynamic light scattering and optical microscopy confirmed that higher positive charge on C60 compounds is a dominant physical attribute necessary for optimal C60/DNA structural features leading to increased transfection efficiency, and that aggregation is the major factor that negatively affected the cytotoxicity profiles of the C60 vector/DNA complexes. Aggregation is presumably also the dominant reason for increased cytotoxicity of certain specific derivatized C60 compounds (most notable for compound I) even in the absence of DNA, at least when analyzed under the serum-free conditions utilized in this study. Future studies should be able to capitalize on this information and enable the design of additional C60 derivatives that address these issues specifically and help lower the propensity of these reagents to aggregate in the presence of DNA. Such reagents would be expected to enhance transfection of cells and tissues while simultaneously lowering toxicity levels. Future studies using these reagents will also more precisely indicate the cellular uptake and endosomal release mechanisms that these compounds inherently possess, thereby lending further insight into potential enhanced chemical design of future generations of these carbon-based nanomaterials specifically for DNA delivery into the cell nucleus. The successful demonstration of intracellular DNA uptake, intracellular transport, and gene expression from DNA using C60 vectors suggests the possibility of developing analogous Gd@C60-based vectors to serve simultaneously as both therapeutic and diagnostic agents.
Acknowledgments
The work was supported by the NIH (Grants 1-R01-EB000703 to R. D. Bolskar and L.J.W., and R01-AR42639 to A.G.M.) and the Robert A. Welch Foundation (Grant C-0627, L.J.W.). B.S. acknowledges support from the J. Evans Attwell-Welch Postdoctoral training fellowship from the Richard Smalley Institute for Nanoscale Science and Technology.
Supporting Information Available
Tables of fraction of live NIH 3T3 cells after incubation under different conditions. This material is available free of charge via the Internet at http://pubs.acs.org.
Funding Statement
National Institutes of Health, United States
Supplementary Material
References
- Lodish H.; Berk A.; Zipursky S. L.; Matsudaira P.; Balimore D.; Darnell J.. Molecular Cell Biology; 5th ed.; W. H. Freeman & Co.: New York, 2000. [Google Scholar]
- Worgall S.; Wolff G.; Falck Pedersen E.; Crystal R. Innate Immune Mechanisms Dominate Elimination of Adenovirus Vectors Following In Vivo Administration. Hum. Gene Ther. 1997, 8, 37–44. [DOI] [PubMed] [Google Scholar]
- Verma I.; Somia N. Gene Therapy - Promises, Problems and Prospects. Nature 1997, 389, 239–242. [DOI] [PubMed] [Google Scholar]
- Godbey W. T.; Mikos A. G. Recent Progress in Gene Delivery Using Non-Viral Transfer Complexes. J. Controlled Release 2001, 72, 115–125. [DOI] [PubMed] [Google Scholar]
- Neu M.; Fischer D.; Kissel T. Recent Advances in Rational Gene Transfer Vector Design Based on Poly(ethylene imine) and Its Derivatives. J. Gene Med. 2005, 7, 992–1009. [DOI] [PubMed] [Google Scholar]
- Miller A. D. The Problem with Cationic Liposome/Micelle-Based Non-Viral Vector Systems for Gene Therapy. Current Medicinal Chemistry 2003, 10 (14), 1195. [DOI] [PubMed] [Google Scholar]
- Lv H.; Zhang S.; Wang B.; Cui S.; Yan J. Toxicity of Cationic Lipids and Cationic Polymers in Gene Delivery. J. Controlled Release 2006, 114 (1), 100. [DOI] [PubMed] [Google Scholar]
- Nakamura E.; Isobe H. Functionalized Fullerenes in Water. The First 10 Years of Their Chemistry, Biology, and Nanoscience. Acc. Chem. Res. 2003, 36, 807–815. [DOI] [PubMed] [Google Scholar]
- Dugan L. L.; Turetsky D. M.; Du C.; Lobner D.; Wheeler M.; Almli C. R.; Shen C.; Luh T.; Choi D.; Lin T. Carboxyfullerenes as Neuroprotective Antioxidants. Proc. Natl. Acad. Sci. U.S.A. 1997, 94, 9434–9439. [DOI] [PMC free article] [PubMed] [Google Scholar]
- Friedman S. H.; DeCamp D. L.; Sijbesma R. P.; Srdanov G.; Wudl F.; Kenyon G. L. J. Am. Chem. Soc. 1993, 115, 6506. [Google Scholar]
- Mirakyan A. L.; Wilson L. J. Functionalization of C60 with Bisphosphonate Groups: A Route to Bone-Vectored Fullerenes. J. Chem. Soc., Perkin Trans. 2002, 2, 1173–1176. [Google Scholar]
- Wharton T.; J. W. L. Highly-Iodinated Fullereneas a Contrast Agent for X-Ray Imaging. Bioorg. Med. Chem. 2002, 10, 3545–3554. [DOI] [PubMed] [Google Scholar]
- Zakharian T. Y.; Seryshev A.; Sitharaman B.; Gilbert B. E.; Knight V.; Wilson L. J. A Fullerene-Paclitaxel Chemotherapeutic: Synthesis, Characterization, and Biological Activity in Tissue Culture. J. Am. Chem. Soc. 2005, 27, 12508–12509. [DOI] [PubMed] [Google Scholar]
- Nakamura E.; Isobe H.; Tomita N.; Sawamura M.; Jinno S.; Okayama H. Functionalized Fullerene as an Artificial Vector for Transfection. Angew. Chem., Int. Ed. 2000, 39, 4254–4257. [DOI] [PubMed] [Google Scholar]
- Isobe H.; Tomita N.; Jinno S.; Okayama H.; Nakamura E. Synthesis and Transfection Capability of Multi-Functionalized Fullerene Polyamine. Chem. Lett. 2001, 1214, 1215. [Google Scholar]
- Isobe H.; Nakanishi W.; Tomita N.; Jinno S.; Okayama H.; Nakamura E. Nonviral Gene Delivery by Tetraamino Fullerene. Mol. Pharmaceutics 2006, 3, 124–134. [DOI] [PubMed] [Google Scholar]
- Isobe H.; Nakanishi W.; Tomita N.; Jinno S.; Okayama H.; Nakamura E. Gene Delivery by Aminofullerenes: Structural Requirements for Efficient Transfection. Chemistry—Asian J. 2006, 1, 167–175. [DOI] [PubMed] [Google Scholar]
- Klumpp C.; Lacerda L.; Chaloin O.; Ros T. D.; Kostarelos K.; Prato M.; Bianco A. Multifunctionalised cationic fullerene adducts for gene transfer: design, synthesis and DNA complexation. Chem. Commun. 2007, 3762. [DOI] [PubMed] [Google Scholar]
- Bingel C. Cyclopropanierung Von Fullerenen. Chem. Ber. 1993, 126, 1957. [Google Scholar]
- Hirsch A.; Lamparth I.; Karfunkel H. R. Fullerene Chemistry in Three Dimensions: Isolation of Seven Regioisomeric Bisadducts and Chiral Trisadducts of C60 and Di(ethoxycarbonyl)methylene. Angew. Chem., Int. Ed. 1994, 33, 437. [Google Scholar]
- Richardson C. F.; Schuster D. I.; Wilson S. R. Synthesis and Characterization of Water-Soluble Amino Fullerene Derivatives. Org. Lett. 2000, 2, 1011–1014. [DOI] [PubMed] [Google Scholar]
- Lamparth I.; Hirsch A. Water-Soluble Malonic Acid Derivatives of C60 with a Defined Three-Dimensional Structure. J. Chem. Soc. Chem. Commun. 1994, 1727. [Google Scholar]
- Wharton T.; Kini V. U.; Mortis R. A.; Wilson L. J. New Non-Ionic, Highly Water-Soluble Derivatives of C60 Designed for Biological Compatibility. Tetrahedron Lett. 2001, 42, 5159–5162. [Google Scholar]
- Datta N.; P. Q. P. P. Q.; Sharma U.; Sikavitsas V. I.; Jansen J. A.; Mikos A. G. In Vitro Generated Extracellular Matrix and Fluid Shear Stress Synergistically Snhance 3D Osteoblastic Differentiation. Proceed. Natl. Acad. Sci. U.S.A. 2006, 103, 2488–2493. [DOI] [PMC free article] [PubMed] [Google Scholar]
- Godbey W. T.; Wu K. K.; Hirasaki G. J.; Mikos A. G. Improved Packing of Poly(ethylenimine)/DNA Complexes Increases Transfection Efficiency WT. Gene Ther. 1999, 6, 1380–1388. [DOI] [PubMed] [Google Scholar]
- Wörle-Knirsch J. M.; Pulskamp K.; Krug H. F. Oops they did it again! Carbon nanotubes hoax scientists in viability assays. Nano Lett. 2006, 6, 1261–1268. [DOI] [PubMed] [Google Scholar]
- Uchida E.; Mizuguchi H.; Ishii-Watabe A.; Hayakawa T. Comparison of the Efficiency and Safety of Non-viral Vector-Mediated Gene Transfer into a Wide Range of Human Cells. Biol. Pharm. Bull. 2002, 25, 891–897. [DOI] [PubMed] [Google Scholar]
- Mortimer I.; Tam P.; MacLachlan I.; Graham R. W.; Saravolac E. G.; Joshi P. B. Cationic Lipid-Mediated Transfection of Cells in Culture Requires Mitotic Activity. Gene Ther. 1999, 6, 403–411. [DOI] [PubMed] [Google Scholar]
- Brunner S.; Sauer T.; Carotta S.; Cotten M.; Saltik M.; Wagner E. Cell Cycle Dependence of Gene Transfer by Lipoplex, Polyplex and Recombinant Adenovirus. Gene Ther. 2000, 7, 401–407. [DOI] [PubMed] [Google Scholar]
- Pecora R.Dynamic Light Scattering; Plenum: New York, 1985. [Google Scholar]
- Isobe H.; Sugiyama S.; Fukui K.-i.; Iwasawa Y.; Nakamura a. E. Atomic Force Microscope Studies on Condensation of Plasmid DNA with Functionalized Fullerenes. Angew. Chem., Int. Ed. 2001, 40, 3364–3367. [DOI] [PubMed] [Google Scholar]
- Sitharaman B.; Asokan S.; Rusakova I.; Wong M. S.; Wilson L. J. Nanoscale Aggregation Properties of Neuroprotective Carboxyfullerene (C3) in Aqueous Solution. Nano Lett. 2004, 4, 1759–1762. [Google Scholar]
- Godbey W. T.; Wu K. K.; Mikos A. G. Poly(ethylenimine) and Its Role in Gene Delivery. J. Controlled Release 1999, 60, 149–160. [DOI] [PubMed] [Google Scholar]
- Dong W.; Li S.; Jin G.; Sun Q.; Ma D.; Hua Z. Efficient Gene Transfection into Mammalian Cells Mediated by Cross-linked Polyethylenimine. Int. J. Mol. Sci. 2007, 8, 81–102. [Google Scholar]
- Wilhem C.; Billotey C.; Roger J.; Pons J. N.; Bacri J. C.; Gazeau F. Intracellular Uptake of Anionic Superparamagnetic Nanoparticles as a Function of Their Surface Coating. Biomaterials 2003, 24, 1001–1011. [DOI] [PubMed] [Google Scholar]
- Roy I.; Ohulchanskyy T. Y.; Bharali D. J.; Pudavar H. E.; Mistretta R. A.; Kaur N.; Prasad P. N. Optical Tracking of Organically Modified Silica Nanoparticles as DNA Carriers: A Nonviral, Nanomedicine Approach for Gene Delivery. Proc. Natl. Acad. Sci. U.S.A. 2005, 102, 279–284. [DOI] [PMC free article] [PubMed] [Google Scholar]
- Ashcroft J. M.; Tsyboulski D. A.; Hartman K. B.; Zakharian T. Y.; Marks J. W.; Weisman R. B.; Rosenblum M. G.; Wilson L. J. Fullerene (C60) Immunoconjugates: Interaction of Water-Soluble C60 Derivatives with the Murine Anti-gp240 Melanoma Antibody. Chem. Commun. 2006, 3004–3006. [DOI] [PubMed] [Google Scholar]
- Anderson S. A.; Lee K. K.; Frank J. A. Gadolinium-Fullerenol as a Paramagnetic Contrast Agent for Cellular Imaging. Invest. Radiol. 2006, 41, 332–338. [DOI] [PubMed] [Google Scholar]
- Sitharaman B.; Tran L. A.; Bolskar R. D.; Muthupillai R.; Flamm S. D.; Mikos A. G.; Wilson L. J. Gadofullerenes as Nanoscale Magnetic Labels for Cellular Magnetic Resonance Imaging. Contrast Media Mol. Imaging 2007, 2, 139–146. [DOI] [PubMed] [Google Scholar]
- Pantarotto D.; Briand J.-P.; Prato M.; Bianco A. Translocation of Bioactive Peptides Across Cell Membranes by Carbon Nanotubes. Chem. Commun. 2004, 1 (1), 16–17. [DOI] [PubMed] [Google Scholar]
- Kam N. W. S.; Jessop T. C.; Wender P. A.; Dai H. Nanotube Molecular Transporters: Internalization of Carbon Nanotube-Protein Conjugates into Mammalian Cells. J. Am. Chem. Soc. 2004, 126 (22), 6850–6851. [DOI] [PubMed] [Google Scholar]
- Stevenson S.; Rice G.; Glass T.; Harlch K.; Cromer F.; Jordan M. R.; Craft J.; Hadju E.; Bible R.; Olmstead M. M.; Maltra K.; Fisher A. J.; Balch A. L.; Dorn H. C. Small-Bandgap Endohedral Metallofullerenes in High Yield and Purity. Nature 1999, 401 (6748), 55–57. [Google Scholar]
- Bolskar R. D.; Benedetto A. F.; Husebo L. O.; Price R. E.; Jackson E. F.; Wallace S.; Wilson L. J.; Alford J. M. First Soluble M@C60 Derivatives Provide Enhanced Access to Metallofullerenes and Permit in Vivo Evaluation of Gd@C60[C(COOH)2]10 as a MRI Contrast Agent. J. Am. Chem. Soc. 2003, 125 (18), 5471–5478. [DOI] [PubMed] [Google Scholar]
- Toth E.; Bolskar R. D.; Borel A.; Gonzalez G.; Helm L.; Merbach A. E.; Sitharaman B.; Wilson L. J. Water-Soluble Gadofullerenes: Toward High-Relaxivity, pH-Responsive MRI Contrast Agents. J. Am. Chem. Soc. 2005, 127 (2), 799–805. [DOI] [PubMed] [Google Scholar]
- Mikawa M.; Kato H.; Okumura M.; Narazaki M.; Kanazawa Y.; Miwa N.; Shinohara H. Paramagnetic Water-Soluble Metallofullerene Having the Highest Relaxivity for MRI Contrast Agents. Bioconjugate Chem. 2001, 12, 510–514. [DOI] [PubMed] [Google Scholar]
- Kato H.; Kanazawa Y.; Okumura M.; Taninaka A.; Yokawa T.; Shinohara H. Lanthanoid Endohedral Metallofullerenols for MRI Contrast Agents. J. Am. Chem. Soc. 2003, 125 (14), 4391–4397. [DOI] [PubMed] [Google Scholar]
- Fatouros P. P.; Frank F. D.; Chen Z.; Broaddus W. C.; Tatum J. L.; Kettenmann B.; Ge Z.; Gibson H. W.; Russ J. L.; Leonard A. P.; Duchamp J. C.; Dorn H. C. In Vitro and in Vivo Imaging Studies of a New Endohedral Metallofullerene Nanoparticle. Radiology 2006, 240, 756–764. [DOI] [PubMed] [Google Scholar]
- Sitharaman B.; Kissell K. R.; Hartman K. B.; Tran L. A.; Baikalov A.; Rusakova I.; Sun Y.; Khant H. A.; Ludtke S. J.; Chiu W.; Laus S.; Tóth, É.; Helm L.; Merbach A. E.; Wilson L. J. Superparamagnetic Gadonanotubes Are High-Performance MRI Contrast Agents. Chem. Commun. 2005, 31, 3915–3917. [DOI] [PubMed] [Google Scholar]
- Yang X.; Atalar E. MRI-guided gene therapy. FEBS Lett. 2006, 580 (12), 2958. [DOI] [PubMed] [Google Scholar]
Associated Data
This section collects any data citations, data availability statements, or supplementary materials included in this article.