

Abstract
HMGA1 proteins are architectural transcription factors that are overexpressed by pancreatic adenocarcinomas. We previously have shown that RNA interference targeting the HMGA1 gene may represent a potential chemosensitizing strategy in pancreatic adenocarcinoma cells (S Liau et al, J Gastrointest Surg 2006 Nov;10(9):1254-62). In this study, we tested the hypothesis that HMGA1 promotes chemoresistance to gemcitabine in pancreatic cancer cells. Stable shRNA-mediated HMGA1 silencing in BxPC3 and MiaPaCa2 cells promoted chemosensitivity to gemcitabine, with reductions in gemcitabine IC50 and increases in gemcitabine-induced apoptosis and caspase-3 activation. In contrast, forced HMGA1 overexpression in MiaPaCa2 cells promoted chemoresistance to gemcitabine, with increases in gemcitabine IC50 and reductions in gemcitabine-induced apoptosis and caspase-3 activation. Dominant negative Akt abrogated HMGA1 overexpression-induced increases in chemoresistance to gemcitabine. Finally, HMGA1 silencing promoted chemosensitivity to gemcitabine in vivo in a nude mouse xenograft model of pancreatic adenocarcinoma. Our findings suggest HMGA1 promotes chemoresistance to gemcitabine through an Akt-dependent mechanism. Targeted therapies directed at HMGA1 represents a potential strategy for ameliorating chemoresistance in pancreatic adenocarcinoma.
Keywords: HMGA1, Akt, Chemoresistance, Pancreatic adenocarcinoma
Introduction
Overall prognosis for patients diagnosed with pancreatic adenocarcinoma remains dismal, with 5-year survival rates averaging less than 5% (1). At the time of diagnosis, most patients have locally-advanced or metastatic disease precluding surgical resection (2). First line therapy for most patients with advanced pancreatic cancer is based on the nucleoside analogue gemcitabine. However, the clinical response rate to gemcitabine remains modest, in large part due to the profound chemoresistance inherent in pancreatic cancer cells. Therefore, characterization of mechanisms mediating chemoresistance in pancreatic adenocarcinoma is an important priority.
The human HMGA1 gene, located on chromosomal locus 6p21, encodes two HMGA1 splice variants (HMGA1a and HMGA1b) (3). These HMGA1 proteins are architectural transcription factors that form stereo-specific, multiprotein complexes termed “enhanceosomes” on the promoter/enhancer regions of genes they regulate (4-6). Each HMGA1 protein has three AT-hook domains which can bind to the minor groove of AT-rich DNA sequences (4, 7). HMGA1 proteins are overexpressed in a wide range of human cancers, including pancreatic adenocarcinoma (8-15). Further, tumoral HMGA1 overexpression has been reported to be associated with poor prognosis in cancer patients (9, 10, 16, 17).
Our group has previously reported the important roles played by HMGA1 in mediating cellular invasiveness and metastatic potential of pancreatic adenocarcinoma cells (18). Overexpression of HMGA1 promotes cellular invasion in vitro while post-transcriptional silencing of HMGA1 inhibits the ability of pancreatic adenocarcinoma cells to form metastases in vivo. Furthermore, we demonstrated that overexpression of HMGA1 is associated with increased resistance to apoptosis under anchorage-independent culture (‘anoikis-resistance’)(19). In these studies, we have reported that Akt is a key downstream effector of HMGA1-dependent signaling in pancreatic cancer (18). Given the central role of Akt in mediating chemoresistance to gemcitabine (20-22), we hypothesized that HMGA1 would promote chemoresistance to this agent through an Akt-dependent mechanism. In this study, we have confirmed this hypothesis to be correct, and in addition, we have demonstrated that targeted post-transcriptional silencing of HMGA1 promotes chemosensitivity in vivo. In conclusion, our findings are of particular clinical importance as they suggest that targeted therapies directed against HMGA1 may ameliorate chemoresistance to gemcitabine.
Materials and Methods
Cells and Cell Culture
MiaPaCa2 and PANC1 human pancreatic ductal adenocarcinoma cells were obtained from American Type Culture Collection (Manassas, VA). Cells were maintained in DMEM containing 10% fetal bovine serum (Gibco, Gaithersburg, MD) and incubated in a humidified (37°C, 5% CO2) incubator, grown in 75-cm2 culture flasks, and passaged on reaching 80% confluence.
Reagents and Dominant Negative Akt Constructs
Anti-HMGA1, anti-lamin B1, anti-phospho-Akt (ser473), anti-Akt1 and anti-hemagglutinin (HA) antibodies were obtained from Santa Cruz Biotechnology (Santa Cruz, CA). HA-tagged dominant negative Akt adenovirus (Ad-DN-Akt) and its control adenovirus (Ad-CMV-Null), both titred at 1X10¹⁰ PFU per mL, were purchased from Vector Biolabs (Philadelphia, PA).
Lentivirus-mediated HMGA1 RNA Interference
Hairpin RNA interference plasmids (pLKO.1-HMGA1, TRCN0000018949) were obtained from The RNAi Consortium (Sigma Aldrich, St Louis, MO). The sequences of short hairpin RNA targeting the human HMGA1 gene (GenBank accession no. NM_002131) was 5′–CAACTCCAGGAAGGAAACCAA–3′, (shHMGA1 targets coding region positions 446-466 of HMGA1 mRNA transcript variant 2). The control PLKO.1 plasmid, which has a scrambled non-targeting short-hairpin RNA sequence, was obtained from Addgene (Cambridge, MA) (23). High-titer lentivirus expressing shHMGA1 and control shRNA were generated from five-plasmid transient transfection into 293T cells. Helper plasmids included pHDM-Hgpm2, pMD-tat, pRC/CMV-rev and pCMV-VSV-G obtained from Harvard Gene Therapy Initiative (Harvard Medical School, Boston, MA). The lentiviral transfer vectors were either control PLKO.1 (non-targeting shRNA sequence) or shHMGA1 plasmids as described above. Virus preparations were concentrated by ultracentrifuge and titered by Southern blotting. We achieved titer of 7.2X10⁸/mL for control shRNA lentivirus and 2.5X10⁸/mL for shHMGA1 lentivirus. Pooled stable transfectants were developed following infection of lentivirus at MOI of 10 for 48 hours, and stable selection in puromycin was achieved as described above.
Expression Vector and Transfection
The HMGA1 coding sequence was PCR-amplified from IMAGE clone 5399570 (GenBank accession no. BC063434) using gene-specific primers modified to include the appropriate restriction sites at their 5′ end. The primers used were: forward, 5′–TTTTGATATCATGAGTGAGTCGAGCTCGAAG–3′ and backward, 5′-TTTTGAATTCTCACTGCTCCTCCTCCGAGGA-3′. Purified PCR products were digested with EcoRV and EcoRI, before ligation into a EcoRV/EcoRI-digested pIRES-puro3 vector (Clontech, Palo Alto, CA). The expression plasmids were named pIRES-HMGA1. MiaPaCa2 cells were transfected with pIRES-HMGA1 or empty pIRES-puro3 (control), using Lipofectamine 2000 (Invitrogen) in accordance with the manufacturer's protocol. Stable clones were selected by exposure to incrementally increasing concentrations of puromycin (Invivogen), isolated using cloning cylinders, and maintained in medium containing 3μg/ml puromycin (Invivogen). Clones pIRES-HMGA1.1 and pIRES-HMGA1.2, which expressed the highest levels of HMGA1, were used for further studies.
Western Blotting
Cells were harvested and rinsed twice with PBS. Total cell extracts were prepared with Phosphosafe lysis buffer (Novagen, San Diego, CA). Nuclear extracts were prepared using NE-PER Nuclear and Cytoplasmic Extraction Reagents based on the manufacturer's instruction (Pierce, Rockford, IL). Protein concentration was measured using the BCA assay kit (Sigma). Cellular protein was subjected to 10% SDS/PAGE, and transferred electrophoretically to PVDF membranes (Invitrogen). After blocking with PBS containing 3% BSA for 1 h at room temperature, membranes were incubated with 3–5 mg/ml antibody in PBS containing 0.1% Tween 20 overnight at 4°C. Chemoluminescence detection (Amersham Biosciences, NJ) was performed in accordance with the manufacturer's instructions. The densitometric signal was quantified using ImagePro Plus software version 4.0 (Media Cybernetics, Silver Spring, MD).
Cytotoxicity Assay
Gemcitabine-induced cytotoxicity was quantified by an MTS (3-(4,5 dimethylthiazol-2-yl)-5-(3-carboxymethoxyphenyl-2-(4-sulfophenyl)-2H-tetrazolium) assay (CellTiter 96, Promega). Cells were seeded into 96-well plates at 5X10³cells per well and allowed to adhere overnight. Cell viability was determined after 48-72 hours in presence or absence of 0-10 μM gemcitabine. Plates were read with the use of the SpectraMax M5 microplate spectrophotometer (Molecular Devices, Sunnyvale, CA) at a wavelength of 490nm. IC50 values were calculated. At identical time points, cell counting was performed. Viable cells, identified by Trypan blue exclusion, were counted using a Neubauer hemocytometer (Hausser Scientific, Horsham, PA). Cell counting confirmed MTS results.
Apoptosis Assay
After exposure to gemcitabine (1 μM) up to 24 hours, 1X10⁶ cells were washed, trypsinized and resuspended in 0.5 ml of PBS containing 2% FBS and 0.1μM EDTA. Apoptosis staining was performed using 1μl/ml YO-PRO-1 and propidium iodide (Vybrant Apoptosis Assay Kit #4; Molecular Probes, Eugene, OR). Cells were then analyzed by flow cytometry (FACScan; Becton Dickinson, Franklin Lakes, NJ), measuring fluorescence emission at 530 and 575 nm. Cells stained with the green fluorescent dye YO-PRO-1 were counted as apoptotic; necrotic cells were stained with propidium iodide. The number of apoptotic cells was divided by the total number of cells (minimum of 104 cells) to calculate the apoptotic fraction.
Fluorometric Caspase Profiling
Whole cell lysates were assayed for caspase 3 activity using the BD ApoAlert Caspase Assay Plate (BD Biosciences, Palo Alto, CA) according to the manufacturer's instructions. Plates were read (excitation, 360 nm; emission, 480 nm) using SpectraMax M5 microplate reader in fluorescence mode (Molecular Devices).
Nude Mouse Subcutaneous Xenograft Model
Male athymic nu/nu mice 5 weeks of age, weighing 20–22 g and specific pathogen-free were obtained from Harlan Sprague Dawley (Indianapolis, IN). Mice were housed in microisolator cages in a pathogen-free facility with 12 h light–dark cycles. Animals were observed for signs of tumor growth, activity, feeding and pain in accordance with the guidelines of the Harvard Medical Area Standing Committee on Animals. To determine the effect of HMGA1 gene silencing on in vivo chemosensitivity, 2X10⁶ BxPC3 cells stably expressing control or HMGA1 shRNA (shHMGA1.1 sequence, lentiviral transduction) were subcutaneously implanted in nude mice. Mice were anesthesized with i.p ketamine (200mg/kg) and xylazine (10mg/kg) and inoculated with 2X10⁶ cells in 100μL of PBS subcutaneously. Gemcitabine administration was commenced 14 days after implantation when tumors were approximately 50mm3 in volume. Mice received gemcitabine (150 mg/kg) in 100 μL of PBS vehicle by twice-weekly i.p. injection. Tumor dimensions were measured weekly using micrometer calipers. Tumor volumes were calculated using the following formula: Volume = 1/2 a × b2, where a and b represent the larger and smaller tumor diameters, respectively. After six weeks of gemcitabine administration and 4 days after final gemcitabine injection, necropsy was performed, and the primary tumor was excised, formalin-fixed and paraffin-embedded.
Immunohistochemistry
Tumor sections (5 μm) were deparaffinized, rehydrated through graded alcohol and processed using a streptavidin-biotin-peroxidase complex method. Sections were incubated with anti-HMGA1 antibody (Santa Cruz) at 4°C overnight at a 1:50 dilution. The secondary antibody was biotinylated rabbit anti-goat antibody (DAKO) used at a dilution of 1:200 for 30 minutes at 37°C. Sections were then incubated with StrepABComplex/horseradish peroxidase (1:100; DAKO) for 30 minutes at 37°C. Immunolocalization was performed by exposure to 0.05% 3,3′-diaminobenzidine tetrahydrochloride as the chromogen. Normal serum was used in the place of primary antibody as a negative control.
Apoptosis Staining
Following preparation of 5 μm tumor sections, apoptosis was quantified using a commercially available terminal deoxynucleotidyl transferase nick-end labeling (TUNEL) kit, in accordance with the manufacturer's protocol (Chemicon, Temecula, CA). The number of apoptotic cells in at least five random fields from each section was counted. The apoptotic index was calculated by dividing the number of TUNEL-positive cells by the total number of nuclei counted in each field.
Statistical Analysis
Differences between groups were analyzed using Student's t-test, multifactorial ANOVA of initial measurements and Mann–Whitney U-test, for nonparametric data, as appropriate, using Statistica 5.5 software (StatSoft, Inc, Tulsa, OK). In cases in which averages were normalized to controls, the standard deviations of each nominator and denominator were taken into account in calculating the final standard deviation. P<0.05 was considered statistically significant.
Results
HMGA1 is a molecular determinant of chemoresistance to gemcitabine in pancreatic adenocarcinoma cells
Lentivirus-mediated HMGA1 silencing resulted in a marked increase in chemosensitivity to gemcitabine in BxPC3 cells (in which we achieved almost 90% silencing of HMGA1 protein expression, Fig 1A), with approximately four-fold reductions in IC50 to gemcitabine (mean IC50: control shRNA versus. shHMGA1; 50nM versus 12 nM, p=0.001) (Fig 1C and D). Interestingly, BxPC3 cells in which HMGA1 had been silenced developed spiculated morphology on exposure to 1μM gemcitabine for 48 hours, whereas control cells did not (Fig 1B). In our previous study, we achieved up to 90% silencing of HMGA1 expression in MiaPaCa2 cells using lentivirus expressing shRNA with the same target sequence (24). In the current study, we achieved similar degree of HMGA1 knockdown in MiaPaCa2 cells (data not shown). Lentivirus-mediated HMGA1 silencing had similar effects on MiaPaCa2 cells, with shifting of the gemcitabine IC50 curve to the left (Fig 3B) and approximately two-fold reductions on IC50 (mean IC50: control shRNA versus shHMGA1; 60 nM versus 30nM, p=0.001) (Fig 3D).
Fig. 1. BxPC3: Lentivirus-mediated silencing of HMGA1 and chemosensitivity to gemcitabine.

A, Following the generation of high titre lentivirus particles carrying shHMGA1, BxPC3 was transduced with lentivirus at MOI of 10 and stable transfectants were developed following selection with puromycin. Robust suppression of HMGA1 was achieved using lentivirus with a high degree of silencing of HMGA1. In BxPC3 cells, lentivirus-mediated shHMGA1 achieved almost complete silencing of HMGA1. Controls were stable transfectants developed using lentivirus carrying scrambled, non-targeting shRNA. B, The effects of lentivirus-mediated HMGA1 silencing on chemosensitivity to gemcitabine were assessed. When BxPC3 cells in which HMGA1 had been silenced were exposed to 1μM gemcitabine for 48 hours, they adopted a less healthy, speculated morphology as compared to control cells. Photomicrographs were taken using an inverted microscope at 40X magnification. C, Survival curves following exposure to 0-10μM gemcitabine were analyzed following MTS assay. Lentivirus-mediated stable HMGA1 silencing in BxPC3 cells shifted the survival curve to the left indicating an increased in chemosensitivity to gemcitabine, when compared to the controls. Correspondly, there was 4-fold reductions in the IC50 to gemcitabine with silencing of HMGA1 when compared to the controls. *P=0.001 versus control shRNA.
Fig 3.

A, Lentivirus-mediated silencing of HMGA1 promoted gemcitabine-induced apoptosis as assessed by flow cytometric analyses of YO-PRO-1/Propidium iodide-stained cells. Silencing of HMGA1 resulted in approximately 2-fold increases in the relative apoptotic rates in both BxPC3 and MiaPaCa2 cells following exposure to 1μM gemcitabine for 24 hours. *P=0.001 versus control shRNA. Representative flow cytometric images of three experiments are shown, with the apoptotic fractions being highlighted in triangles drawn. B, Forced overexpression of HMGA1 in pIRES-HMGA1.1 and 1.2 clones protected the cells from gemcitabine-induced apoptosis with approximately 70-80% reductions in relative apoptotic rates, as assessed by flow cytometry [P=0.001 (pIRES-HMGA1.1) and P=0.002 (pIRES-HMGA1.2) versus empty pIRES-puro3 control]. *P<0.05 versus empty pIRES-puro3 control. C, Relative caspase 3 activities were determined using a fluorometric caspase 3 substrate assay following exposure of cells to 1μM gemcitabine for 24 hours. Lentivirus-mediated silencing of HMGA1 promoted gemcitabine-induced caspase 3 activities. *P=0.008 (BxPC3) and P=0.005 (MiaPaCa2) versus control shRNA transfectants. D, As expected, overexpression of HMGA1 in pIRES-HMGA1.1 and 1.2 clones resulted in reductions in caspase 3 activation following exposure to 1μM gemcitabine for 24 hours, indicating protection from gemcitabine-induced caspase-mediated apoptosis. *P=0.001 versus empty pIRES-puro3 transfectants.
We then tested the impact of forced overexpression of HMGA1 on cellular chemoresistance to gemcitabine. MiaPaCa2 cells (which have low inherent expression of HMGA1) were stably transfected with the pIRES-HMGA1 vector, as described in the Materials and Methods. We selected two transfectant clones with highest expression levels of HMGA1 (pIRES-HMGA1.1 and pIRES-HMGA1.2). In our previous studies, we have characterized the pIRES-HMGA1.1 and pIRES-HMGA1.2 clones and verified their overexpression of HMGA1 by Western analysis (18, 19). pIRES-HMGA1.1 and pIRES-HMGA1.2 clones overexpress HMGA1 by 4-fold and 3.5-fold respectively, when compared with empty pIRES-puro3 transfectants (data not shown). Overexpression of HMGA1 resulted in significant increases in chemoresistance to gemcitabine, with increases in IC50 to gemcitabine (Fig 3D) and shifting of the IC50 curves to the right for both pIRES-HMGA1.1 and pIRES-HMGA1.2 clones (Fig 3C). The mean IC50 for pIRES-HMGA1.1 and pIRES-HMGA1.2 were 130nM and 100nM, respectively (p=0.003 and p=0.006, respectively, versus empty pIRES-puro3 controls). Notably, pIRES-HMGA1.1 consistently overexpressed HMGA1 to a greater degree than pIRES-HMGA1.2; this greater HMGA1 overexpression was associated with a higher mean IC50 value.
Forced HMGA1 overexpression enhanced the viability of cells exposed to 1μM of gemcitabine for 72 hours, whereas HGMA1 silencing was associated with the opposite effect (Fig 3A).
HMGA1 expression status modulates gemcitabine-induced apoptosis and caspase 3 activation
Following exposure to 1 μM gemcitabine for 24 hours, cells were subjected to flow cytometric quantitation of apoptosis and fluorometric caspase 3 profiling. Lentivirus-mediated HMGA1 silencing was associated with increases in gemcitabine-induced apoptosis (Fig 4A) and caspase 3 activation in both BxPC3 and MiaPaca2 cells (Fig 4C). In contrast, HMGA1 overexpression was associated with reductions in gemcitabine-induced apoptosis and in caspase 3 activation (Fig 4B and D).
Fig 4.
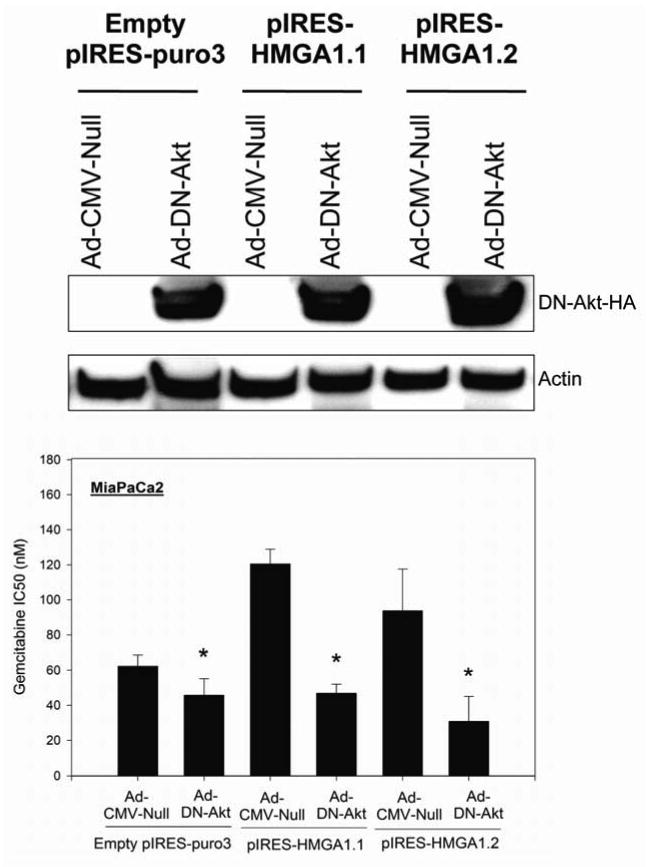
We have previously reported that in MiaPaCa2 cells, HMGA1 silencing reduces Akt phosphorylation whilst HMGA1 overexpression promotes Akt phosphorylation, and neither HMGA1 silencing nor overexpression have any impact on the level of expression of total Akt. To assess the role of Akt in mediating the HMGA1-induced chemoresistance, we transduced pIRES-HMGA1.1 and 1.2 clones with adenovirus carrying HA-tagged dominant negative Akt to examine its effects on chemoresistance. Transduction efficiency and expression of dominant negative Akt were assessed by Western blotting for hemagglutinin. Infection of pIRES-HMGA1.1 and 1.2 clones with adenovirus carrying dominant negative Akt (Ad-DN-Akt) resulted in significant reductions in IC50 to gemcitabine when compared to cells infected with control adenovirus (Ad-CMV-Null). Dominant negative Akt resulted in reductions in IC50 to gemcitabine in pIRES-HMGA1.1 and 1.2 clones to levels similar to parental MiaPaCa2 cells or empty pIRES-puro3 transfectants, indicating abrogation of the increased chemoresistance associated with HMGA1 overexpression. *P<0.05 versus control adenovirus (Ad-CMV-Null).
HMGA1-induced chemoresistance to gemcitabine is dependent on Akt signaling
We have previously reported that Akt is a downstream effector of HMGA1 (19, 24). We have found that HMGA1 silencing is associated with reductions in Akt phosphorylation (a marker of Akt activation) while forced HMGA1 overexpression is associated with increases in Akt kinase activity and in Akt phosphorylation. Given the importance of the PI3-K/Akt pathway in anti-apoptotic signaling, particularly in the context of chemoresistance, we sought to determine if chemoresistance to gemcitabine induced HMGA1 overexpression is Akt-dependent. Each of pIRES-HMGA1.1 and 1.2 clones were transduced with dominant negative Akt adenovirus at MOI of 10. The efficiency of transduction and expression of dominant negative Akt were confirmed by immunoblotting for the HA tag of the dominant negative Akt construct (Fig 5C). We next assessed the effects of dominant negative Akt on chemosensitivity to gemcitabine in each HMGA1 overexpressing clone. Dominant negative Akt was found to reverse the chemoresistance induced by HMGA1 overexpression, with reductions of IC50 to gemcitabine in both pIRES-HMGA1.1 and 1.2 clones. As such, HMGA1 overexpression-induced chemoresistance is dependent on Akt signaling.
Fig 5.

A, Stable silencing of HMGA1 promoted chemosensitivity to gemcitabine in vivo with evidence of tumor regression in nude mouse subcutaneous model. Mice (n=8 per group) were subcutaneously implanted with 2X10⁶ lentivirus-mediated stable transfectant BxPC3 cells (either shHMGA1 or control shRNA). Gemcitabine treatment was commenced in each group 14 days after implantation when the tumors were approximately 50mm3 in volume. Mice received gemcitabine (150 mg/kg) in 100 μL of PBS vehicle by twice-weekly i.p. injection. Subcutaneous tumor size was monitored weekly during the 6 weeks of treatment. Tumors with HMGA1 silencing showed evidence of regression in size during the treatment period while tumors in the control group continued to grow with time. Values are means (± SD). *P<0.05 versus control shRNA xenografts. B, Representative photograph of one mouse from each group is shown, with tumors located in their flanks. C, The explanted tumors at the end of the 6-week treatment period are shown. Of note, one of the mice in the shHMGA1 group had its tumor completely regress during the 6-week gemcitabine treatment period.
HMGA1 silencing promotes chemosensitivity to gemcitabine in vivo
BxPC3 cells in which HMGA1 had been silenced through stable lentiviral shRNA-mediated RNAi or control BxPC3 cells transduced with lentivirus carrying non-targeting shRNA were subcutaneously implanted into nude mice. Once the resulting xenograft tumors had grown to reach approximately 50mm3 in diameter, a 6-week course of gemcitabine administration was initiated. Tumors derived from BxPC3 cells in which HMGA1 had been silenced (n=8 animals) regressed during the treatment period while tumors derived from control cells (n=8 animals) continued to grow during the treatment period (Fig 6A). Stable suppression of HMGA1 expression in tumors derived from shHMGA1 transfectants was confirmed on Western blotting of nuclear extracts of tumor homogenates (Fig 6B) and on immunohistochemical analysis of xenografts harvested at the end of the study period (Fig 6C). TUNEL staining revealed significantly higher apoptotic index in shHMGA1 transfectant-derived tumors than in control cell-derived tumors (Fig 6C and D).
Fig 6.
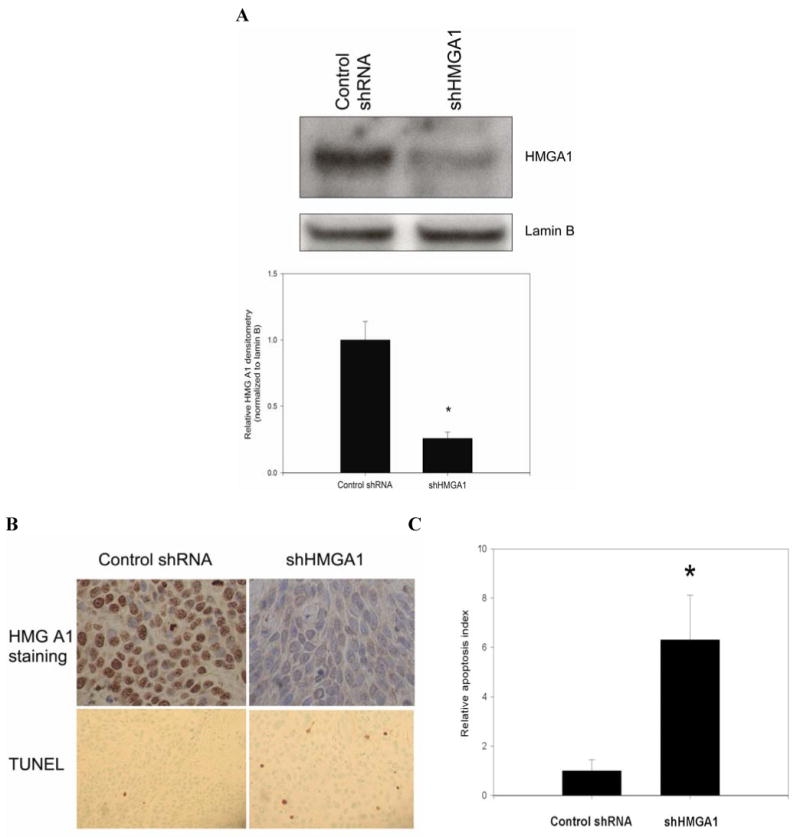
A, In vivo HMGA1 silencing was confirmed by Western blot analysis of nuclear extracts from explanted xenograft tumors. Densitometric values are means (± SD). *P=0.001 versus control shRNA xenografts. B-C, Immunohistochemistry of xenograft sections demonstrated little or absent staining for HMGA1 in the shHMGA1 xenografts, when compared to the control shRNA xenografts which showed intense staining for HMGA1. Photomicrograph of HMGA1 staining was obtained at 40X magnification. In the same sections, TUNEL staining was performed. In each tumor slide stained with TUNEL, the number of TUNEL-positive cells were counted in at least 5 randomly selected fields at 40X magnification. HMGA1 silencing led to significant increases in relative apoptotic index when compared to control shRNA xenografts. Representative tumor sections stained for TUNEL photographed at X20 magnification are shown. *P<0.001 versus control shRNA xenografts. Values are means (± SD).
Discussion
HMGA1 proteins are overexpressed in a wide range of human cancers, including pancreatic adenocarcinoma (8). Experimental data implicating biologically important roles for HMGA1 in cancer pathogenesis are rapidly accumulating (25, 26). Our study provides the first data suggesting that HMGA1 may mediate a critical feature of malignant phenotype: chemoresistance. First, our findings demonstrate that forced HMGA1 overexpression promotes chemoresistance to gemcitabine in pancreatic cancer cells in vitro, while HMGA1 silencing promotes gemcitabine-induced cytotoxicity and therefore abrogates chemoresistance to gemcitabine. Second, we have confirmed that HMGA1 silencing promotes gemcitabine-induced cytoxicity and reduces tumor growth in vivo in a nude mouse xenograft model of pancreatic cancer. Finally, our findings suggest a plausible mechanism by which HMGA1 promotes chemoresistance to gemcitabine: activation of Akt signaling. PI-3K/Akt signaling is well-described as a mediator of chemoresistance to gemcitabine in the context of pancreatic cancer (20, 27, 28). These findings imply that targeted suppression or inactivation of HMGA1 could be a potential therapeutic strategy for increasing chemosensitivity to gemcitabine in this highly-chemoresistant cancer.
Proposed mechanisms by which HMGA1 regulates gene expression include derepression of gene promoters by displacement of histone H1 nucleoproteins, which are strong repressors of gene transcription, from scaffold attachment regions (SAR), thus allowing for a more open chromatin structure that facilitates transcriptional activation (29). Further, HMGA1 is able to bind to AT-rich promoter regions, where it modifies DNA conformation to facilitate binding of other transcriptional factors that promote gene transcription (30). By binding to promoter regions, HMGA1 is also able to form multiprotein complexes, the “enhanceosomes”, that serve as transcription activating complexes (30). Given these putative functions, it is not surprising that HMGA1 is involved in the regulation of a large number of target genes. Previous studies have shown that HMGA1 overexpression is associated with increased expression of growth factors/cytokines (e.g. fibroblast growth factors (FGF), interferons α and β, interleukins 10-14 and 17), growth factor receptors (e.g. FGFR, EGFR, ERBB3 and 4) and multiple integrins (α1, α6, α9, αE, β1, β3, β8) (25). Clearly, it is not surprising that through induction of these growth factor-related signaling pathways, HMGA1 could have an impact on pro-survival PI3-K/Akt pathways, as demonstrated in this study. It is also plausible that by increasing integrin expression, HMGA1 may stimulate integrin-linked kinase, which is known to directly interact with integrins and phosphorylate Akt in a PI3-K-dependent manner (31).
In the current study, we have examined the effects of silencing HMGA1 on chemoresistance in BxPC3 and MiaPaCa2 pancreatic adenocarcinoma cells. BxPC3 cells inherently express relatively high levels of HMGA1 while MiaPaCa2 cells inherently express relatively low levels of HMGA1 under baseline conditions. Because these cell lines differ in ways other than in HMGA1 expression levels alone, we examined the effects of modulating HMGA1 expression in a single cell line system. This approach allowed us to control for potential confounders, such as variable K-ras mutation status (32), inherent in comparisons involving multiple cell lines. We performed both loss-of-function (HMGA1 silencing) and gain-of-function (HMGA1 overexpression) experiments on MiaPaCa2 cells. As such, by using the same cell line and theoretically controlling for variations in genetic background, we were able to demonstrate that HMGA1 silencing reduces chemoresistance while HMGA1 overexpression results in the reverse effects on chemoresistance.
Although gemcitabine-based regimens are currently standard of care for the treatment of advanced pancreatic cancer, their efficacy is limited by profound chemoresistance. Recently, the combination of gemcitabine and the human epidermal growth factor receptor (EGFR) tyrosine kinase inhibitor erlotinib has been reported, for the first time, to be associated with improved survival over single agent gemcitabine in patients with advanced pancreatic cancer in a phase III clinical trial (33). Although these results are encouraging, the benefits provided by the addition of erlotinib are only incremental. Truly transformative increases in efficacy are likely to arise only through incorporation of targeted therapies selected on the basis of rational understanding of mechanisms mediating chemoresistance in pancreatic cancer. In this context, our findings suggest that HMGA1 warrants further investigation as a novel therapeutic target in this deadly cancer.
Fig 2. MiaPaCa2: Effects of lentivirus-mediated silencing and forced overexpression of HMGA1 on chemosensitivity to gemcitabine.

MiaPaCa2 cells were transduced with shRNA lentivirus at MOI of 10 and stable transfectants were developed following selection with puromycin. Stable silencing of HMGA1 was confirmed by Western analysis (data not shown). Two previously characterized clones (pIRES-HMGA1.1 and 1.2) of MiaPaCa2 cells which stably overexpress HMGA1 were used in this study (19). Controls were cells stably transfected with empty pIRES-puro3 vector. A, The effects of modulating HMGA1 expression on chemosensitivity to gemcitabine in MiaPaCa2 cells was assessed. In MiaPaCa2 cells, lentivirus-mediated silencing of HMGA1 resulted in marked reductions in cellular viability as compared to controls when exposed to 1μM gemcitabine for 72 hours. In contrast, MiaPaCa2 cells with HMGA1 overexpression (pIRES-HMGA1.1 and 1.2) demonstrated increased viability following exposure to 1μM gemcitabine, when compared to empty pIRES-puro3 transfectants. Photomicrographs were taken using an inverted microscope at 40X magnification. B-C, Lentivirus-mediated RNA interference of HMGA1 in MiaPaCa2 cells resulted in increases in chemosensitivity to gemcitabine with shifting of survical curves to the left while overexpression of HMGA1 led increases in chemoresistance to gemcitabine with shifting of the survival curves to the right in both pIRES-HMGA1.1 and 1.2 clones, compared to their respective controls. D, Targeted suppression of HMGA1 using lentivirus-mediated shHMGA1 resulted in 2-fold reductions in IC50 compared to control (p=0.001 versus control), while overexpression of HMGA1 in pIRES-HMGA1.1 and 1.2 clones resulted in approximately 2.2 and 1.7-fold increases in IC50 to gemcitabine respectively (p=0.003 and p=0.006 versus empty pIRES-puro3 control). *P<0.05 versus control shRNA transfectants. **P<0.05 versus empty pIRES-puro3 transfectants.
References
- 1.Jemal A, Siegel R, Ward E. Cancer statistics, 2006. CA Cancer J Clin. 2006;56:106–30. doi: 10.3322/canjclin.56.2.106. [DOI] [PubMed] [Google Scholar]
- 2.Sener SF, Fremgen A, Menck HR, Winchester DP. Pancreatic cancer: a report of treatment and survival trends for 100,313 patients diagnosed from 1985-1995, using the National Cancer Database. J Am Coll Surg. 1999;189:1–7. doi: 10.1016/s1072-7515(99)00075-7. [DOI] [PubMed] [Google Scholar]
- 3.Friedmann M, Holth LT, Zoghbi HY, Reeves R. Organization, inducible-expression and chromosome localization of the human HMG-I(Y) nonhistone protein gene. Nucleic Acids Res. 1993;21:4259–67. doi: 10.1093/nar/21.18.4259. [DOI] [PMC free article] [PubMed] [Google Scholar]
- 4.Thanos D, Maniatis T. Virus induction of human IFN beta gene expression requires the assembly of an enhanceosome. Cell. 1995;83:1091–100. doi: 10.1016/0092-8674(95)90136-1. [DOI] [PubMed] [Google Scholar]
- 5.Du W, Thanos D, Maniatis T. Mechanisms of transcriptional synergism between distinct virus-inducible enhancer elements. Cell. 1993;74:887–98. doi: 10.1016/0092-8674(93)90468-6. [DOI] [PubMed] [Google Scholar]
- 6.John S, Reeves RB, Lin JX. Regulation of cell-type-specific interleukin-2 receptor alpha-chain gene expression: potential role of physical interactions between Elf-1, HMG-I(Y), and NF-kappa B family proteins. Mol Cell Biol. 1995;15:1786–96. doi: 10.1128/mcb.15.3.1786. [DOI] [PMC free article] [PubMed] [Google Scholar]
- 7.Reeves R, Nissen MS. The A.T-DNA-binding domain of mammalian high mobility group I chromosomal proteins. A novel peptide motif for recognizing DNA structure. Journal of Biological Chemistry. 1990;265:8573–82. [PubMed] [Google Scholar]
- 8.Abe N, Watanabe T, Masaki T, et al. Pancreatic duct cell carcinomas express high levels of high mobility group I(Y) proteins. Cancer Res. 2000;60:3117–22. [PubMed] [Google Scholar]
- 9.Sarhadi V, Wikman H, Salmenkivi K, et al. Increased expression of high mobility group A proteins in lung cancer. J Pathol. 2006 doi: 10.1002/path.1960. [DOI] [PubMed] [Google Scholar]
- 10.Chang ZG, Yang LY, Wang W, et al. Determination of high mobility group A1 (HMGA1) expression in hepatocellular carcinoma: a potential prognostic marker. Dig Dis Sci. 2005;50:1764–70. doi: 10.1007/s10620-005-2934-9. [DOI] [PubMed] [Google Scholar]
- 11.Chiappetta G, Botti G, Monaco M, et al. HMGA1 protein overexpression in human breast carcinomas: correlation with ErbB2 expression. Clin Cancer Res. 2004;10:7637–44. doi: 10.1158/1078-0432.CCR-04-0291. [DOI] [PubMed] [Google Scholar]
- 12.Xu Y, Sumter TF, Bhattacharya R, et al. The HMG-I oncogene causes highly penetrant, aggressive lymphoid malignancy in transgenic mice and is overexpressed in human leukemia. Cancer Res. 2004;64:3371–5. doi: 10.1158/0008-5472.CAN-04-0044. [DOI] [PubMed] [Google Scholar]
- 13.Donato G, Martinez Hoyos J, Amorosi A, et al. High mobility group A1 expression correlates with the histological grade of human glial tumors. Oncol Rep. 2004;11:1209–13. [PubMed] [Google Scholar]
- 14.Czyz W, Balcerczak E, Jakubiak M, Pasieka Z, Kuzdak K, Mirowski M. HMGI(Y) gene expression as a potential marker of thyroid follicular carcinoma. Langenbecks Arch Surg. 2004;389:193–7. doi: 10.1007/s00423-004-0479-6. [DOI] [PubMed] [Google Scholar]
- 15.Balcerczak M, Pasz-Walczak G, Balcerczak E, Wojtylak M, Kordek R, Mirowski M. HMGI(Y) gene expression in colorectal cancer: comparison with some histological typing, grading, and clinical staging. Pathol Res Pract. 2003;199:641–6. doi: 10.1078/0344-0338-00475. [DOI] [PubMed] [Google Scholar]
- 16.Tamimi Y, van der Poel HG, Karthaus HF, Debruyne FM, Schalken JA. A retrospective study of high mobility group protein I(Y) as progression marker for prostate cancer determined by in situ hybridization. Br J Cancer. 1996;74:573–8. doi: 10.1038/bjc.1996.403. [DOI] [PMC free article] [PubMed] [Google Scholar]
- 17.A retrospective study of high mobility group protein I(Y) as progression marker for prostate cancer determined by in situ hybridization. Br J Cancer. 1996;74:573–8. doi: 10.1038/bjc.1996.403. [DOI] [PMC free article] [PubMed] [Google Scholar]
- 18.Liau SS, Jazag A, Whang EE. HMGA1 is a determinant of cellular invasiveness and in vivo metastatic potential in pancreatic adenocarcinoma. Cancer Res. 2006;66:11613–22. doi: 10.1158/0008-5472.CAN-06-1460. [DOI] [PubMed] [Google Scholar]
- 19.Liau SS, Jazag A, Ito K, Whang EE. Overexpression of HMGA1 promotes anoikis resistance and constitutive Akt activation in pancreatic adenocarcinoma cells. Br J Cancer. 2007;96:993–1000. doi: 10.1038/sj.bjc.6603654. [DOI] [PMC free article] [PubMed] [Google Scholar]
- 20.Duxbury MS, Ito H, Benoit E, Waseem T, Ashley SW, Whang EE. A novel role for carcinoembryonic antigen-related cell adhesion molecule 6 as a determinant of gemcitabine chemoresistance in pancreatic adenocarcinoma cells. Cancer Res. 2004;64:3987–93. doi: 10.1158/0008-5472.CAN-04-0424. [DOI] [PubMed] [Google Scholar]
- 21.Ng SSW, Tsao MS, Chow S, Hedley DW. Inhibition of Phosphatidylinositide 3-Kinase Enhances Gemcitabine-induced Apoptosis in Human Pancreatic Cancer Cells. Cancer Res. 2000;60:5451–5. [PubMed] [Google Scholar]
- 22.Ng SSW, Tsao MS, Nicklee T, Hedley DW. Wortmannin Inhibits PKB/Akt Phosphorylation and Promotes Gemcitabine Antitumor Activity in Orthotopic Human Pancreatic Cancer Xenografts in Immunodeficient Mice. Clin Cancer Res. 2001;7:3269–75. [PubMed] [Google Scholar]
- 23.Sarbassov DD, Guertin DA, Ali SM, Sabatini DM. Phosphorylation and regulation of Akt/PKB by the rictor-mTOR complex. Science. 2005;307:1098–101. doi: 10.1126/science.1106148. [DOI] [PubMed] [Google Scholar]
- 24.Liau SS, Ashley SW, Whang EE. Lentivirus-mediated RNA interference of HMGA1 promotes chemosensitivity to gemcitabine in pancreatic adenocarcinoma. J Gastrointest Surg. 2006;10:1254–62. doi: 10.1016/j.gassur.2006.06.011. discussion 63. [DOI] [PubMed] [Google Scholar]
- 25.Reeves R, Edberg DD, Li Y. Architectural transcription factor HMGI(Y) promotes tumor progression and mesenchymal transition of human epithelial cells. Mol Cell Biol. 2001;21:575–94. doi: 10.1128/MCB.21.2.575-594.2001. [DOI] [PMC free article] [PubMed] [Google Scholar]
- 26.Wood LJ, Maher JF, Bunton TE, Resar LM. The oncogenic properties of the HMG-I gene family. Cancer Res. 2000;60:4256–61. [PubMed] [Google Scholar]
- 27.Bondar VM, Sweeney-Gotsch B, Andreeff M, Mills GB, McConkey DJ. Inhibition of the phosphatidylinositol 3′-kinase-AKT pathway induces apoptosis in pancreatic carcinoma cells in vitro and in vivo. Mol Cancer Ther. 2002;1:989–97. [PubMed] [Google Scholar]
- 28.Fahy BN, Schlieman MG, Virudachalam S, Bold RJ. Inhibition of AKT abrogates chemotherapy-induced NF-kappaB survival mechanisms: implications for therapy in pancreatic cancer. J Am Coll Surg. 2004;198:591–9. doi: 10.1016/j.jamcollsurg.2003.12.005. [DOI] [PubMed] [Google Scholar]
- 29.Zhao K, Kas E, Gonzalez E, Laemmli UK. SAR-dependent mobilization of histone H1 by HMG-I/Y in vitro: HMG-I/Y is enriched in H1-depleted chromatin. Embo J. 1993;12:3237–47. doi: 10.1002/j.1460-2075.1993.tb05993.x. [DOI] [PMC free article] [PubMed] [Google Scholar]
- 30.Yie J, Merika M, Munshi N, Chen G, Thanos D. The role of HMG I(Y) in the assembly and function of the IFN-beta enhanceosome. Embo J. 1999;18:3074–89. doi: 10.1093/emboj/18.11.3074. [DOI] [PMC free article] [PubMed] [Google Scholar]
- 31.Tabe Y, Jin L, Tsutsumi-Ishii Y, et al. Activation of integrin-linked kinase is a critical prosurvival pathway induced in leukemic cells by bone marrow-derived stromal cells. Cancer Res. 2007;67:684–94. doi: 10.1158/0008-5472.CAN-06-3166. [DOI] [PubMed] [Google Scholar]
- 32.Aoki K, Yoshida T, Matsumoto N, Ide H, Sugimura T, Terada M. Suppression of Ki-ras p21 levels leading to growth inhibition of pancreatic cancer cell lines with Ki-ras mutation but not those without Ki-ras mutation. Mol Carcinog. 1997;20:251–8. [PubMed] [Google Scholar]
- 33.Moore MJ, Goldstein D, Hamm J, et al. J Clin Oncol. 2005. Erlotinib plus gemcitabine compared to gemcitabine alone in patients with advanced pancreatic cancer. A phase III trial of the National Cancer Institute of Canada Clinical Trials Group [NCIC-CTG] pp. 23–1. Meeting Abstracts. [Google Scholar]