

Abstract
Rats treated with (+)-methamphetamine (MA) on postnatal (P) days 11−20 exhibit long-term spatial and path integration (Morris and Cincinnati water mazes) learning deficits whereas those treated on P1−10 do not. MA-treatment increases corticosterone release in an age-dependent U-shaped pattern that corresponds to the stress hyporesponsive period (SHRP; P4−15). Here we tested the hypothesis that the cognitive effects induced by MA are associated with treatment that begins within the SHRP. Three treatment regimens were compared, P1−10, 6−15, and 11−20. One male/female pair/litter received 0, 10, or 25 mg/kg MA/dose (4 doses/day at 2 h intervals given s.c. with 19−21 litters/regimen). Locomotor activity and acoustic startle were tested as behaviors not predicted to be associated with the SHRP. Cincinnati and Morris water maze findings were consistent with the hypothesis in that MA-treated animals exposed from P6−15 or P11−20 showed impaired learning compared to those exposed from P1−10; however, on probe trials in the Morris water maze, MA-induced memory impairments were not regimen-specific and were contributed to by all treatment regimens. All MA treatment regimens induced reductions in locomotor activity and acoustic startle facilitation as expected. No differential effect on prepulse trials was seen suggesting no impairment in sensory gating. Cognitive deficits from neonatal MA treatment are associated with the SHRP and may be the product of hypothalamic-pituitary-adrenal axis dysregulation during critical periods of brain development.
Keywords: methamphetamine, amphetamine, spatial learning, reference memory, path integration, acoustic startle, locomotor activity, development
1. Introduction
(+)-Methamphetamine (MA) is widely abused among adolescents (12th grade) and young adults. Annual prevalence rates over the last five years range from 1.5−3.2% (Johnston et al., 2008a;Johnston et al., 2008b), half of whom are women.
Infants prenatally exposed to MA (Little et al., 1988) or MA and cocaine are more likely to be born premature, have reduced birth weight, and have intraventricular hemorrhages (Dixon and Bejar, 1989;Oro and Dixon, 1987). They also show signs of withdrawal on the Finnegan scale (Dixon, 1989). Flash-evoked visual potentials were abnormal in 78% of prenatally MA-cocaine exposed infants and they exhibited reduced visual recognition memory on the Fagan Test of Infant Intelligence (Struthers and Hansen, 1992). Reduced creatine and glutamate/glutamine ratios have also been reported using magnetic resonance spectroscopy (Smith et al., 2001), and reductions in hippocampus and forebrain size were found by volumetric magnetic resonance imaging in prenatally MA-exposed children (Chang et al., 2004). In a prospective study, prenatally MA exposed infants had reduced birth weight and increased rates of SGA (small for gestational age) (Smith et al., 2006). Fifty-six percent of the MA abusing women used the drug during the first and second trimesters and 44% used during all trimesters (Smith et al., 2006). A Thai study confirmed that infants prenatally exposed to MA exhibit reduced birth weight and head circumference, have higher rates of SGA, and show increased agitation, vomiting, and tachypnea compared to a non-exposed group (Chomchai et al., 2004).
The brain develops later and over a longer period of development than most other organs. Brain development begins during embryogenesis and continues through fetogenesis and the neonatal period. Structures important for learning and memory (e.g., hippocampus) develop relatively late in relation to other brain regions. Recently developed algorithms comparing brain development in multiple mammalian species (Clancy et al., 2007b;Clancy et al., 2007a), show that rat neonatal development approximates human brain development during the second and third trimester for limbic and cortical structures (see: www.translatingtime.net) which is consistent with previous analyses (Bayer et al., 1993;Herlenius and Lagercrantz, 2004;Rice and Barone, Jr., 2000;Watson et al., 2006;West and Pierce, 1987).
Based on such comparisons we investigated the neonatal rat as a model of second to third trimester human brain development. Rats exposed to MA on postnatal day (P)11−20 exhibited spatial learning and memory impairments in the Morris water maze (MWM), increased startle reactivity, reductions in locomotor activity, and a tendency toward increased errors in the Cincinnati water maze (CWM) under ambient light, whereas rats exposed on P1−10 exhibited similar startle and activity effects, but were unaffected on the cognitive tasks (Vorhees et al., 1994a;Vorhees et al., 1994b;Vorhees et al., 1996). The significant effects of P11−20 MA treatment on MWM (Vorhees et al., 1998;Vorhees et al., 1999;Vorhees et al., 2000;Vorhees et al., 2007;Vorhees et al., 2008;Williams et al., 2002;Williams et al., 2003;Williams et al., 2004) and the CWM under ambient light have been replicated (Williams et al., 2003). We recently demonstrated that when tested in the absence of ambient light (using infrared light) to prevent access to distal cues, P11−15 MA treatment results in significant CWM learning deficits (Vorhees et al., 2008).
Treatment of developing animals with MA causes release of corticosterone that shows protracted elevation (Schaefer et al., 2006;Schaefer et al., 2008;Williams et al., 2006). Neonatal exposure to stressors or direct glucocorticoid injections results in deleterious long-term behavioral effects (Meaney et al., 1988). This period of vulnerability coincides with what is known as the stress hyporesponsive period (SHRP). The SHRP (P4−14) is an interval during which basal corticosterone levels are low and the adrenal response to stress is attenuated compared to earlier or later periods of development (Sapolsky and Meaney, 1986). Stress during the SHRP results in increased ACTH and corticosterone levels but because baseline levels during this period are low, these increases remain below those seen later in development. Interestingly the increases in corticosterone during this period last longer than those caused by stressors later in development (Vazquez, 1998). The SHRP is hypothesized to be neuroprotective against stress-induced over-stimulation of glucocorticoid receptors (Sapolsky and Meaney, 1986;Sapolsky, 1996). If correct and given that MA treatment induces a hypothalamic-pituitary-adrenal (HPA) axis over-response, MA treatment beginning during the SHRP should lead to more severe long-term CNS effects than exposures that begin outside the SHRP. We have shown that the acute adrenal response to MA matches the SHRP, with MA-induced increases that are lower in absolute terms on days P5−14 than those caused by the drug earlier or later and that MA-induced corticosterone increases were disproportionately increased following repetitive dosing (Williams et al., 2006).
Accordingly, the purpose of this experiment was to compare the effects of neonatal MA treatment after exposure during one of three intervals. Exposure intervals P11−20 and P1−10 were chosen because the former shows cognitive affects and the latter does not, and P6−15 was chosen because it aligns with the SHRP. We hypothesized that P6−15 exposure would cause more severe affects than P11−20. We predicted that acoustic startle and locomotor activity would be affected by all exposure periods since we previously found augmented startle and reduced locomotion after P1−10 or P11−20 MA treatment. We included two doses of MA to ensure that cognitive effects from the P1−10 exposure were not missed because of dose.
2. Methods and materials
2.1 Subjects
Nulliparous female Sprague-Dawley CD, IGS rats (Charles River, Raleigh, NC) were bred in house to males of the same strain and supplier. Evidence of pregnancy was designated as E0 (embryonic day zero) and most females delivered on E22. Birth was designated P0 and litters were culled randomly to 4 males and 4 females on P1 and marked with India ink with an identifier code. Animals were maintained in polycarbonate shoebox cages (46 × 24 × 20 cm) on a 14 h light/10 h dark cycle (lights on at 600 h) with food (Purina 5001) and water available ad libitum in a vivarium maintained at 21 ± 1°C with 50 ± 10% humidity and accredited by the Association for the Accreditation and Assessment of Laboratory Animal Care (AAALAC). All testing was conducted during the light cycle. The research protocol was approved by the Cincinnati Children's Research Foundation's Animal Care and Use Committee. Within each litter, a male and female pair was assigned to one of the following treatment groups: 0 (saline), 10, or 25 mg/kg MA, with the fourth pair also treated with 25 mg/kg as a reserve pair in the event of a death. Doses were based on interspecies scaling (Mordenti and Cappell, 1989) and other considerations discussed elsewhere (Vorhees et al., 2007). (+)-Methamphetamine HCl (expressed as the free base and >95% pure) was obtained from the National Institute on Drug Abuse. The drug was dissolved in sterile isotonic saline and injected subcutaneously 4 times per day at 2 h intervals. The dosing volume was 3 ml/kg. Doses were adjusted to body weight at every dosing time on every treatment day. The groups are hereafter referred to as Sal, MA10, and MA25. Nineteen to twenty-one litters were treated at each of the three treatment regimens (P1−10, 6−15, or 11−20) for a total of 60 litters. Litters were raised in box cages and housed two per cage of the same sex after separation from their dams on P28. At weaning, extra MA25 animals were used as place holders so that animals going through behavioral testing were not isolated. Each cage contained an environmental enhancement which was a stainless steel semicircular enclosure (17.8 cm long with the open side 18.4 cm across and 10.2 cm high when positioned with the open side down; made of #304 16-gauge stainless steel) to comply with AAALAC guidelines to enrich the housing of all laboratory rodents. These enclosures were previously found not to interact with MA treatment on tests of learning and memory or locomotor activity (Vorhees et al., 2008).
Offspring were weighed on all treatment days and weekly thereafter through the end of the experiment on P98.
2.2 Locomotor Activity
On P60 each animal was tested for 1 h in locomotor activity chambers (41 × 41 cm; AccuScan Electronics, Columbus, OH) as a test of spontaneous locomotor activity. Multiple measures of movement (horizontal activity, total distance, central and peripheral time, and vertical activity or rearing) were obtained from the software program in 5 min intervals. The test chambers were cleaned between animals with a 70% ethanol solution.
2.3 Acoustic Startle/Prepulse Inhibition (PPI)
This test of sensory gating was conducted on P61. Rats were tested in San Diego Instruments SR Lab startle apparatus (San Diego Instruments, San Diego, CA). Each rat was placed inside a sound-attenuating test chamber inside an inner cylindrical acrylic holder (10 × 20 cm internal) with sliding doors at each end and house light mounted in the ceiling of each chamber. The cylindrical holder had a piezoelectric force transducer mounted beneath it that was sensitive to the animal's movements. Each test session began with a 5 min acclimation period with no signal presented. At the end of the acclimation period, animals received a series of randomly presented trials with an intertrial interval of 8 s. There were four trial types: no signal, startle signal alone, prepulse of 70 dB + startle signal or prepulse of 76 dB + startle signal. The four trial types were presented in a Latin square design to balance the order of each type of trial, such that one Latin square consisted of 16 trials. This set was repeated 3 times for a total of 48 trials. The inter-stimulus interval on prepulse trials was 70 ms and the startle signal consisted of a mixed frequency white noise burst of 120 dB SPL for 20 ms. Ambient background sound level within the test chamber was 64 dB. The response was recorded for 100 ms after startle signal onset and the measured variables recorded were peak amplitude, average response amplitude, and latency to peak amplitude (measured in arbitrary mV units). Trials of each type were averaged together. The apparatus was cleaned with a 70% ethanol solution between animals.
2.4 Straight Channel
On P62 animals were assessed in a 15 × 244 cm straight swimming channel with a wire escape ladder mounted at one end to test swimming speed and motivation to escape. Each rat received 4 consecutive trials on the test day. On each trial, the rat was placed at one end facing the end wall and timed until it grasped the escape at the opposite end (maximum time = 2 min/trial).
2.5 Cincinnati Water Maze (CWM)
The CWM (a test of path integration) was conducted for 15 days from P63−77. The design of the maze is as previously described (Vorhees, 1987;Vorhees et al., 1991) and consists of 9 T-shaped cul-de-sacs that branch from a central channel extending from the starting point to the goal where an escape ladder is located. The arms of the T's and the channels are 15 cm wide and the walls are 51 cm high. The maze was filled with water to a depth of 25 ± 1 cm and maintained at room temperature (21 ± 1°C). Testing was performed under infrared light with an infrared light emitter mounted directly above the maze to enhance image quality of the camera. Testing under infrared light was designed to eliminate extramaze cues and prevent the animal from using a spatial navigation strategy. To begin each trial, an animal was placed in the maze at the start position and allowed up to 5 min to find the goal. Two trials per day were administered with a minimum 5-min intertrial interval (ITI). Errors, latency to escape, and number of start returns were recorded by an experimenter viewing the maze on a closed circuit video monitor located in an adjacent room. An error was defined as a head and shoulder entry into one of the arms of a T. Occasionally an animal cannot find the escape and after multiple trials slows its pace of exploration. To correct for this, error scores for these animals are adjusted to a value of 1 more error than the score of the worst performing animal.
2.9 Morris Water Maze (MWM)
The MWM, an established test of spatial learning and reference memory, was conducted in a 210 cm diameter tank, made of stainless steel and painted flat black (Vorhees and Williams, 2006). The maze was surrounded on all sides by white curtains that could be opened or closed to reveal or obscure room cues. In addition to the indigenous room cues, the 3 walls nearest the maze (representing arbitrarily N, E, and W walls of the test room) had large geometric figures mounted above the edge of the pool. The experimenter stood at the “S” position during testing and remained stationary. Testing was conducted in 3 phases: acquisition, reversal, and shift. Each phase consisted of 4 trials per day for 5 consecutive days with the curtains open; this was followed by one additional day when a single probe trial was given. Probe trials lasted for 30 s with no platform present. The time limit on learning trials was 2 min and the ITI was 15 s spent on the platform. Animals not finding the platform within 2 min were placed on the platform. Goal platforms (with diameters of 10, 7, or 5 cm) were made of black acrylic with thin nylon screening attached to the surface to provide traction. During testing the platform was positioned 2−3 cm below the surface of the water and was camouflaged by virtue of being transparent against a black background. Water temperature was 21 ± 1°C.
The acquisition phase occurred on P79−84. During acquisition, the platform was located in the SW quadrant halfway between the center and the side of the tank. Rats were started at one of four positions located distal to the quadrant containing the platform in a random order with the restraint that they received one trial from each of the four starting positions per day. Rats were tested for 5 consecutive days. The start positions used were: NW, N, E, and SE. These positions were used to eliminate short paths to the goal, such as those that are possible if S or W starts are used. On the sixth day, the platform was removed and a 30 s reversal probe trial was administered. For the probe trial, rats were started from a new position (NE).
On P86−91 rats were tested in reversal with a 7 cm diameter platform placed in the NE quadrant. The smaller platform was used to increase the spatial accuracy required to locate the platform. The same procedure was used as for acquisition (5 days; 4 trials/day). Start positions were SE, S, W, and NW during the learning phase and SW for the probe trial.
On P93−98 rats were tested in the MWM in the shift phase. During this phase a 5 cm diameter platform was used and was positioned in the NW quadrant. Start positions were NE, E, S, and SW. As before, 24 h after the last learning trial, a single 30 s probe trial was given, with animals started from the SE position.
On P99−100 rats were tested in the cued version of the MWM to ensure that they can swim normally and see well enough to be able to locate a visible platform. For this procedure, the 10 cm diameter platform was used and it remained submerged, but had a plastic ball attached to a rod that protruded above the surface of the water to mark the platform's location. The curtains were closed around the tank to minimize extramaze cues and the animals were given four trials per day for two days with the platform and start positions changed for every trial so spatial strategies to solve the task would be ineffective.
Performance during the hidden platform phases was recorded using AnyMaze video tracking software (Stoelting Company, Wood Dale, IL), whereas a stopwatch was used to record latencies during the cued phase. For the learning trials, path length, cumulative distance from the platform, latency and swim speed were analyzed. The tracker recorded the animal's position every 100 ms. For the probe trials, dependent measures were time and distance in the target quadrant, number of site crossovers, average distance from the site, and Mean Search Difference (MSD). MSD was defined as MSD = Σ [(q1–q2) + (q1-q3) + (q1-q4)] ÷ 3, where q1 = target quadrant.
2.11 Statistical Procedures
Because the experiment used a split-litter design, offspring were matched on multiple factors by virtue of being littermates. In order to ensure that litter effects were controlled, litter was used as a block (random) factor in completely randomized block analyses of variance (ANOVA). Dosing regimen, treatment group (dose) and sex were between factors within each block and litter was the block factor. Measures taken repetitively on the same animal, such as trial, day, or test interval, were repeated measure factors. Hence the design was a 3-between (regimen; group; sex) × 1-within randomized block ANOVA. Data were analyzed using mixed linear ANOVA models (SAS Proc Mixed, SAS Institute, Cary, NC). The covariance matrix for each data set was checked using best fit statistics. In most cases the best fit was to the autoregressive-1 (AR(1)) covariance structure. The Kenward-Rogers method of calculating degrees of freedom was used. This model calculates adjusted degrees of freedom that do not match those obtained from general linear ANOVAs and can be fractional. Significant interactions were analyzed using simple-effect slice ANOVAs at each level of the repeated measure factor. For these cases where specific predictions of effects were made, directional tests were used using the step-down method of Hochberg (SAS Institute, Cary, NC). Data are presented as least square (LS) means ± LS SEM (except for mortality) since Proc Mixed uses these for inferential analysis. Acoustic startle data were analyzed two ways: (a) by ANOVA using prepulse level as a repeated measure and (b) by analysis of covariance (ANCOVA) with no-prepulse trials used as the covariate. Mortality data were analyzed using Fisher's test for uncorrelated proportions.
3. Results
3.1 General Characteristics
The experimental plan was for 20 litters per treatment regimen however, an extra litter was added to the P1−10 and P6−15 regimens because of increased mortality in the MA25 dose. In the P11−20 regimen an assignment error occurred, leaving 19 litters. Hence the final number of litters and surviving offspring are shown in Table 1. Table 1 also shows offspring mortality. As can been seen, the MA25 treatment increased offspring mortality compared to Sal and MA10 groups. This effect was greatest in the P1−10 treatment regimen, second largest in the P6−15 regimen, and least severe in the P11−20 regimen. No significant increase in offspring mortality occurred in the MA10 treated group for any regimen relative to the Sal groups. Because of the extra pair of offspring/litter assigned to the MA25 treatment, there were adequate numbers of offspring remaining for behavioral testing in all the MP25 groups, and in fact there were more than needed to meet the design of the experiment; hence, at weaning extra offspring (i.e., anything above 1 male and 1 female/litter) were not weighed or tested but only used as cagemates so that all animals were pair-housed. Although animals in the MA25 group were small for their age by the end of treatment they were not otherwise outwardly compromised.
Table 1.
Entries represent number of litters in the experiment, offspring mortality (percent dying), and number surviving as a function of treatment regimen and MA dose.
| |
|
|
Group |
|
|---|---|---|---|---|
| |
No. of litters |
Sal |
MA10 |
MA25 |
| Regimen |
|
|
|
|
| P1−10 | 21 | 0/42 (0%) | 2/42 (7.2%)1 | 58/83 (69.9%)** |
| |
|
42 |
40 |
25 |
| P6−15 | 21 | 1/42 (2.1%) | 2/42 (2.1%) | 24/84 (28.6%)** |
| |
|
41 |
41 |
60 |
| P11−20 | 19 | 0/38 (0%) | 0/38 (0%) | 13/74 (17.6%)** |
| 38 | 38 | 61 |
In Table 3 this number is 39 because of missing body weight data.
P < 0.01 from Sal and MA10.
Offspring body weights during dosing were analyzed separately for each regimen. Table 2 shows representative body weights at the beginning and end of dosing. Groups did not differ on the first day of treatment for any treatment regimen. Significant body weight decreases emerged on the second or third day of treatment and remained lower throughout the period of drug treatment for both the MA10 and MA25 groups compared to Sal (see Table 2).
Table 2.
Offspring average body weight (g) shown on the first and last day of dosing for each treatment regimen (see Table 3 for the number tested). Data are Least Square (LS) mean (± LS SEM) of males and females.
| Regimen | Sal | MA10 | MA25 |
|---|---|---|---|
| P1−10a | Males | ||
| P1 | 7.0 ± 0.4 | 7.0 ± 0.4 | 6.7 ± 0.5 |
| P10 | 26.0 ± 0.4 | 16.4 ± 0.4* | 14.8 ± 0.5* |
| Females | |||
| P1 | 6.6 ± 0.4 | 6.8 ± 0.4 | 6.8 ± 0.5 |
| P10 | 25.0 ± 0.4 | 16.1 ± 0.4* | 14.5 ± 0.5* |
| P6−15b | Males | ||
| P6 | 15.8± 0.7 | 15.6 ± 0.7 | 15.7 ± 0.6 |
| P15 | 41.4± 0.7 | 25.7 ± 0.7* | 21.3 ± 0.6* |
| Females | |||
| P6 | 14.9 ± 0.7 | 15.2 ± 0.7 | 15.5 ± 0.6 |
| P15 | 38.5 ± 0.7 | 27.0 ± 0.7* | 21.4 ± 0.6* |
| P11−20c | Males | ||
| P11 | 29.4 ± 0.9 | 28.9 ± 0.9 | 29.3 ± 0.8 |
| P20 | 57.0 ± 0.9 | 39.8 ± 0.9* | 32.3 ± 0.8* |
| Females | |||
| P11 | 28.4 ± 0.9 | 28.6 ± 0.9 | 28.5 ± 0.8 |
| P20 | 53.2 ± 0.9 | 39.0 ± 0.9* | 33.3 ± 0.8* |
Group main effect (F(2,87.9) = 119.12, p < 0.0001), sex main effect (ns), day main effect (F(9,892) = p < 0.0001), group × day interaction (F(18,896) = 90.10, p < 0.0001). No other effects were significant. There were no group differences on P1 or P2 and significant effects on P3−10 (all p < 0.0001).
Group main effect (F(2,157) = 209.24, p < 0.0001), sex main effect (ns), day main effect (F(9,1455) =573.05, p < 0.0001), group × sex interaction (F(2,157) = 2.95, p = 0.055), group × day interaction (F(18,1461) = 95.41, p < 0.0001). No other effects were significant. There were no group differences on P6 and significant differences on P7−15 (P7 and P8: Sal vs. MA25 or MA10 p < 0.0002; P9−15: Sal vs. MA25 or MA10, all p < 0.0001).
Group main effect (F(2,140) = 333.19, p < 0.0001), sex main effect (F(1,136) = 6.65, p < 0.02), day main effect (F(9,1219) = 323.72, p < 0.0001), group × sex interaction (F(2,140) = 3.55, p < 0.04), group × day (F(18,1229) = 68.71, p < 0.0001), and group × sex × day (F(18,1230) = 1.60, p < 0.052). No other effects were significant. There were no group differences on P11 and significant effects on P12−20 (P12: Sal vs. MA25 p < 0.005, Sal vs. MA10 p < 0.002; P13−14: Sal vs. MA25 or MA 10 all p < 0.0002; P15−20: Sal vs. MA25 or MA10, all p < 0.0001).
p < 0.001 vs. Sal
Offspring body weights after dosing were analyzed separately for preweaning and postweaning ages. Representative body weights are shown in Table 3 with the total number of animals tested. Group differences in body weight were significant on P21 (Table 3) and P28 (not shown) with both the MA10 and MA25 groups weighing significantly less than Sal controls. By P56, the last weight taken before behavioral testing began on P60, the MA25-treated group males and females weighed significantly less in all regimens except for the females in the P11−20 regimen. For the MA10 group males, body weights were reduced in the P1−10 and P6−15 regimens but not in the P11−20 regimen. For MA10 females, no regimen showed significantly reduced body weight on P56. By the end of testing on P98, both MA treatment groups had body weights comparable to Sal controls except for the MA25 males and females in the P1−10 and P6−15 regimens (Table 3).
Table 3.
Offspring body weight expressed as LS mean (g) ± LS-SEM (percent reduction) from P21−98. P56 was chosen to show body weight shortly before the start of behavioral testing. P98 was chosen to show body weight at the conclusion of behavioral testing.
| Regimen | Sal | MA10 | MA25 |
|---|---|---|---|
| P1−10 | Males | ||
| 21a | 62.6 ± 1.7 | 45.0 ± 1.8** (27.3%) | 36.7 ± 2.0** (41.4%) |
| 56b | 364.3 ± 6.9 | 321.9 ± 7.2** (11.6%) | 314.0 ± 8.4** (13.8%) |
| 98b | 527.1 ± 6.9 | 477.6 ± 7.2** (9.4%) | 491.2 ± 8.4** (6.8%) |
| N | 21 | 19 | 14 (10)c |
| P6−15 | |||
| 21a | 65.8 ± 1.7 | 44.4 ± 1.7** (32.5%) | 35.3 ± 1.7** (46.4%) |
| 56b | 357.6 ± 6.9 | 326.9 ± 7.1** (8.6%) | 298.9 ± 6.5** (16.4%) |
| 98b | 532.4 ± 6.9 | 487.6 ± 7.1** (8.4%) | 460.1 ± 6.5** (13.6%) |
| N | 21 | 20 | 26 (17)c |
| P11−20 | |||
| 21a | 62.9 ± 1.8 | 42.8 ± 1.8** (32.0%) | 35.3 ± 1.7** (43.9%) |
| 56b | 358.7 ± 7.3 | 343.0 ± 7.3 (4.4%) | 321.3 ± 6.4** (10.4%) |
| 98b | 526.8 ± 7.3 | 523.4 ± 7.4 (0.6%) | 521.8 ± 6.5 (0.9%) |
| N | 19 | 19 | 28 (17)c |
| P1−10 | Females | ||
| 21a | 60.7 ± 1.7* | 45.4 ± 1.7** (25.2%) | 38.2 ± 2.1** (37.1%) |
| 56b | 232.4 ± 6.9 | 218.6 ±7.1 (5.9%) | 206.3 ± 8.9* (11.2%) |
| 98b | 312.5 ± 6.9 | 296.0 ± 7.1 (5.3%) | 277.2 ± 9.1* (11.3%) |
| N | 21 | 20 | 11 (10)c |
| P6−15 | |||
| 21a | 61.6 ± 1.7 | 46.2 ± 1.7** (25.0%) | 36.0 ± 1.6** (41.6%) |
| 56b | 229.8 ± 7.1 | 219.0 ± 6.9 (4.7%) | 201.6 ± 5.9** (12.3%) |
| 98b | 304.1 ± 7.1 | 301.4 ± 6.9 (0.9%) | 284.7 ± 5.9* (6.4%) |
| N | 20 | 21 | 34 (20)c |
| P11−20 | |||
| 21a | 58.2 ± 1.8 | 41.8 ± 1.8** (28.2%) | 35.8 ± 1.6** (38.5%) |
| 56b | 229.3 ± 7.3 | 226.7 ± 7.3 (1.1%) | 213.8 ± 6.0 (6.8%) |
| 98 | 313.7 ± 7.9 | 307.5 ± 7.4 (2.0%) | 301.6 ± 6.1 (3.9%) |
| N | 19 | 18 | 33 (18)c |
P21 and 28 (preweaning) body weights were analyzed together. Significant effects were the group main effect (F(2,316) =995.13, p < 0.0001), sex main effect (F(1,312) = 34.61, p < 0.0001), day main effect (F(1,370) = p < 0.0001), group × sex interaction (F(2,312) = 15.92, p < 0.0001), group × regimen (F(4,315) = 4.11, p < 0.003), group × day interaction (F(2,370) = 15.96, p < 0.0001), sex × day (F(1,370) = 73.52, p < 0.0001), group × sex × week (F(2,370) = 5.32, p < 0.01, regimen × day (F(2,370) = 20.9, p < 0.0001), and group × regimen × day (F(4,370) = 4.92, p < 0.001. No other effects were significant.
P35−98 (postweaning) body weights were analyzed together. Significant effects were the group main effect (F(2,321) = 76.82, p < 0.0001), sex main effect (F(1,315) = 3342.84, p < 0.0001), day main effect (F(9,3267) = 8738.13, p < 0.0001), group × regimen interaction (F(4,320) = 5.29, p < 0.001), sex × day interaction (F(9,3268) = 1114.35, p < 0.0001), regimen × day (F(18,3267) = 6.77, p < 0.0001), and group × regimen × day (F(36,3268) = 1.46, p < 0.04). No other effects were significant. When the latter interaction was further sorted with separate analysis on P56 and P98, both MA-treated groups showed weight reductions at the beginning of behavioral testing but these dissipated between P56−98 and became non-significant the MA10 group in all 3 regimens for females but remained significantly reduced in males for the P1−10 and P6−15 regimens. For the MA25 groups body weight reductions remained longer and did not catch up to Saline controls in the P1−10 or P6−15 regimens for males, but did for the P11−20 males. MA25 females showed catch up in both the P6−15 and P11−20 regimens.
Number in parentheses represents the number of animals remaining for behavioral testing after culling in the MA25 group which had extra animals assigned to it. One or both of these extra animals were included if the litter was short a high dose animal because of mortality but removed if the original male or female in the litter survived.
p < 0.05 vs. Sal
p< 0.001 vs. Sal
3.2 Locomotor Activity
There were significant main effects of group (F(2,266) = 21.67, p < 0.0001) and sex (F(1,261) = 4.3, p < 0.05; females were more active than males) on horizontal activity, as well as a main effect of interval (p < 0.0001) and a group × interval interaction (F(22,3154) = 2.31, p < 0.001), but no regimen main effect or interactions of regimen and group. The MA25 group was less active during the exploratory, habituation, and baseline phases. This effect diminished but did not entirely disappear as the animals reached asymptotic baseline levels. The MA10 group showed less of an effect compared to the MA25 group, but they were still significantly less active during the 10 and 15 min intervals with a trend for hypoactivity at the 5 min interval relative to the Sal group (Fig. 1). The treatment main effect is illustrated in the Fig. 1 inset). Analyses of other indices of activity (total, central, and peripheral distance traveled, and rearing) showed the same pattern of differences; the data for these measures showed no indication of differential spatial distribution of activity differences (central vs. peripheral changes) and no indication that the MA-induced reduction in horizontal activity was shifted to increased rearing; in fact both MA-treated groups showed significantly reduced rearing, paralleling the changes horizontal movements.
Fig. 1.

Locomotor Activity averaged across exposure regimens: Rats were tested for 1 h during the light phase of the light/dark cycle. Ordinate shows horizontal activity (total number of photobeam interruptions per 5 min interval). Data are LS mean (± LS-SEM) with males and females combined. Inset: treatment group main effect averaged across regimen, sex, and interval. See tables for group sizes. †p < 0.10, *p < 0.05, **p < 0.01, ***p < 0.001 vs. Sal.
3.3 Acoustic Startle/PPI
Maximum startle amplitude was analyzed by prepulse using a group × regimen × sex × prepulse ANOVA (Fig. 2). The main effect of group was significant (F(2,245) = 2.6, p < 0.03; Fig. 2 (inset)). The main effect of prepulse was also significant (p < 0.0001). Neither sex nor regimen were significant nor were any of the interactions with the exception of the sex × prepulse interaction (p < 0.01) in which males showed larger responses and greater change in the presence of prepulses. ANCOVA with the no-prepulse trials used as the covariate showed no significant effect of MA treatment on PPI as an index of sensory gating.
Fig. 2.
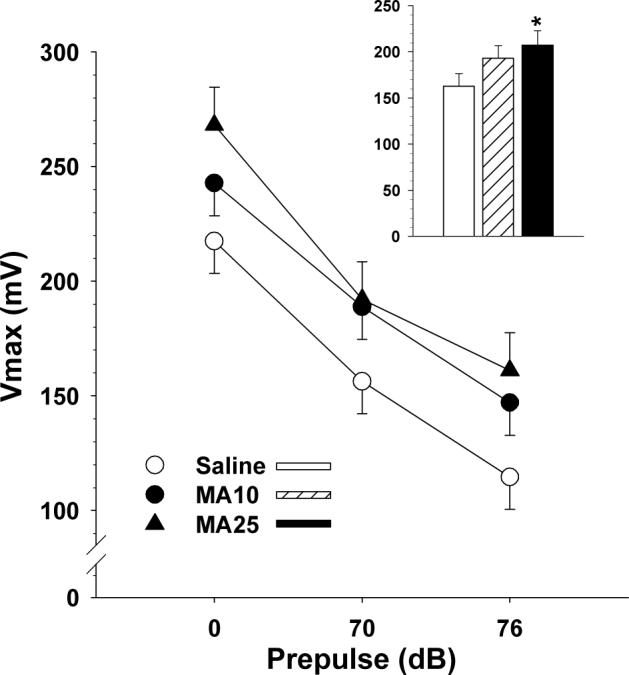
Prepulse Inhibition of Acoustic Startle: LS mean (± LS-SEM) acoustic startle amplitude (Vmax = maximum amplitude recorded 100 ms post-stimulus onset measured in arbitrary units of voltage change (mV)) verses prepulse intensity (dB, SPL). PP = prepulse intensity (dB). Inset: group main effect averaged across regimens and prepulse intensities. Trials with no stimulus given were interspersed as an internal check on equipment function (not shown). See tables for group sizes. *p < 0.05 vs. Sal.
3.4 Straight Channel
No group main effect or group-related interactions were found on straight channel swimming latencies. The only significant effect was trial (p < 0.0001) which was attributable to the progressive improvement of all groups in traversing the channel across successive trials.
3.5 Cincinnati Water Maze (CWM)
For errors in the CWM, there were multiple significant effects related to group. There was a significant group main effect (F(2,291) = 16.43, p < 0.0001), as well as group × regimen (F(4,290) = 3.58, p < 0.01) and group × day (F(28,4059) = 1.79, p < 0.01) interactions. Other effects were sex (p < 0.0001; males committed more errors than females), regimen (p < 0.01; regimen P11−20 committed more errors than regimens P1−10 or P6−15), day (p < 0.0001; errors decreased across days), and sex × day (p < 0.0001). The group (inset) and group × regimen (main panel) effects on errors are shown in Fig. 3A. A posteriori group comparisons showed no differences among groups for the P1−10 regimen. For regimens P6−15 and P11−20, both MA groups committed more errors than Sal controls with the effect in the P6−15 regimen showing the largest dose-dependent effects (Fig. 4).
Fig. 3.

Performance in the Cincinnati water maze (CWM): Data are LS mean (± LS-SEM) averaged across days (15), trials (2 trials/day), and sexes. A, errors, B, latency to escape, C, start returns. Main panels: performance by treatment regimen. Insets: main effect of group averaged across regimen, day, trial, and sex. See tables for group sizes. *p < 0.05, **p < 0.01, ***p < 0.001 vs. Sal.
Fig. 4.
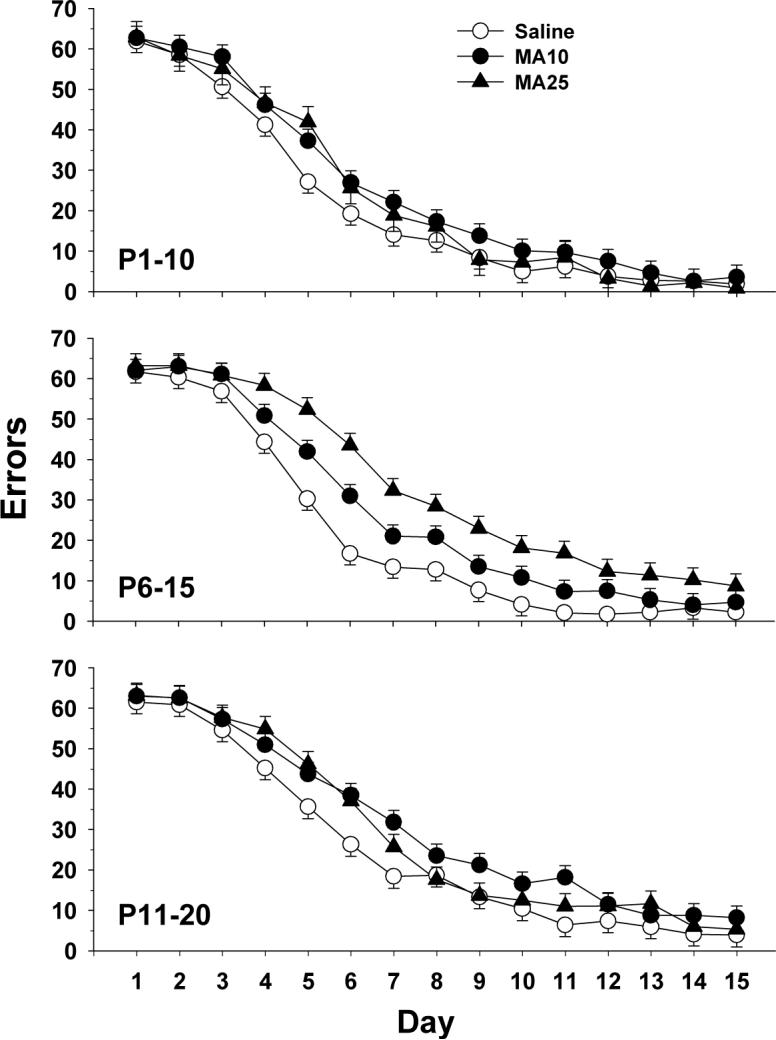
Cincinnati water maze (CWM) errors by day: Data are LS mean (± LS-SEM) for each day averaged across trials (2 trials/day) and sexes. Data are shown separately for each treatment regimen (P1−10, 6−15, and 11−20). See tables for group sizes.
For latency, the pattern was the same. There was a significant group main effect (F(2,292) = 14.6, p < 0.0001; Fig. 3B (inset)), as well as group × regimen (F(4,291) = 3.76, p < 0.01; Fig. 3B) and group × day (F(28,4059) = 1.83, p < 0.005) interactions. As can be seen, the pattern was similar to that for errors except that the MA25 group in the P11−20 regimen showed a non-significant trend toward longer latency.
For start returns, a similar pattern was seen but without a group × regimen interaction. Hence, there was a significant group main effect (F(2,273) = 15.75, p < 0.0001; Fig. 3C (inset)), and a group × day (F(28,4056) = 1.49, p < 0.05) interaction but the group × regimen interaction was not significant (F(4,272) = 1.5, p > 0.2). The pattern appeared similar to that for errors and latency, but the small absolute number of start returns was insufficient to obtain a significant group × regimen interaction, yet the overall pattern of MA treatment effects was the same as for the other measures (Fig. 3C).
3.6 Morris Water Maze (MWM)
Latency to find the platform, path length and cumulative distance from the platform on learning trials all showed similar effects during all three phases of testing (acquisition, reversal and shift); hence, only latency data are presented. For acquisition, there was a significant group main effect (F2,269) = 17.51, p < 0.0001) and a group × regimen × sex interaction (F(4,261) = 2.96, p < 0.02), however, group × regimen was not significant (F(4,268) = 1.96, p = 0.10). Sex × regimen (p < 0.002) and day (p < 0.0001) effects were also obtained. Overall, both MA-treated groups had significantly longer latencies than Sal controls (Fig. 5 top panels). Learning curves for all three phases are illustrated in Fig. 6. The group × regimen × sex interaction is shown in Fig. 7. MA-dependent treatment effects differed by sex such that for males, MA impaired performance for regimens P6−15 and P11−20, but for females, regimens P1−10 and P11−20 were impaired.
Fig. 5.
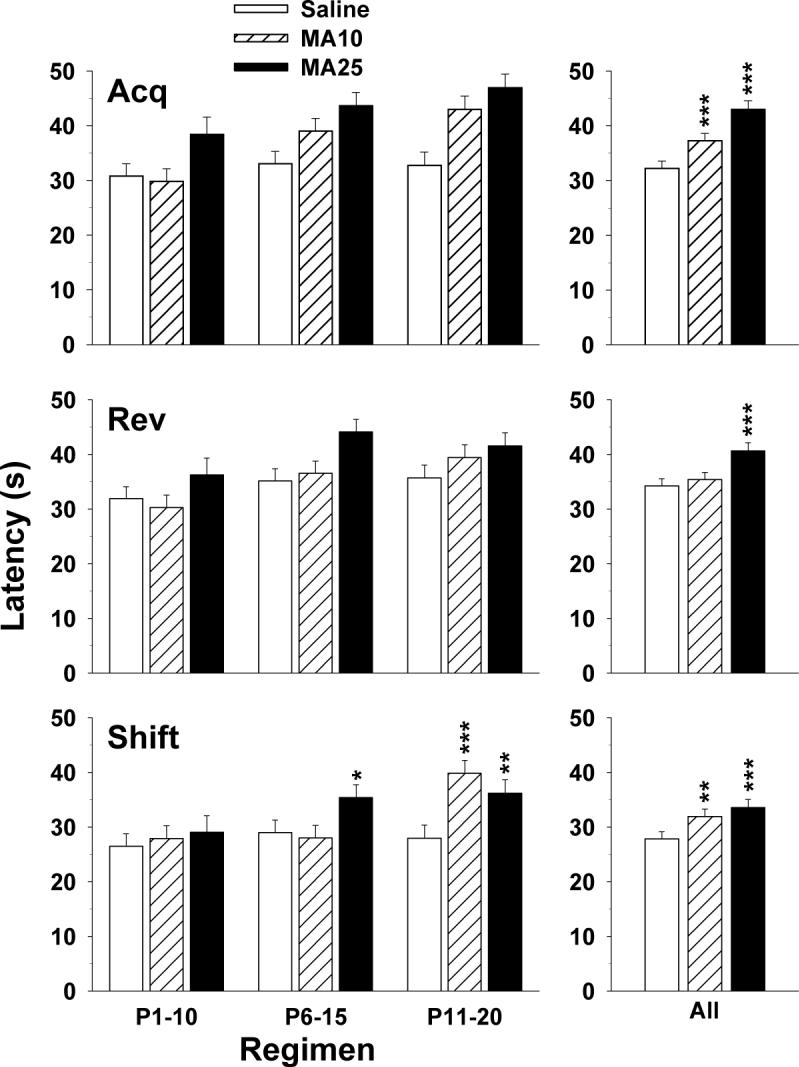
Morris water maze (MWM) platform trials by treatment regimen: Data are LS mean (± LS-SEM) latency (s) to find the platform averaged across trials (4 trials/day), day (5 days), and sex. Left panels: latency as a function of treatment regimen. Right panels: main effects on latency averaged across treatment regimen, day, trial, and sex. See tables for group sizes. *p < 0.05, **p < 0.01, ***p < 0.001 vs. Sal for the same regimen.
Fig. 6.

Morris water maze (MWM) latency (s) by day for platform trials: Data are LS mean (± LS-SEM) to find the platform (4 trials/day) averaged across sex for each regimen. Upper panel: acquisition (10 cm platform); middle panel: reversal (7 cm platform); lower panel: shift (5 cm platform). See tables for group sizes.
Fig. 7.

Morris water maze acquisition by sex: Data are LS mean (± LS-SEM) latency (s) to find the platform as a function of treatment regimen and sex to illustrate the group × regimen × sex interaction. Left: males; Right: females. See tables for group sizes. *p < 0.05, **p < 0.01, ***p < 0.001 vs. Sal for the same regimen.
For reversal, there were no interactions with regimen, but the group main effect was significant (F(2,268) = 6.94, p < 0.002). When sorted, only the MA25 group showed significantly longer latencies than Sal controls (Fig. 5, middle).
For shift, both the group main effect (F(2,264) = 6.56, p < 0.002) and the group × regimen interaction (F(4,262) = 3.88, p < 0.01) were significant. The group × regimen interaction was analyzed further. A posteriori group comparisons showed neither MA group differed significantly from the Sal group for the P1−10 regimen. For the P6−15 regimen, the MA25 group had longer latencies than the Sal group. For the P11−20 regimen, both MA-treated groups had significantly longer latencies than the Sal group (Fig. 5, bottom). The main effect of group showed that both the MA25 and MA10 groups had significantly longer latencies than Sal controls averaged across regimens.
Twenty-four h after the last day of platform trials for each phase of MWM testing, a single 30 s probe trial without the platform was given. For the acquisition probe trial (Fig. 8), significant group effects were obtained for number of crossovers (F(2,254) = 5.17, p < 0.01), average distance from the platform site (F(2,254) = 7.54, p < 0.001), initial heading error (F(2,254) = 3.28, p < 0.04), percent time in the target quadrant (F(2,254) = 5.51, p < 0.005), percent distance in the target quadrant (F(2,254) = 4.29, p < 0.02), and MSD (F(2,254) = 5.52, p < 0.005). There were no interactions with regimen or with sex. On most of these measures, both MA-treated groups differed from Sal, except for crossovers where only the MA25 group had significantly fewer crossovers than Sal controls.
Fig. 8.
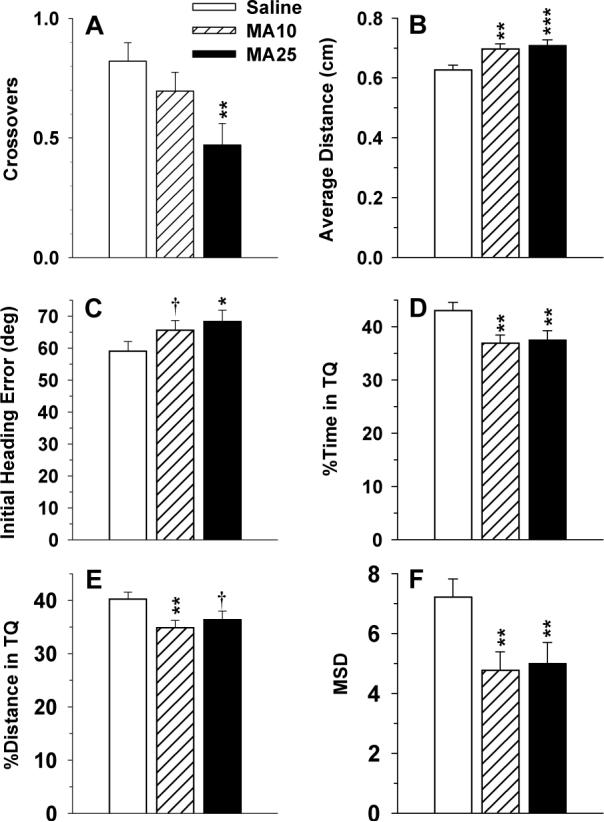
Morris water maze (MWM) acquisition probe trial: Data are LS mean (±LS-SEM). A, Crossovers; B, average distance to the platform site; C, initial heading error; D, percent time in the target quadrant; E, percent distance in the target quadrant; F, MSD. See tables for group sizes. †p < 0.1, *p < 0.05, **p < 0.01, ***p < 0.001 vs. Sal.
For the reversal probe trial, group × sex (F(2,253) = 3.16, p < 0.03) and group × regimen × sex (F(4,253) = 3.20, p < 0.02) interactions were significant for crossovers. No group effects or group-related interactions were found on average distance or percent time or distance in the target quadrant, or on MSD. For initial heading error there was a significant group × sex interaction (F(2,253) = 4.08, p < 0.02). For the crossover 3-way interaction, only one significant effect was found by pairwise groups comparisons and that was for females in the P6−15 regimen (F(2,253) = 7.92, p < 0.0005). This effect was that both MA groups differed significantly from Sal controls (p < 0.01); female P6−15 LS means (± LS SEM) were: Sal = 0.9 ± 0.2; MA10 = 0.1 ± 0.2; MA25 = 0.3 ± 0.2. For initial heading error, slice ANOVAs showed a significant effect for males (p < 0.02) but not for females. Both the MA10 (p < 0.003) and MA25 (p < 0.05) group males were more off-course than Sal males; male LS means (± LS SEM) were: Sal = 71.8 ± 3.7, MA10 = 84.5 ± 3.8; MA25 = 80.1 ± 4.3.
For the shift probe trial, no significant effects were obtained.
In order to determine if any of the differences seen on platform trials were attributable to differences in swimming speed, analyses of swim speed were conducted. No significant group or group-related effects were found during the platform trials for any phase. On probe trials, analyses of swimming speed showed no group effects on the acquisition probe trial, but speed differences did appear on reversal and shift probe trials. For reversal there was a group main effect (p < 0.03) which when analyzed further revealed that the MA25 group swam faster than Sal controls. For the shift probe trial, there was a significant group × sex interaction (p < 0.05) for swimming speed which when further analyzed was only in the females (p < 0.02). Among females, the MA25 group swam faster than Sal females. Therefore, both of these probe trial speed effects showed no swimming impairment, but rather increases in swim speed in the MA25 group.
Following the three phases of hidden platform testing in the MWM the animals were given two days of cued (visible) platform trials (4 trials/day) with the start and platform locations randomized on each trial and with curtains closed around the maze to obscure extramaze cues. These trials were designed to ensure that all groups could locate the platform without relying upon spatial cues. No significant group main effects or group-related interactions were obtained during cued testing (not shown).
4. Discussion
The present experiment tested the hypothesis that increased and prolonged HPA axis reactivity during the SHRP would be temporally aligned with later cognitive deficits induced by developmental MA treatment. Animals were treated with MA during one of three windows that began prior to or within the SHRP. It was expected that the largest effects would be obtained if the entire treatment period coincided with the SHRP (i.e., P6−15), while exposures beginning outside the SHRP would not be affected (i.e., P1−10). A corollary was that non-cognitive behaviors (locomotor activity and acoustic startle reactivity) would not be SHRP-sensitive.
The hypothesis was confirmed for some aspects of cognitive behavior, but not for others. The hypothesis correctly predicted that MA would significantly impair CWM path integration learning for the P6−15 and P11−20 exposure regimens, in that both errors and latency to escape followed the predicted pattern with no MA-related effects found for the P1−10 regimen. However, for start returns, a main effect of MA treatment was found with no exposure regimen-dependent interactions. The latter did not contradict the prediction, but neither did it confirm it. In terms of the additional prediction that the regimen corresponding most closely to the SHRP, regimen P6−15, would be most affected, this was supported by the CWM findings, in that both errors and escape latencies showed larger deficits in the MA groups treated during the P6−15 regimen than the P11−20 regimen.
Findings for MWM spatial navigation were mixed, with some findings supporting the hypothesis and some not. The hypothesis was supported for MWM shift trials inasmuch as the effects of MA were seen only in the P6−15 and P11−20 regimens, but not in the P1−10 regimen. On acquisition, the prediction was partially upheld but was modified by an interaction with sex. When further analyzed, the group × regimen × sex interaction supported the hypothesis for males, showing MA-related increased latencies in the P6−15 and P11−20 regimens but not for the P1−10 regimen, however, a different pattern was seen for females. For females, MA produced longer latencies in the P1−10 and P11−20 regimens but not in the P6−15 regimen. Accordingly, the P11−20 female effect supported the hypothesis but the P1−10 female effect did not. The sex and regimen-dependent effects of MA, especially for the P1−10 females, are not easily reconciled since on all other measures of spatial and path integration learning there were no P1−10 MA-related effects. For MWM reversal, there were clear MA-related effects on performance but they were not regimen-dependent. The learning (platform) trials in the MWM showed some regimen and regimen × sex-dependent support for increased vulnerability to MA during exposure intervals starting within the SHRP, but some effects showed only main effects of MA treatment implying contributions from all exposure regimens. This was clearly seen on probe trials. While MA caused impairments on the acquisition probe trial on every measure analyzed, none of these effects were regimen-dependent. Hence, the probe data neither contradicted nor supported the hypothesis. Taken together, the two cognitive tests provide evidence that the P6−15 and P11−20 exposure regimens are more sensitive to MA than the P1−10 exposure regimen and this is more the case for path integration than for spatial learning. However, the data show only limited evidence that the P6−15 regimen is appreciably more sensitive to MA than the P11−20 exposure regimen. These data, therefore, provide some support for the concept that the SHRP is related to the cognitive deficits induced by MA, especially for path integration learning. The experiment did not directly test whether the mechanisms that underlie the SHRP mediate or contribute to the cognitive deficits induced by MA because even the least vulnerable exposure regimen, P1−10, showed some MA-related effects. Although the P1−10 treatment regimen began outside the SHRP, the exposure interval ended within the SHRP. We previously showed that there is a MA-related SHRP from approximately P6−14 as indexed by the acute effects of MA on short-term corticosterone release in which MA (10 mg/kg) has a U-shaped pattern of effects on corticosterone from P1−19 (Williams et al., 2006). These data, combined with the current behavioral data, show that the effects of MA on the HPA axis and later cognitive outcome are temporally aligned but this does not provide a causative link. We are currently testing how the cognitive outcome is affected by interfering with the effects of MA on corticosterone release.
The corollary prediction that locomotor activity and acoustic startle would not be exposure regimen-dependent was confirmed. No regimen-specific effects of MA were obtained for locomotor activity or acoustic startle reactivity. In addition, no effect of MA on PPI was obtained that exceeded a linear relationship to the effect of the drug on basic acoustic startle amplitude, i.e., the effect of MA at augmenting the startle response was symmetrical on prepulse trials compared to non-prepulse trials, showing that the effect of MA is on basic startle reactivity and not sensorimotor gating. Moreover, the data show that MA treatment at any of the 10-day intervals between P1−20 causes reliable acoustic startle facilitation which confirms previous findings for the P1−10 and P11−20 exposure regimens (Vorhees et al., 1994a;Vorhees et al., 1996). In addition, the findings also showed a non-exposure-dependent effect of MA treatment at lowering spontaneous locomotor activity. This reliable, albeit relatively small, effect was seen on the exploratory and habituation phases of locomotion in a novel environment during a 1-h test, but no reliable treatment effects were seen once baseline activity was reached.
Neither the startle nor locomotor testing prior to cognitive testing are likely to have affected cognitive performance given that we have previously shown the same P11−20 MA-induced deficits on MWM spatial learning and reference memory when startle and locomotor testing did not precede maze testing (Vorhees et al., 2000;Vorhees et al., 2007;Vorhees et al., 2008).
MA25 caused a marked increase in mortality, especially in the P1−10 regimen, raising the issue of survival effects. However, on most outcomes the MA25 and MA10 groups performed similarly yet the MA10 group showed only a minor increase in mortality in the P1−10 regimen and no effect in the P6−15 or P11−20 regimens, demonstrating that survival does not confer protection against the neurobehavioral effects of MA. A related conclusion may be reached with respect to body weight reductions. Setting aside the MA25 group for the moment because of this group's high mortality, the MA10 group in all regimens showed similar body weight changes yet many of the cognitive changes were regimen-specific, especially those seen for the CWM making it unlikely that body weight differences contribute to cognitive outcome. In addition, only the MA10 animals in the P1−10 regimen showed lasting male and female weight reductions, whereas cognitive deficits in the CWM and MWM were primarily observed in the P6−15 and P11−20 regimens, again dissociating the behavioral effects from drug-induced body weight changes.
Across regimens, MA led to reduction in locomotor activity but faster swimming on the reversal and shift phases of the MWM. Swimming behavior has previously been shown to be immune from changes in land-based locomotor activity (Cravens, 1974) except at the extremes (Kinney and Vorhees, 1979). An extensive literature showing that rats with hippocampal lesions (known to induce locomotor hyperactivity) and acute stimulant treatments that increase locomotor activity simultaneously induce impaired learning in the MWM (Brandeis et al., 1989). The present findings contribute further evidence to this dissociation.
In sum, the data showed that MA-induced CWM path integration learning deficits and MWM shift (small platform) spatial learning deficits align with treatment regimens that begin during the SHRP. In addition, there were effects that spanned all treatment regimens as significant group main effects. These included impaired path integration and spatial learning (all phases), impaired reference memory, augmented acoustic startle reactivity, and reduced spontaneous locomotor activity. Hence, MA has potent adverse developmental effects across the entire span of development from P1−20, but with the degree of effect varying depending on the stage of exposure.
Acknowledgment
This research was supported by the following grants from the U.S. National Institutes of Health: DA006733 (CVV) and DA014269 (MTW). We thank Mary S. Moran for assistance with data analyses.
Footnotes
Publisher's Disclaimer: This is a PDF file of an unedited manuscript that has been accepted for publication. As a service to our customers we are providing this early version of the manuscript. The manuscript will undergo copyediting, typesetting, and review of the resulting proof before it is published in its final citable form. Please note that during the production process errors may be discovered which could affect the content, and all legal disclaimers that apply to the journal pertain.
References
- Bayer SA, Altman J, Russo RJ, Zhang X. Timetables of neurogenesis in the human brain based on experimentally determined patterns in the rat. Neurotoxicology. 1993;14:83–144. [PubMed] [Google Scholar]
- Brandeis R, Brandys Y, Yehuda S. The use of the Morris water maze in the study of memory and learning. Int J Neurosci. 1989;48:29–69. doi: 10.3109/00207458909002151. [DOI] [PubMed] [Google Scholar]
- Chang L, Smith LM, LoPresti C, Yonekura ML, Kuo J, Walot I, Ernst T. Smaller subcortical volumes and cognitive deficits in children with prenatal methamphetamine exposure. Psychiatr Res : Neuroimaging. 2004;132:95–106. doi: 10.1016/j.pscychresns.2004.06.004. [DOI] [PubMed] [Google Scholar]
- Chomchai C, Na MN, Watanarungsan P, Yossuck P, Chomchai S. Methamphetamine abuse during pregnancy and its health impact on neonates born at Siriraj Hospital, Bangkok, Thailand. Southeast Asian J Trop Med Public Health. 2004;35:228–231.. [PubMed] [Google Scholar]
- Clancy B, Finlay BL, Darlington RB, Anand KJ. Extrapolating brain development from experimental species to humans. Neurotoxicology. 2007a;28:931–937. doi: 10.1016/j.neuro.2007.01.014. [DOI] [PMC free article] [PubMed] [Google Scholar]
- Clancy B, Kersh B, Hyde J, Darlington RB, Anand KJ, Finlay BL. Web-based method for translating neurodevelopment from laboratory species to humans. Neuroinformatics. 2007b;5:79–94. doi: 10.1385/ni:5:1:79. [DOI] [PubMed] [Google Scholar]
- Cravens RW. Effects of maternal undernutrition on offspring behavior: Incentive value of a food reward and ability to escape from water. Dev Psychobiol. 1974;7:61–69. doi: 10.1002/dev.420070110. [DOI] [PubMed] [Google Scholar]
- Dixon SD. Effects of transplacental exposure to cocaine and methamphetamine on the neonate. Western J Med. 1989;150:436–442. [PMC free article] [PubMed] [Google Scholar]
- Dixon SD, Bejar R. Echoencephalographic findings in neonates associated with maternal cocaine and methamphetamine use: Incidence and clinical correlates. J Pediatr. 1989;115:770–778. doi: 10.1016/s0022-3476(89)80661-4. [DOI] [PubMed] [Google Scholar]
- Herlenius E, Lagercrantz H. Development of neurotransmitter systems during critical periods. Exp Neurol. 2004;190:S8–S21. doi: 10.1016/j.expneurol.2004.03.027. [DOI] [PubMed] [Google Scholar]
- Johnston LD, O'Malley PM, Bachman JG, Schulenberg JE. Monitoring the Future national survey results on drug use, 1975−2007. Volume I: Secondary school students. National Institude on Drug Abuse; Bethesda, MD: 2008a. NIH Publication Number 08−6418A. [Google Scholar]
- Johnston LD, O'Malley PM, Bachman JG, Schulenberg JE. Monitoring the Future national survey results on drug use, 1975−2007. Volume II: College students and adults ages 19−45. National Institute on Drug Abuse; Bethesda, MD: 2008b. NIH Publication Number 08−6418B. [Google Scholar]
- Kinney L, Vorhees CV. A comparison of methylphenidate induced active avoidance and water maze performance facilitation. Pharmacol Biochem Behav. 1979;10:437–439. doi: 10.1016/0091-3057(79)90210-7. [DOI] [PubMed] [Google Scholar]
- Little BB, Snell LM, Gilstrap LC. Methamphetamine abuse during pregnancy: Outcome and fetal effects. Obstet Gynecol. 1988;72:541–544. [PubMed] [Google Scholar]
- Meaney MJ, Aitken DH, van Berkel C, Bhatnager S, Sapolsky RM. Effect of neonatal handling on age-related impairments associated with the hippocampus. Science. 1988;239:766–768. doi: 10.1126/science.3340858. [DOI] [PubMed] [Google Scholar]
- Mordenti J, Cappell W. The use of interspecies scaling in toxicokinetics. In: Yacobi A, Kelly J, Batra V, editors. Toxicokinetics in New Drug Development. Pergamon Press; New York: 1989. pp. 42–96. [Google Scholar]
- Oro AS, Dixon SD. Perinatal cocaine and methamphetamine exposure: Maternal and neonatal correlates. J Pediatr. 1987;111:571–578. doi: 10.1016/s0022-3476(87)80125-7. [DOI] [PubMed] [Google Scholar]
- Rice D, Barone S., Jr. Critical periods of vulnerability for the developing nervous system: Evidence from humans and animal models. Environ Hlth Perspect. 2000;108:511–533. doi: 10.1289/ehp.00108s3511. [DOI] [PMC free article] [PubMed] [Google Scholar]
- Sapolsky RM. Stress, glucoconrticoids, and damage to the nervous system: The current state of confusion. Stress. 1996;1:1–19. doi: 10.3109/10253899609001092. [DOI] [PubMed] [Google Scholar]
- Sapolsky RM, Meaney MJ. Maturation of the adrenocortical stress response: Neuroendocrine control mechanisms and the stress hyporesponsive period. Brain Research Reviews. 1986;11:65–76. doi: 10.1016/s0006-8993(86)80190-1. [DOI] [PubMed] [Google Scholar]
- Schaefer TL, Ehrman LA, Gudelsky GA, Vorhees CV, Williams MT. Comparison of monoamine and corticosterone levels 24 h following (+)methamphetamine, (+/−)3,4-methylenedioxymethamphetamine, cocaine, (+)fenfluramine or (+/−)methylphenidate administration in the neonatal rat. J Neurochem. 2006;98:1369–1378. doi: 10.1111/j.1471-4159.2006.04034.x. [DOI] [PMC free article] [PubMed] [Google Scholar]
- Schaefer TL, Skelton MR, Herring NR, Gudelsky GA, Vorhees CV, Williams MT. Short- and long-term effects of (+)-methamphetamine and (+/−)-3,4-methylenedioxymethamphetamine on monoamine and corticosterone levels in the neonatal rat following multiple days of treatment. J Neurochem. 2008;104:1674–1685. doi: 10.1111/j.1471-4159.2007.05112.x. [DOI] [PMC free article] [PubMed] [Google Scholar]
- Smith LM, Chang L, Yonekura ML, Grob C, Osborn D, Ernst T. Brain proton magnetic resonance spectroscopy in children exposed to methamphetamine in utero. Neurology. 2001;57:255–260. doi: 10.1212/wnl.57.2.255. [DOI] [PubMed] [Google Scholar]
- Smith LM, LaGasse LL, Derauf C, Grant P, Shah R, Arria A, Huestis M, Haning W, Strauss A, Della GS, Liu J, Lester BM. The infant development, environment, and lifestyle study: effects of prenatal methamphetamine exposure, polydrug exposure, and poverty on intrauterine growth. Pediatrics. 2006;118:1149–1156. doi: 10.1542/peds.2005-2564. [DOI] [PubMed] [Google Scholar]
- Struthers JM, Hansen RL. Visual recognition memory in drug-exposed infants. Dev Behav Pediatr. 1992;13:108–111. doi: 10.1097/00004703-199204000-00005. [DOI] [PubMed] [Google Scholar]
- Vazquez DM. Stress and the developing limbic-hypothalamic-pituitary-adrenal axis. Psychoneuroendocrinology. 1998;23:663–700. doi: 10.1016/s0306-4530(98)00029-8. [DOI] [PubMed] [Google Scholar]
- Vorhees CV. Maze learning in rats: A comparison of performance in two water mazes in progeny prenatally exposed to different doses of phenytoin. Neurotoxicol Teratol. 1987;9:235–241. doi: 10.1016/0892-0362(87)90008-0. [DOI] [PubMed] [Google Scholar]
- Vorhees CV, Ahrens KG, Acuff-Smith KD, Schilling MA, Fisher JE. Methamphetamine exposure during early postnatal development in rats: I. Acoustic startle augmentation and spatial learning deficits. Psychopharmacology. 1994a;114:392–401. doi: 10.1007/BF02249328. [DOI] [PubMed] [Google Scholar]
- Vorhees CV, Ahrens KG, Acuff-Smith KD, Schilling MA, Fisher JE. Methamphetamine exposure during early postnatal development in rats: II. Hypoactivity and altered responses to pharmacological challenge. Psychopharmacology. 1994b;114:402–408. doi: 10.1007/BF02249329. [DOI] [PubMed] [Google Scholar]
- Vorhees CV, Herring NR, Schaefer TL, Grace CE, Skelton MR, Johnson HL, Williams MT. Effects of neonatal (+)-methamphetamine on path integration and spatial learning in rats: effects of dose and rearing conditions. Int J Dev Neurosci. 2008;26:599–610. doi: 10.1016/j.ijdevneu.2008.04.002. [DOI] [PMC free article] [PubMed] [Google Scholar]
- Vorhees CV, Inman-Wood SL, Morford LL, Broening HW, Fukumura M, Moran MS. Adult learning deficits after neonatal exposure to D-methamphetamine: Selective effects on spatial navigation and memory. J Neurosci. 2000;20:4732–4739. doi: 10.1523/JNEUROSCI.20-12-04732.2000. [DOI] [PMC free article] [PubMed] [Google Scholar]
- Vorhees CV, Morford LL, Inman SL, Reed TM, Schilling MA, Cappon GD, Moran MS, Nebert DW. Genetic differences in spatial learning between Dark Agouti and Sprague-Dawley strains: Possible correlation with CYP2D2 polymorphism in rats treated neonatally with methamphetamine. Pharmacogenetics. 1999;9:171–181. [PubMed] [Google Scholar]
- Vorhees CV, Reed TM, Schilling MA, Fisher JE, Moran MS, Cappon GD, Nebert DW. CYP2D1 polymorphism in methamphetamine-treated rats: Genetic differences in neonatal mortality and a comparison of spatial learning and acoustic startle. Neurotoxicol Teratol. 1998;20:265–273. doi: 10.1016/s0892-0362(97)00129-3. [DOI] [PubMed] [Google Scholar]
- Vorhees CV, Reed TM, Schilling MS, Acuff-Smith KD, Fisher JE, Moran MS. Neonatal methamphetamine-induced long-term startle facilitation in rats as a function of prepulse stimulus intensity. Neurotoxicol Teratol. 1996;18:135–139. doi: 10.1016/0892-0362(95)02051-9. [DOI] [PubMed] [Google Scholar]
- Vorhees CV, Skelton MR, Williams MT. Age-dependent effects of neonatal methamphetamine exposure on spatial learning. Behav Pharmacol. 2007;18:549–562. doi: 10.1097/FBP.0b013e3282ee2abe. [DOI] [PMC free article] [PubMed] [Google Scholar]
- Vorhees CV, Weisenburger WP, Acuff-Smith KD, Minck DR. An analysis of factors influencing complex water maze learning in rats: Effects of task complexity, path order and escape assistance on performance following prenatal exposure to phenytoin. Neurotoxicol Teratol. 1991;13:213–222. doi: 10.1016/0892-0362(91)90013-m. [DOI] [PubMed] [Google Scholar]
- Vorhees CV, Williams MT. Morris water maze: procedures for assessing spatial and related forms of learning and memory. Nat Protocols. 2006;1:848–858. doi: 10.1038/nprot.2006.116. [DOI] [PMC free article] [PubMed] [Google Scholar]
- Watson RE, Desesso JM, Hurtt ME, Cappon GD. Postnatal growth and morphological development of the brain: a species comparison. Birth Defects Res B Dev Reprod Toxicol. 2006;77:471–484. doi: 10.1002/bdrb.20090. [DOI] [PubMed] [Google Scholar]
- West JR, Pierce DR. Perinatal alcohol exposure and neuronal damage. In: West JR, editor. Alcohol and Brain Development. Oxford University Press; New York: 1987. pp. 120–157. [Google Scholar]
- Williams MT, Moran MS, Vorhees CV. Behavioral and growth effects induced by low dose methamphetamine administration during the neonatal period in rats. Int J Dev Neurosci. 2004;22:273–283. doi: 10.1016/j.ijdevneu.2004.04.003. [DOI] [PMC free article] [PubMed] [Google Scholar]
- Williams MT, Morford LL, Wood SL, Wallace TL, Fukumura M, Broening HW, Vorhees CV. Developmental d-methamphetamine treatment selectively induces spatial navigation impairments in reference memory in the Morris water maze while sparing working memory. Synapse. 2003;48:138–148. doi: 10.1002/syn.10159. [DOI] [PubMed] [Google Scholar]
- Williams MT, Schaefer TL, Furay AR, Ehrman LA, Vorhees CV. Ontogeny of the adrenal response to (+)-methamphetamine in neonatal rats: The effect of prior drug exposure. Stress. 2006;9:153–163. doi: 10.1080/10253890600902842. [DOI] [PMC free article] [PubMed] [Google Scholar]
- Williams MT, Vorhees CV, Boon F, Saber AJ, Cain DP. Methamphetamine exposure from postnatal days 11 to 20 causes impairments in both behavioral strategies and spatial learning in adult rats. Brain Res. 2002;958:312–321. doi: 10.1016/s0006-8993(02)03620-x. [DOI] [PubMed] [Google Scholar]