

Abstract
The process of cell seeding on biocompatible scaffolds has a major impact on the morphological evolution of an engineered tissue because it involves all the key factors of tissue formation: cells, matrix, and their mutual interactions. In order to characterize the efficiency of cell seeding techniques, mainly static parameters are used such as cell density, cell distribution, and cell viability. Here, we present an experimental model that incorporates an optical density meter providing real-time information on the cell seeding velocity, a relevant dynamic parameter of cell–matrix interaction. Our setup may be adapted to fit various cell seeding protocols. A modified fluorimetric cuvette is used as bioreactor culture flask. The optical density of the magnetically stirred cell suspension is recorded by a digital optoelectronic device. We performed calibration experiments in order to prove that, in our experimental conditions, optical density depends linearly on the number of cells in the unit volume of suspension. Control studies showed that, during the time course of a typical experiment (up to 10 h), the cells (murine 3T3 fibroblasts) neither aggregated nor adhered significantly to the walls of the cuvette. Hence, our setup yields the number of cells attached to the scaffold as a function of time. In order to analyze the experimental seeding curves, we built a kinetic model based on Langmuir’s adsorption theory, which was extended to include a preliminary step of integrin function recovery. We illustrate the proposed approach by two sets of experiments that involved trypsin–EDTA or only EDTA treatment (no trypsin) used to detach the cells from the culture flasks. The data indicate that in both cases cell–matrix adhesion has a sequential, two-step dynamics, but kinetic parameters and attachment site availability depend on the experimental protocol.
Keywords: Cell seeding, Adsorption, Collagen scaffold, Fibroblasts, Tissue engineering, Optical density
Introduction
Tissue engineering (TE) is an important domain of biomedical research, since it promises to solve the difficult problem of replacement organ shortage by fabricating functional tissue constructs in the laboratory [1]. Organ modules produced in vitro may also be used as promoters of in vivo tissue reconstruction or as targets for testing new drugs [2]. Therefore, TE is closely related to regenerative medicine [3] and combines tools and approaches from many different disciplines such as developmental biology, chemistry, physics, and engineering in order to assure an appropriate microenvironment for the cells [4]. A well-established approach in TE is to extract stem cells from a patient with major organ function deficiency, to grow them in the laboratory, to seed a scaffold with the cultured cells, to grow the resulting artificial tissue construct in a bioreactor, and finally to implant the construct into the host organism [1, 3]. Several products, some already on the market and others under development, prove the feasibility of TE; nevertheless, the success of such a therapy hinges on the translation of research from the laboratory to the clinic, a vital step that calls for animal studies and for more fundamental approaches [5]. The upscalability of the production and the shelf life of the products also require careful consideration [6].
Solid 3D scaffolds are used in bone and/or cartilage structure engineering. For orthopedic purposes, the ultimate 3D scaffold will be the one that fully accommodates the ostegenic/chondrogenic cells in order to successfully biointegrate the construct at a time scale comparable with the cell physiological processes (hours/days). Thus, the mechanical properties of the injured bone/cartilage will be recovered fast enough, so the patient will avoid the usually long period of rehabilitation after bone/cartilage trauma, with all the costs and discomfort involved. Cell seeding of such solid 3D scaffolds plays a crucial role since it involves all the key factors of tissue formation: cells (type, metabolic activity, division rate, and viability), scaffold (chemical structure, porosity, and architecture), and their interactions (cell–cell and cell–substrate adhesion). The importance of optimal seeding conditions has been clearly demonstrated in the context of cartilage tissue engineering. To characterize cell seeding, static parameters such as the final cell density, cell distribution, or cell viability were proposed; these were used for assessing different seeding techniques: static seeding, circular-flow seeding, or direct perfusion seeding. The requirements for high yield, high rate and spatially uniform cellularity were met by using well-mixed spinner flasks [7] and by direct perfusion seeding [8], the latter being more efficient as concerns homogeneity and cell viability.
Developmental biology suggests that high cellularities in TE constructs favor cooperative effects akin to mesenchymal cell condensation, which is an important regulatory phenomenon in embryonic morphogenesis [9]. Metabolic oscillations may become synchronized in a cell population if the separation between cells is comparable to the cell size. Non-linear kinetic models have been built in order to identify the necessary conditions in the context of cells adsorbed to a solid substrate, of interest in TE [10]. Indeed, several in vitro experiments show that cell seeding should result in high cell concentrations. In cartilage, TE uniform seeding at high cell concentrations proved essential for high rates of glycosaminoglycan production [7]. In cardiac TE, high initial cell densities favored cardiac cell differentiation as well as the formation of cell–cell junctions [11].
The optimization of cell seeding is considered essential for the successful in vitro cultivation of tissue fragments [7]. In order to address this problem, here we present an experimental setup that enables a non-invasive scrutiny of the seeding process. Our measurements show that seeding dynamics is strongly influenced by parameters like initial cell concentration and scaffold volume. Moreover, we propose a kinetic model of cell seeding of solid, porous scaffolds. A distinctive feature of our non-linear kinetic model is its ability to account for high scaffold cellularities. Our approach is based on an extension of Langmuir’s theory of adsorption [12] and is motivated by the focus on the high cell density regime. The two-compartment model of Ref. [7], based on a first-order kinetics of cell attachment, offers an accurate description of the dynamics of cell seeding only if the number of cell attachment sites offered by the scaffold is well above the number of cells from the suspension used for seeding. As soon as the average number of available sites per cell approaches or drops below unity, site occupancy should be taken into account in the kinetic equations.
The remainder of this paper is organized as follows: Section 2, Materials and Methods, describes the experimental setup that allows for optical monitoring of cell seeding and the analysis of the data used to calibrate the optical density meter. This section also presents our kinetic model of cell attachment to solid scaffolds. Section 3, Results and Discussion, first shows raw data on the evolution of a cell suspension’s percent transmission in the presence and in the absence of a scaffold (large scaffold and low cell concentration versus small scaffold and high cell concentration). Then, the two-compartment model of Ref. [7] is compared with our kinetic model in relationship with optical density measurements on seeding scaffolds of various sizes at different cell concentrations. Finally, cell seeding curves are shown and the results are fitted by the Langmuir model for two distinct sets of experiments regarding cells treated prior to seeding either with trypsin–EDTA (that digests the adhesion proteins, i.e., integrins, at the cell surface) or just with EDTA (that enables cells to detach without integrin damage) [13]. In these experiments, we wanted to see if the model is able to detect significant changes in seeding dynamics, due to the initial absence or presence of the molecular adhesion apparatus at the cell surface.
Materials and Methods
Cell Line
Immortalized murine skin fibroblasts (NIH-3T3) [14] were cultured in DMEM supplemented with 2 mM glutamine (Gibco, UK), 10% fetal bovine serum (Sigma-Aldrich, Germany), and 1% antibiotic solution (penicillin and streptomycin—Sigma-Aldrich, Germany) at 37°C in a 5% CO2 humidified incubator. For experiments, cells reaching 80% confluence were detached from 25 cm2 culture flasks either with 1 mM trypsin–EDTA solution or with 2 mM EDTA-only solution [13], then washed and centrifuged twice at 190 ×g, and finally resuspended in supplemented CO2-independent medium (CIM) (Gibco).
Scaffolds
Type I collagen solid scaffolds (Poneti Ltd., Bucharest, Romania) were supplied as white sponges of 10 × 10 × 5 mm, packed in double polyethylene bags, sterilized by a 25-Gy dose of γ-rays. For experiments, small pieces of scaffold of about 2 × 2 × 5 mm, large pieces of about 5 × 5 × 5 mm, and intermediate-sized pieces of about 3 × 3 × 5 mm were sliced and weighed in dry state. Before seeding, the scaffold pieces were soaked in supplemented CIM for 15–20 min. According to the provider, average scaffold porosity is about 75% and pore sizes range between 100 and 400 μm. Figure 1 shows an image of the scaffold used in our experiments, obtained with a Hitachi S4700 cold-cathode field-emission scanning electron microscope operated at 5 kV accelerating voltage.
Fig. 1.

Scanning electron microscopy image of a collagen type I scaffold used for the seeding experiments
Experimental Setup
We assembled an optical density meter (Fig. 2), which incorporates a light source, a monochromatic filter (450 nm), the sterile sample chamber, the photodetector, and the data acquisition system connected to a computer. The sample chamber includes the sterile cell seeding bioreactor (Fig. 3), a magnetic stirrer, and the thermostated sample holder. Biomimetic conditions are maintained in order to keep cells alive during the seeding of the solid scaffold, a process that is known to last for several hours [7, 15, 16]. The sample holder is a disposable 10 × 10 × 40 mm cuvette used in fluorimetric measurements, made of optical polystyrene. In all seeding experiments, the stirring rate was adjusted to about 300 rotations per minute (rpm). Experiment durations ranged from 3 to 10 h, depending on the time needed for the system to reach a stationary state.
Fig. 2.

The experimental setup used for cell seeding monitored by turbidimetry. The system includes three main units: a light source (A), a sterile sample chamber (B), and a photodetector with incorporated operational amplifier (C)
Fig. 3.

The bioreactor is a normal fluorimetric plastic cuvette with the following main features: 1 transparent wall; 2 cell suspension; 3 stainless steel wire; 4 porous, solid scaffold; 5 light beam; 6 induced circular flow; 7 magnetic stirrer
The intensity of the light beam emerging from the sample holder was recorded by an OPT101 optoelectronic device (Texas Instruments, USA) connected to a PC-Scope PCS500 electronic interface (Velleman Instruments, Belgium) used in transient recorder regime. The recorder was connected to a personal computer via the parallel interface. The intensity calibration of the recorder was performed using a blank sample: culture medium without cells. During seeding experiments, the sampling rate of the transient recorder was set to 0.5 Hz. Thus, the time resolution of our experimental setup is of the order of seconds. Each data point shown as markers on Figs. 5, 6, and 7 was obtained by averaging 300 successive values recorded during 10 min and adjusting with the corresponding instrumental gain value.
Fig. 5.

The transmission of the seeding cell suspension versus time obtained for a small scaffold in a suspension of high cell concentration (squares, sample A) and for a larger scaffold in a suspension of low cell concentration (triangles, sample B). The control curve is obtained in the absence of a scaffold (diamonds)
Fig. 6.

Experimental data showing the time course of the relative optical density (symbols) fitted by the two-compartment kinetic model of Ref. [7] (dashed line) and by the kinetic model proposed here (solid line). Experiments involved NIH-3T3 cells seeded on collagen scaffolds that offered more than one attachment sites per cell (a), or were able to accommodate about 87% (b) or 73% (c) of the total number of cells from the suspension. The percentages of cells hosted by the scaffolds were inferred indirectly from the asymptotic values of the fraction of successfully seeded cells (Eq. 11). Model parameters are listed in Table 1
Fig. 7.

The time dependence of the fraction of cells that attached to the scaffold. Experimental data sets are represented by distinct symbols, while the solutions of Eq. 7 obtained by non-linear least squares fit to the data are plotted with lines. All experiments involved 3-cm3 cell suspensions of similar cell concentrations and similar collagen scaffolds of about 5 mg dry weight and rectangular shapes of roughly 3 × 3 × 5 mm. The cell concentrations and model parameters are listed in Table 2. Data obtained using trypsin–EDTA-treated cells (a) correspond to set 1 (circles, solid line), set 2 (squares, dashed line), and set 3 (triangles, dashed–dotted line), whereas data for EDTA-treated cells (b) correspond to set 4 (triangles, dashed–dotted line), set 5 (squares, dashed line), and set 6 (circles, solid line)
Experimental Procedures
The same cell line and similar procedures were used for all experiments, which were conducted as follows:
Calibration experiments From a 5-ml suspension of trypsin-detached cells obtained from a single culture flask, five suspensions of different cell concentrations, ranging from 0.5 × 10⁶ cells/ml to 3 × 10⁶ cells/ml, were made and used for cell counting and optical density measurement. The calibration curve (Fig. 4) was obtained using data points obtained from three series of such samples, with the aim of correlating the optical density of the cell suspension with the number of cells in the unit volume.
Fig. 4.

Linear regression analysis of the relationship between cell concentration and optical density of the cell suspension. Data from three different experiments performed with the same cell line (NIH-3T3) are plotted with different symbols of markers, and the result of a linear least squares fit is the thick line with intercept a = −0.008 and slope b = 0.159
The cell concentration of each sample was evaluated with a Beckman Coulter Counter Z2 and its absorbance was measured with a conventional optical density meter. A linear least squares fit gave intercept a = −8 × 10 − 3 and slope b = 1.59 × 10 − 1.
Aside from establishing a linear relationship between the cell concentration and the optical density of the suspension, we may also draw certain inferences about the slope and the intercept of the regression line [17]. Based on the Student t distribution, we established a 95% confidence interval for the intercept: −1.75 × 10 − 2 < a < 1.6 × 10 − 3. Furthermore, the null hypothesis that the regression line passes through the origin could not be rejected at a level of significance of 0.05. Note that the level of significance is the probability of rejecting the null hypothesis when it is true [17].
Control experiments For these experiments, 3 ml of cell suspension was transferred into the bioreactor, and the optical density of the suspension was recorded for up to 10 h in the absence of the scaffold. Initially, the cell concentration was adjusted according to the optical density data, by adding CIM. More than six such control experiments were performed, both for trypsinized or non-trypsinized cells. The initial cell concentration for control experiments was in the range of the calibration curve. Moreover, before and after the recording time, using the Z2 Beckmann Coulter Counter, with the threshold set between 8 and 15 μm, cells were counted and measured in diameter to determine whether they preserve shape and number. Trypan blue exclusion viability tests were preformed in order to evaluate cell status after the recording time in biomimetic conditions.
Seeding experiments For the demonstrative measurements of Fig. 5, two samples of 3-ml cell suspensions of high (3 × 10⁶/ml) and low (106/ml) cell concen-/breaktration were prepared as described above. For sample A, a small matrix of about 2 × 2 × 5 mm was immersed in the higher concentration suspension, and for sample B, a larger matrix of about 5 × 5 × 5 mm was immersed in the lower concentration suspension. For the comparative studies shown in Fig. 7, six samples of 3 ml cell suspension with a similar concentration of about 106 cells/ml were used in the presence of similar-sized scaffolds of roughly 3 × 3 × 5 mm and about 5 mg dry weight. For samples 1–3, cells were detached by 2 mM EDTA-only solution, whereas for samples 4–6, cells were detached by 1 mM trypsin–EDTA solution, as described above [13]. Other experimental conditions were similar for all samples.
Kinetic Model of Cell Seeding of Porous Solid Scaffolds
A theoretical approach to cell seeding must account for the kinetics of integrin activation, cell attachment to the available sites offered by the scaffold, and, depending on the applied shear stress, also for the detachment of some cells.
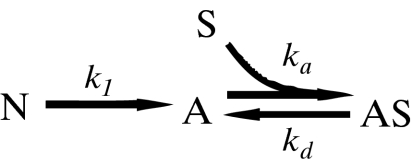
The simplest kinetic scheme that incorporates these events is given by:
 |
1 |
where N denotes cells in suspension that are not yet able to attach because their integrin function is not yet recovered after trypsin/EDTA treatment, A refers to adherent cells, S denotes available attachment sites, and AS stands for attached cells. The rate constant k1 is a global measure of integrin activation kinetics, ka is the overall rate constant of cell attachment, and kd accounts for cell detachment.
The second, reversible step of the reaction scheme of Eq. 1 is similar to Langmuir’s theory of adsorption of atoms or molecules onto solid surfaces [12]. Applying it to cellular phenomena amounts to also adopting the basic assumptions of this theory: (i) attachment cannot proceed beyond monolayer coverage, (ii) all regions of a scaffold are equally suitable for cell attachment, and (iii) the ability of a cell to attach to a site is independent of the occupation of neighboring sites. While the first hypothesis is in good agreement with experimental data on non-aggregating anchorage-dependent cells [18], the other two are rough approximations. The internal regions of a porous scaffold are suitable for cell attachment: their availability, however, is highly dependent of the specific seeding technique [8]. Thus, the degree of validity of our second supposition depends both on the scaffold and on the bioreactor used for seeding. The third assumption is probably valid for any cell type at low surface densities of attached cells, well below the confluence limit. Nevertheless, motivated by the need for high scaffold cellularities, we will apply the Langmuir model also in the limit when the scaffold is saturated with cells, and will return to the question of the validity of assumption (iii) in the next section.
The kinetic equations associated to the reaction steps of Eq. 1 are given by:
 |
2 |
where NN, NA, NAS are the numbers of cells in the state N, A, and AS, respectively, and  denotes the total number of cell attachment sites offered by the given scaffold. The initial conditions associated with the above system are:
 |
3 |
Note that, at any instant of time, the total number of cells in the three states is constant; according to the Eq. 3, this value is
 |
4 |
which is true in the absence of cell death and proliferation during the seeding process.
An important parameter of our model is the ratio,  , of the number
  of available sites and the total number of cells in the initial suspension, N0. Henceforth, r will be called the site availability ratio. It is the average number of sites accessible for a given cell. If this ratio is larger than one, the scaffold is able to accommodate all the cells from the suspension.
The above set of equations (Eq. 2) is a natural generalization of Langmuir’s kinetic equation of adsorption. Indeed, in the case of a molecular solution in contact with a planar surface, the first step of the reaction scheme from Eq. 1 is absent, i.e., all solute particles are capable of adsorbing onto the surface (NN = 0). In this case, Eq. 2, combined with Eq. 4, reduces to a single, non-linear ordinary differential equation (ODE):
 |
5 |
which may be rewritten in terms of the fractional coverage,  , of the solid surface:
 |
6 |
In the usual context, the solution has a large enough volume to contain a number of solute particles of the order of the Avogadro number; thus adsorption does not significantly change the concentration of the solution; this amounts to taking the limit r → 0 in Eq. 6, obtaining thereby the well-known linear ODE which yields the Langmuir isotherm [12].
The kinetic equations of Eq. 2 may be written in a simpler form in terms of the mole fractions of cells found in each state at a given moment:  ,
,  , and
, and  , which may be viewed as the probabilities of finding a cell in these states:
 |
7 |
The initial conditions are:
 |
8 |
The solution of Eq. 7 obeys the normalization condition
 |
9 |
The system of non-linear ODEs of Eq. 7 may be solved numerically. To this end, we used the ode45 solver of Matlab 6.1 (The MathWorks, Inc., Natick, MA, USA), which is based on an explicit Runge–Kutta (4,5) formula [19].
In order to make contact with experimental results, we note that the calibration experiments demonstrated the proportionality of the optical density with the concentration of suspended cells (Fig. 3), that is:
 |
10 |
where OD0 is the optical density of the suspension at the beginning of seeding. Together with Eq. 9, this yields the fraction of successfully seeded cells as a function of time,
 |
11 |
which is to be compared with the theoretical function obtained as a solution of Eq. 7.
In order to find an optimal fit between theory and experiment, we used a non-linear least squares procedure based on the simplex algorithm [20], implemented by the Matlab function fminsearch. The optimization algorithm yields the rate availability ratio, r, along with the rate constants k1, ka, and kd, which minimize the chi-square merit function [21].
Results and Discussion
As cell seeding proceeds, the cell suspension becomes gradually more transparent, so the transmission approaches 100%, which corresponds to pure cell culture medium. As a qualitative demonstration, we present in Fig. 5 the time course of the seeding suspension’s transmission in the control case compared with the cases of samples A and B. Diamond-shaped markers represent the results of a single control experiment (out of six), in which no scaffold was immersed in the cell suspension. The Coulter Counter data revealed a slight decrease in cell number (e.g., from 1.24 × 10⁶/ml to 1.14 × 10⁶/ml). The mean particle diameter was almost unchanged (e.g., 13.2 μm, the normal cell size), while standard deviation almost doubled (e.g., from ±1.2 to ±2.2 μm), which gives a quantitative evaluation of the change in particle diameters during the control experiments. A Trypan blue viability test gives a rate of over 80% cells that were able to exclude the blue dye after the recording time at a stirring speed of about 300 rpm at 37°C. On the microscopic images taken during the viability tests, small cell clusters could be seen occasionally (data not shown). Results of cell counting indicate that cells do not attach in large numbers to the walls of the bioreactor. On the other hand, cell–cell interactions did not induce significant changes in the optical density of the suspension. Nevertheless, it is important to keep in mind that the reaggregation of cells and cell-wall attachment can be important sources of error in the approach proposed here.
Figure 5 shows typical transmission curves: squares plot the evolution of the transmission of a cell suspension of 3 × 10⁶ cells/cm3 in the vicinity of a 2 × 2 × 5-mm scaffold piece (sample A), triangles refer to a less concentrated suspension of 106 cells/cm3, in contact with a larger scaffold, of 5 × 5 × 5 mm (sample B), whereas diamonds show the results obtained in the absence of a scaffold in the cell suspension (control).
In order to make contact between experiments and theoretical models of cell seeding kinetics, we rely on the results of the calibration experiments (Fig. 4), which suggest that optical density is directly proportional to the suspension’s concentration (Eq. 10). From transmission curves, we express the optical density,  and normalize it by its initial value, OD0. Figure 6 compares the predictions of the two-compartment kinetic model of Ref. [7] with the predictions of the model described in Section 2 for results of three different seeding experiments. The predictions were made with the assumption that cell detachment is absent (i.e., the second step in Eq. 1 is irreversible).
Table 1 lists the model parameters obtained by non-linear least squares fit of optical density data using the two-compartment model [7] (sets a1, b1, and c1) and our non-linear model based on Langmuir’s theory (sets a2, b2, and c2). Data sets were provided as following: sample 2—data sets a1 and a2, sample A—data sets b1 and b2, and sample 6—data sets c1 and c2. The two-compartment model predicts an exponential decay of the relative optical density, i.e.,  , where K is the overall rate constant of cell attachment to the solid scaffold. The best fits obtained by this model are depicted in Fig. 6 by dotted lines, whereas the best fits obtained by the Langmuir model are shown by solid lines. The goodness-of-fit was assessed on the basis of the chi-square probability function: the probability that the chi square exceeds its minimum value by chance, even for a correct model, may be expressed as
  . Here P(a, x) denotes the incomplete gamma function [22], ν is the number of degrees of freedom (the number of experimental points minus the number of model parameters), and χ2 is the minimum of the chi-square merit function. The value of the merit function depends on the experimental error [21]. We estimated the experimental error as the standard deviation of the relative optical density obtained in control experiments such as the one shown in Fig. 5 (diamonds), and obtained σ = 0.016.
Table 1.
Model parameter sets obtained by fitting the experimental data shown in Fig. 5 by the first order kinetic model of Ref. [7] (a1, b1, and c1) and by the model based on Langmuir’s theory of adsorption (a2, b2, and c2)
| Set | N0(106) | r | k1(s − 1) | kaN0(s − 1) | K(s − 1) | χ2 | ν | Q |
|---|---|---|---|---|---|---|---|---|
| a1 | 3.03 | – | – | – | 2.281 × 10 − 4 | 47.296 | 44 | 0.34 |
| a2 | 3.03 | 1.127 | 3.550 × 10 − 4 | 1.290 × 10 − 3 | – | 4.854 | 44 | 1 |
| b1 | 6.9 | – | – | – | 3.447 × 10 − 5 | 352.49 | 134 | 0 |
| b2 | 6.9 | 0.872 | 3.690 × 10 − 5 | 7.96 × 10 − 3 | – | 9.704 | 134 | 1 |
| c1 | 3.28 | – | – | – | 1.195 × 10 − 4 | 395.62 | 26 | 0 |
| c2 | 3.28 | 0.737 | 2.313 × 10 − 4 | 1.903 × 10 − 3 | 0 | 0.5219 | 26 | 1 |
Here χ2 is the minimum of the chi-square merit function, ν is the number of degrees of freedom, whereas Q is a measure of the fit quality [21]
A model is considered acceptable if Q > 0.1 [21]. Thus, we may conclude that if the scaffold offers several attachment sites per cell, the two-compartment model of Vunjak- Novakovic et al. [7] is in good agreement with the data (Fig. 6a). If, however, there are more cells in the suspension than attachment sites on the scaffold (Fig. 6b and c), our kinetic model offers a better fit as can be seen also in the values of the fit quality parameter, shown in the last column of Table 1. The improved fit is not surprising, since the kinetic scheme of Eq. 1 takes into account the gradual reduction of the number of available sites as more and more sites are occupied.
In tissue engineering applications, cells are grown in 2D cultures until the desired population size is obtained. Before cell seeding of scaffolds, the cells are detached from the culture flask or Petri dish. Here, we show the results of two series of samples: in one of them detachment has been achieved by the usual trypsin–EDTA treatment, whereas in the other only EDTA, no trypsin, was used (see Section 2, Materials and Methods, for details). The results are shown in Fig. 7. For fitting the experimental data, we used the extended Langmuir model and Eq. 10 and obtained the parameters given in Table 2.
Table 2.
Model parameter sets obtained by fitting experimental data from seeding experiments with trypsin–EDTA-treated cells (sets 1–3) and EDTA-only-treated cells (sets 4–6)
| Set | Protocol | N0(106) | r | k1(s − 1) | K1N0(s − 1) | χ2 | ν | Q |
|---|---|---|---|---|---|---|---|---|
| 1. | Trypsin | 3.61 | 0.83 | 1.856 × 10 − 4 | 1.451 × 10 − 3 | 13.57 | 39 | 0.9999 |
| 2. | Trypsin | 3.28 | 0.74 | 2.313 × 10 − 4 | 1.903 × 10 − 3 | 0.52 | 26 | 1 |
| 3. | Trypsin | 3.10 | 0.79 | 3.386 × 10 − 4 | 2.003 × 10 − 3 | 2.87 | 24 | 1 |
| 4. | No trypsin | 4.11 | 0.97 | 4.312 × 10 − 4 | 3.684 × 10 − 3 | 35.39 | 24 | 0.0628 |
| 5. | No trypsin | 3.64 | 0.89 | 3.413 × 10 − 4 | 3.531 × 10 − 3 | 8.83 | 28 | 0.9997 |
| 6. | No trypsin | 3.03 | 1.13 | 3.550 × 10 − 4 | 1.290 × 10 − 3 | 4.85 | 44 | 1 |
Here χ2 is the minimum of the chi-square merit function, ν is the number of degrees of freedom, and Q describes the fit quality [21], a model being considered correct if Q > 0.1
The last column of Table 2 shows that the fit is excellent for all data sets but one (set 4). The values of the site availability ratio, r, show that the extent to which a scaffold is populated does not depend merely on scaffold microstructure, but also on cell physiology. In the case of the less aggressive, only EDTA treatment, the scaffold hosted more cells. An interesting question arises, namely whether this elevated site availability results from more efficient attachment or from better mobility of the attached cells.
Note, however, that the model proposed here represents a harsh approximation of the biological realm by adopting the assumptions of the Langmuir theory. Our seeding chamber is similar to spinner flasks used with close to 100% efficiency for dynamic cell seeding of highly porous scaffolds [7]. It has been shown, however, that spinner flasks are less successful when used to seed scaffolds with sponge-like microstructure [23], such as our collagen scaffolds (Fig. 1). Thus, we do not expect assumption (ii) to be strictly valid in the context of our experiments. Nevertheless, the methods proposed in the present article may be implemented for a perfusion-seeding bioreactor, considered to be the best tool for uniform seeding of porous solid scaffolds [8], making all attachment sites available, thereby improving the accord with assumption (ii).
The third assumption seems reasonable at low scaffold coverage. In the limit of practical interest, of high cell densities, the validity of assumption (iii) represents an interesting problem for further studies. Cell type-dependent signaling and/or cell–cell adhesion may reduce or increase the rate of attachment of cells to available sites that are adjacent to occupied sites.
Even if the Langmuir model offers a very good fit of the experimental time course of cell seeding, deviations from its basic assumptions may impede the physical interpretation of the fitted parameters. For example, if the model assumptions hold, the site availability ratio, r, only depends on scaffold size and the number of cells used for seeding. This is not true if the scaffold is inhomogeneous (Fig. 1) and/or the cells do not reach some regions. Therefore, we did not attempt here to study the scaling of r with scaffold volume, but we plan to return to this problem using synthetic polymer scaffolds with precisely characterized microstructure such as the polyglycolic acid (PGA) scaffolds [7].
The kinetic parameters obtained from the fit are global rates, which incorporate intrinsic, cell level properties, as well as geometric properties of the scaffold. For example, the rate constant ka of cell attachment depends not only on cell type and scaffold material but also on scaffold size and porosity. The two aspects may be separated in the framework of a two-compartment model, able to account for the exchange of cell suspension between the magnetically stirred reservoir and the scaffold [7].
Conclusions
Non-invasive, optical monitoring of dynamic cell seeding of tissue engineering scaffolds is helpful in assessing the efficiency of various seeding protocols. Here, we propose a versatile experimental setup and prove its functionality in a comparative study of cell seeding versus cell detachment protocols.
In an effort to understand cell seeding kinetics in the limit of high concentrations of seeded cells, we developed a non-linear kinetic model rooted in Langmuir’s theory of adsorption. The kinetic scheme includes a preliminary step that represents the recovery of cell–substrate adhesion molecules, and then treats cell attachment to the available sites. While fitting our experimental data, we neglected the detachment of previously attached cells. Nevertheless, detachment has been included in the model equations because it may be significant in seeding protocols that involve a high shear stress.
Circular-flow seeding of collagen type I scaffolds was found to be more efficient for no-trypsin detached cells, as reveled by the higher plateau observed in Fig. 7b. Moreover, the rate constant k1 was higher in the context of no-trypsin detachment (Table 2), suggesting that the Langmuir model is suitable to describe kinetic changes stemming from the presence of integrins at the cell surface right from the beginning of the seeding process. Trypsinized cells require integrin expression to occur, which can happen only after physical interaction with the collagen fibers of the scaffold. Thus, the lower values of k1 observed in trypsin-detached cells could be explained by the time needed for the cells in suspension to express a sufficient amount of integrin necessary for adhesion. Similar studies may be conducted for the evaluation of differences in seeding efficiency arising from differences in scaffold material, surface chemistry, or microstructure characterized by global porosity, pore size distribution, and pore interconnectivity.
From the optical density data and microscopy studies, we conclude that cell–cell aggregation occurred to a very low extent. Usually, such cell types, i.e., fibroblasts, attach to substrates until confluence is reached [18], thereby leading to monolayer coverage, in accordance with assumption (i). On the other hand, if cells are able to form aggregates in suspension, cluster formation has to be taken into account during the calibration of the optical densitometer. Furthermore, in the context of cell aggregate seeding, assuming that attachment cannot proceed beyond monolayer coverage is not justified. Nevertheless, Langmuir kinetics may still be valid if the aggregate sizes have a narrow distribution around their average value. In such a context, the adsorbing entities would be the cell aggregates. Whether the approach presented here works also for cell aggregate seeding is an open problem.
At low scaffold cellularities, our model gives similar results to the linear, two-compartment model [7], which treats cell attachment as a first-order kinetic process. For scaffolds that are too small to accommodate all the cells from the seeding suspension, the Langmuir model gives a much better fit than the linear one.
The kinetic parameters of the Langmuir model are overall rate constants of integrin recovery and cell attachment. A deeper insight could be gained from theoretical analysis by turning the Langmuir model into a two-compartment model along the lines of Ref. [7] and conducting systematic experiments to isolate geometric parameters from intrinsic kinetic parameters. Our further studies will address such problems by studying cell seeding of highly porous PGA scaffolds of various sizes in order to obtain the rate constant of cell attachment. Then, the model will be used to predict the time course of seeding as a function of scaffold size and cell concentration in the suspension. An important input in this direction may come from research groups that work with synthetic scaffolds of precisely controlled microstructure.
Acknowledgements
This work was supported by the Romanian Program for Excellence in Research (CEEX 11/2005). We thank F. Marga and G. Forgacs for the scanning electron microscopy study of the scaffolds used in this work.
References
- 1.Langer, R., Vacanti, J.P.: Tissue engineering. Science 260, 920–926 (1993) [DOI] [PubMed]
- 2.Griffith, L.G., Naughton, G.: Tissue engineering—current challenges and expanding opportunities. Science 295, 1009–1014 (2002). doi:10.1126/science.1069210 [DOI] [PubMed]
- 3.Williams, D.F.: To engineer is to create: the link between engineering and regeneration. Trends Biotechnol. 24, 4–8 (2006). doi:10.1016/j.tibtech.2005.10.006 [DOI] [PubMed]
- 4.Ingber, D.E., Levin, M.: What lies at the interface of regenerative medicine and developmental biology? Development 134, 2541–2547 (2007). doi:10.1242/dev.003707 [DOI] [PubMed]
- 5.Hunziker, E., Spector, M., Libera, J., Gertzman, A., Woo, S.L.-Y., Ratcliffe, A., Lysaght, M., Coury, A., Kaplan, D., Vunjak-Novakovic, G.: Translation from research to applications. Tissue Eng. 12(12), 3341–3364 (2006). doi:10.1089/ten.2006.12.3341 [DOI] [PubMed]
- 6.Naughton, G.K.: From lab bench to market—critical issues in tissue engineering. Ann. N. Y. Acad. Sci. 961, 372–385 (2002) [DOI] [PubMed]
- 7.Vunjak-Novakovic, G., Obradovic, B., Martin, I., Bursac, P.M., Langer, R., Freed, L.: Dynamic cell seeding of polymer scaffolds for cartilage tissue engineering. Biotechnol. Prog. 14, 193–202 (1998). doi:10.1021/bp970120j [DOI] [PubMed]
- 8.Wendt, D., Marsano, A., Jakob, M., Heberer, M., Martin, I.: Oscillating perfusion of cell suspensions through three-dimensional scaffolds enhances cell seeding efficiency and uniformity. Biotechnol. Bioeng. 84, 205–214 (2003). doi:10.1002/bit.10759 [DOI] [PubMed]
- 9.Gurdon, J.B.: A community effect in animal development. Nature 366, 772–774 (1988). doi:10.1038/336772a0 [DOI] [PubMed]
- 10.Zhdanov, V.P., Kasemo, B.: Synchronization of metabolic oscillations: to cells and ensembles of adsorbed cells. J. Biol. Phys. 27, 295–311 (2001). doi:10.1023/A:1014209410688 [DOI] [PMC free article] [PubMed]
- 11.Carrier, R.L., Papadaki, M., Rupnick, M., Schoen, F.J., Bursac, N., Langer, R., Freed, L.E., Vunjak-Novakovic, G.: Cardiac tissue engineering: cell seeding, cultivation parameters, and tissue construct characterization. Biotechnol. Bioeng. 64, 580–589 (1999). doi:10.1002/(SICI)1097-0290(19990905)64:5<580::AID-BIT8>3.0.CO;2-X [DOI] [PubMed]
- 12.Atkins, P.W.: Physical Chemistry, 5th edn, Chapter 28. Oxford University Press, Oxford (1994)
- 13.Freshney, R.I.: Culture of Animal Cells—A Manual of Basic Technique, 4th edn, pp. 185–186. Wiley-Liss, New York (2001)
- 14.Torado, G.J., Habel, K., Green, H.: Antigenic and cultural properties of cells doubly transformed by polyoma virus and SV40. Virology 27, 179–185 (1965). doi:10.1016/0042-6822(65)90157-1 [DOI] [PubMed]
- 15.Imoto, E., Kakuta, S., Hori, M., Yagami, K., Nagumo, M.: Adhesion of a chondrocytic cell line (USAC) to fibronectin and its regulation by proteoglycan. J. Oral Pathol. Med. 31, 35–44 (2002) [DOI] [PubMed]
- 16.Catledge, S.A., Vohra, Y.K., Bellis, S.L., Sawyer, A.A.: Mesenchymal stem cell adhesion and spreading on nanostructured biomaterials. J. Nanosci. Nanotechnol. 4, 986–989 (2004). doi:10.1166/jnn.2004.137 [DOI] [PubMed]
- 17.Walpole, R.E., Myers, R.H.: Probability and Statistics for Engineers and Scientists, 3rd edn, pp. 315–331. Macmillan, New York (1985)
- 18.Alberts, B., Johnson, A., Lewis, J., Raff, M., Roberts, K., Walter, P.: Molecular Biology of the Cell, 4th edn. Garland Science, New York (2002)
- 19.Dormand, J.R., Prince, P.J.: A family of embedded Runge–Kutta formulae. J. Comput. Appl. Math. 6, 19–26 (1980). doi:10.1016/0771-050X(80)90013-3 [DOI]
- 20.Nelder, J.A., Mead, R.: A simplex method for function minimization. Comput. J. 7, 308–313 (1965)
- 21.Press, W.H., Teukolsky, S.A., Vetterling, W.T., Flannery, B.P.: Numerical Recipes: The Art of Scientific Computing, 3rd edn, pp. 773–836. Cambridge University Press, New York (2007)
- 22.Abramowitz, M., Stegun, I.A. (eds.): Pocketbook of Mathematical Functions. Abridged edition of Handbook of Mathematical Functions, Material selected by M. Danos, M. and Rafelski, J., pp. 81–82. Verlag Harri Deutsch, Thun-Frankfurt/Main, Germany (1984)
- 23.Martin, I., Shastri, V.P., Padera, R.F., Yang, J., Mackay, A.J., Langer, R., Vunjak-Novakovic, G., Freed, L.E.: Selective differentiation of mammalian bone marrow stromal cells cultured on three-dimensional polymer foams. J. Biomed. Mater. Res. 55, 229–235 (2001). doi:10.1002/1097-4636(200105)55:2<229::AID-JBM1009>3.0.CO;2-Q [DOI] [PubMed]