Abstract
The expansion of stem cell numbers while retaining their developmental properties is a bioprocess challenge. We compared the growth rates and embryoid body (EB) formation yields of R1 and EFC murine embryonic stem cells (mESC) cultured in two basal media (DMEM or DMEM:F12) with additions of 1.7–15% fetal bovine serum (FBS) or serum replacer (KOSR). Whereas the basal medium or KOSR dose did not have a significant effect on growth rate for either cell line, increasing doses of KOSR had a significant negative effect on the EB yield of EFC cells. Use of DMEM:F12 and increasing doses of FBS independently and significantly increased the growth rate for both cell lines. DMEM:F12 also significantly increased EB yields for both cell lines. The results show that use of DMEM:F12 and several-fold lower than conventional concentrations of KOSR can efficiently support maintenance of mESC and that KOSR should be dose as well as lot optimized.
Keywords: Embryonic stem cells, Murine, Embryoid body yield, Serum replacement, Basal medium
Introduction
Embryonic stem cells (ESC) derived from the inner cell mass of blastocyst stage embryos have great potential for experimental use as well as therapeutic applications. Culturing large numbers of ESC while maintaining their developmental potential is a bioprocessing challenge. A critical component of murine ESC (mESC) maintenance media is serum which provides hormones, essential nutrients, and alters the physiological/physiochemical properties of the medium. Serum contains a variety of growth factors and other undefined components that can affect the plating efficiency, growth and differentiation of mESC. Serum batches should be prescreened in order to ensure that ESC is maintained in an undifferentiated state.
A commercial formulation, Knockout™ serum replacement (KOSR) (Invitrogen, Carlsbad, CA), is used for murine and human ESC cultures as a substitute for serum. The product is a more-defined growth supplement (although the exact formulation is not described, Price et al. 1998) that reduces the spontaneous differentiation of ESC. Protocols recommend that it be used at the same level [15% (v/v)] as serum for the maintenance of ESC.
Colony-forming cell and embryoid body formation in vitro assays can be used when testing culture reagents or examining the consequences of genetic manipulation. The colony-forming cell (CFC) assay determines the plating efficiency of ESC populations. The embryoid body (EB) assay can also be performed at a clonal level in vitro and reflects multilineage differentiation potential (Keller et al. 1993). As ESC differentiates in culture, they lose their ability to form CFCs or EBs. We have demonstrated that, under differentiating culture conditions, the EB assay detects decreasing mESC numbers earlier than the CFC assay or phenotypic characterization by Oct-4 or SSEA-1 (Palmqvist et al. 2005). Also, EB formation has been used as the first step in many mESC differentiation protocols.
The murine ESC lines, R1 and EFC, were used as model systems for this study of basal media, serum and KOSR concentration influences on cell proliferation and the maintenance of embryoid body forming ability. This was followed by time course experiments with several KOSR lots. The two basal media examined were Dulbecco’s modified Eagle’s medium (DMEM) and Ham’s F12 combined with DMEM (50:50, DMEM:F12). DMEM was developed for use with serum supplementation (Dulbecco and Freeman 1959; Eagle 1955) and is commonly used for mESC. DMEM:F12 has been used to develop media for growing cells in more defined serum-free conditions (Mather and Sato 1979).
Materials and methods
Growth of murine embryonic fibroblasts
All reagents were obtained from StemCell Technologies Inc., Vancouver, BC, unless otherwise indicated. Day 12.5 MEFs from a CD-1 murine strain were thawed onto a gelatinized dish and maintained at 37 °C in humidified air with 5% CO2 in DMEM supplemented with 10% fetal bovine serum (FBS), 100 U/mL penicillin, 100 μg/mL streptomycin and 100 μM monothioglycerol (MTG) (Sigma–Aldrich, Oakville, ON). Cells to be irradiated were trypsinized, suspended in 4 mL of medium, and exposed to 60 Gy from an X-ray source before plating for use as feeder cells.
Growth of murine embryonic stem cells
The R1 (Nagy et al. 1993) and EFC (Nichols et al. 1990) ESC were maintained in 37 °C humidified air with 5% CO2 on a layer of irradiated MEFs and fed daily with a complete change of ESC maintenance medium (high-glucose DMEM, 15% ESC-qualified FBS, 0.1 mM nonessential amino acids, 2 mM glutamine, 1,000 U/mL LIF, 100 U/mL penicillin, 100 μg/mL streptomycin and 100 μM MTG). The R1 cells were from passage 17 while the EFC cells were from passage 11 and had been frozen at 106 cells per vial. Both cell lines were used within 5 passages of thawing. The cells were passaged every second day in maintenance cultures as follows. Cells were incubated with 0.25% trypsin and 1 mM EDTA (T/E) (Invitrogen Life Technologies, Burlington, ON) for 5 min. T/E activity was then quenched with DMEM supplemented with 10% FBS followed by centrifugation (300g, 7 min) and suspension in ESC maintenance media. Viable cells were plated at 2 × 10⁶ cells per 100-mm dish on irradiated MEFs or at 0.6 × 10⁶ cells per 60-mm gelatinized dish, and cultured for 48 h at 37 °C, 5% CO2.
Phenotypic marker analysis (SSEA-1 and Oct-4 expression by flow cytometry) as well as gene expression profiles of key pluripotency marker genes (by QRT-PCR analysis) in R1 and EFC cells as well as in EBs were performed to ensure that cell lines are indeed pluripotent. Detailed protocols and data have been previously published (Palmqvist et al. 2005).
Preparation of medium for serum or KOSR dose-response experiments
ESC maintenance media were prepared as described above using either DMEM or DMEM:F12. FBS or KOSR was added at three concentration levels [1.67, 5 or 15% (v/v)]. To ensure that the pH values of both the DMEM and DMEM:F12 media were the same, a powdered DMEM formulation without glucose, glutamine, sodium bicarbonate, sodium pyruvate and phenol red (Sigma-Aldrich, Cat #D5030) was used. For both DMEM- and DMEM:F12-basal media, the sodium bicarbonate concentration was adjusted to obtain pH 7.3 at equilibrium with 5% CO2 at 37 °C via the following equation (Schmelzer et al. 2000):
 |
1 |
The osmolarities of the ESC maintenance media ranged between 322 ± 5 and 334 ± 5 mOsm/kg. Both the FBS and KOSR experiments were carried out on gelatinized 60-mm tissue culture dishes (Sarstedt, Montreal, QC).
ESC culture and growth rate
ESC were thawed and cultured for two passages on irradiated MEFs, harvested, suspended in ESC maintenance media and plated on tissue culture plates for 15–20 min at 37 °C, 5% CO2 to deplete contaminating MEFs. Non-adherent and loosely adherent ESC were collected by gently washing the surface of the tissue culture plate with ESC maintenance medium. The cells were then centrifuged, suspended in ESC maintenance medium and the viable cell numbers determined by trypan blue exclusion. The frequency of contaminating MEFs in the undifferentiated (day 0) ESC samples was estimated to be less than 0.2% based on cell size during counting. Cultures with different FBS or KOSR concentrations were initiated at 0.2 × 10⁶ cells/60-mm dish (4 mL medium) in duplicate. Cells were cultured at 37 °C, 5% CO2. The conditioned media from these cultures were collected after 24 h and replaced with fresh media. The following day (48 h total culturing time), the cultures were harvested by trypsinization and the cell concentrations determined by counting cells either on a hemocytometer or an automated cell counter (Cedex, Innovative Directions, Pinole, CA) and growth rates were calculated as described below.
Determination of growth rate
The average specific growth rate ( ) under various serum and/or KOSR concentrations was calculated using the equation:
 |
2 |
where Xv (cells/mL) is the viable cell concentration at the end of the culture period, X0 (cells/mL) the inoculum viable cell concentration and Δt(h) the 48 h time interval.
Embryoid body formation assay
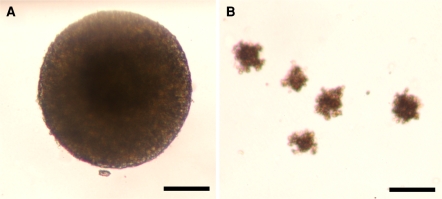
To determine whether exposure to various serum or KOSR concentrations in the maintenance medium had an effect on the EB-forming potential of ESC using the Stemcell Technologies protocol and reagents. The test cells were suspended in a semi-solid ES differentiation medium consisting of 0.9% methylcellulose, 15% FBS (pre-tested for ES differentiation), 2 mM glutamine, 150 μM monothioglycerol (MTG) and the remainder IMDM. The inoculum cells from day 0 were compared with cells harvested from the FBS or KOSR experiments. Defined numbers of cells (1,000 for EFC cells, 2,500 for R1 cells) were placed in 35-mm low adherence petri-style dishes. The EB numbers were counted microscopically after 5–6 days of culture. Morphologically, EBs were 3-dimensional (more or less spherical) with fairly smooth margins and a minimum diameter of ~130–150 μm (Fig. 1a). Figure 1b shows cell aggregates that were not considered to be EBs. Considerable variation in the sizes of counted EBs was observed. The EB outputs depended on the initial input cell numbers and were in the range of 500–5,000 cells/mL. At greater initial cell densities, both the EB output and the morphology of the resulting EBs varied considerably (data not shown). The EB yield per initial cell for each culture was determined by first calculating the number of EBs that would have formed if all the cells harvested had been inoculated in the EB cultures and then dividing that number by the cell number at the start of the culture as:
 |
3 |
Fig. 1.
Cellular aggregates that were essentially spherical with fairly smooth margins and a minimum diameter of ~130–150 μm were considered as EBs. Representative micrographs of a 3-dimensional cellular aggregates that were counted as EBs and b cellular aggregates that were not considered to be EBs. Scale bar represents 100 μm
Statistical analyses
The effects of basal medium, supplement and supplement dose on growth rate or EB yield for the EFC or the R1 cell lines were analyzed with a 2 × 2 × 3 ANOVA. EB yield values were square-root transformed before analysis to satisfy assumptions of normality. The effects of KOSR lot variation and time in culture on R1 growth rate and EB yield were analyzed with 2 × 2 ANOVA. p values less than 0.05 after correction for multiple comparisons were considered statistically significant.
Results
Comparisons between EFC and R1 cell lines
The average EFC cell growth rate was 1.4 times the R1 rate (0.039 vs. 0.027 h−1; p < 0.001). The EFC cells had a 16-fold greater EB forming capacity than R1 cells (0.66 vs. 0.037 EB/input cell; p < 0.001).
Effect of KOSR dose on growth rates and embryoid body yields
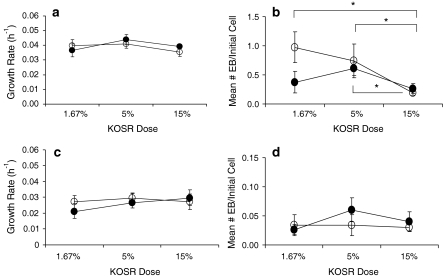
The level of KOSR supplement (1.67, 5 or 15%) and the type of basal medium used did not significantly affect the growth rate of EFC (Fig. 2a) or R1 (Fig. 2c) cells in both basal media. Increasing doses of KOSR supplement significantly reduced the EB yield from EFC cells cultured in DMEM or DMEM:F12 (p < 0.01, IMDM was used in the EB assay). The EB yield from EFC cells in 15% KOSR was 63 and 50% lower than with 5% KOSR in DMEM and DMEM:F12, respectively (Fig. 2b). The EB yield from R1 cells was not significantly affected by KOSR dose or by the basal medium used (Fig. 2d).
Fig. 2.
The effects of KOSR supplement dose (1.67, 5 or 15%) and basal media (DMEM or DMEM:F12) on a growth rate of EFC cells, b EB formation of EFC cells, c growth rate of R1 cells and d EB formation of R1 cells. Values shown are mean ± SEM (n = 7 for R1 cells and n = 6 for EFC cells). Solid circles represent DMEM and open circles represent DMEM:F12. *Denotes significant changes in the EFC EB formation in DMEM or DMEM:F12
Effects of FBS on growth rates and embryoid body yields
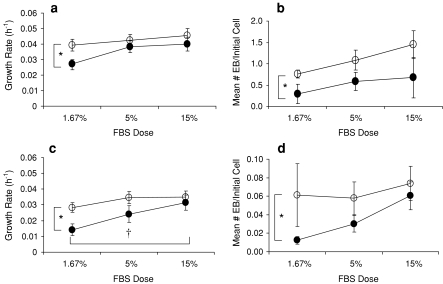
In contrast to the KOSR results, when the supplement was FBS, DMEM:F12 supported significantly higher growth rates of EFC (p < 0.05) as well as of R1 cells (p < 0.01) (Fig. 3a, c). With FBS, the DMEM:F12 also yielded significantly higher EFC EB formation (p < 0.05) (Fig. 3b), though, for the R1 cells, only p = 0.051 was obtained for this effect (Fig. 3d). Increasing doses of FBS were associated with progressive increases in the growth rates for R1 cells (p < 0.05) and, though the same trend was obtained for EFC growth rates, it did not meet the significance test (p = 0.059). In contrast to the KOSR results, increased FBS supplement doses did not result in decreased EB yields for either EFC or R1 cells.
Fig. 3.
The effects of FBS supplement dose (1.67, 5 or 15%) and basal media (DMEM or DMEM:F12) on a growth rate of EFC cells, b EB formation of EFC cells, c growth rate of R1 cells and d EB formation of R1 cells. Values shown are mean ± SEM (n = 7 for R1 cells and n = 6 for EFC cells). Solid circles represent DMEM and open circles DMEM:F12. *Denotes a statistically significant increases in growth rate and EB formation for both cell lines when cultured in DMEM:F12 versus DMEM. †Denotes a statistically significant increase in R1 growth rate with increasing dose of FBS
Comparison of KOSR lots
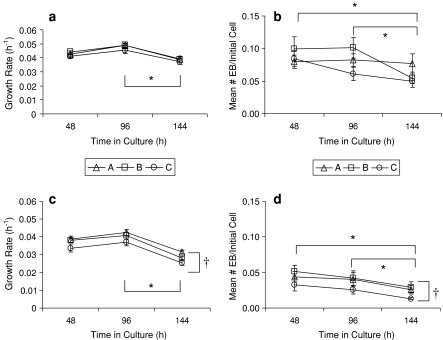
Three additional KOSR lots were compared in DMEM and DMEM:F12 at the 5 and 15% KOSR dose levels over the 144 h course of 3 R1 mESC passages (Fig. 4). Since there was no significant difference between the DMEM and DMEM:F12 results, the data were pooled before analyses of the lot variation and time effects. The growth significantly decreased for the passage ending at 144 h for both the 5 and 15% KOSR supplements (p < 0.05). Significant variations in growth rate were not observed between lots at the 5% KOSR supplement level, but significant and consistent variations in the growth rate were observed between the lots at the 15% KOSR supplement level (p < 0.01). A similar pattern was seen for EB formation variability depending on the KOSR lot. For EB yield, no significant lot variation was detected at 5% KOSR supplement but a significant decline in EB formation was observed over time (p < 0.05). At 15% KOSR, both the lot (p < 0.01) and the time (p < 0.01) had a significant effect on the EB yield from the R1 cells.
Fig. 4.
The effects of three KOSR lots (A, B and C) and time in culture on the growth rates and EB yields of R1 cells: a growth rate in 5% KOSR, b EB formation in 5% KOSR, c growth rate in 15% KOSR and d EB formation in 15% KOSR. Values shown are mean ± SEM (n = 8). *Denotes a significant decrease at 144 h. †Denotes significant differences between KOSR
Discussion
The results of this study demonstrate the importance of optimizing basal medium and supplement dose to maximize the expansion of mESC populations. While high-glucose DMEM is the conventional basal medium for mESC, when FBS was used, DMEM:F12 supported greater growth rates and EB yields. When KOSR was used, DMEM:F12 did not significantly increase the growth rate or EB yield compared to DMEM. DMEM and F12 are often mixed to combine the higher concentrations of components in DMEM with the wider range of Ham’s F12 ingredients. For instance, the addition of Ham’s F12 provides components such as biotin, putrescine, lipoic acid, glycine, proline, copper and zinc that are not present in DMEM. The enriched DMEM:F12 likely provides some of the components included in KOSR (Price et al. 1998) and this could explain the lesser benefit obtained by adding Ham’s F12 to the KOSR containing medium.
While the level of KOSR supplementation had no significant effect on growth rates in either cell line, it reduced EFC EB formation with increasing dose from 5 to 15%. This result demonstrates that the commonly used 15% KOSR level can be suboptimal for maximizing EB yields. This might be due to the presence of similar components in both KOSR and DMEM:F12 such that their combined concentrations became inhibitory to the EFC cells at high KOSR levels (i.e. high-dose inhibition). There is no apparent high-dose inhibition seen with increasing serum concentration levels, indicating potentially different components present at different concentrations in the two supplements. It was remarkable that supplementation with 5% KOSR, and even 1.67% in some cases, maintained high growth rates in KOSR cultures of mESC. The differences in growth rates between 5 and 15% FBS also were not significantly different suggesting that FBS could be reduced to the 5% level and still maintain an acceptable growth rate for both cell lines. However, in the case of serum, this could result in a decreased EB yield.
Like FBS, KOSR can exhibit considerable lot-to-lot variability as demonstrated by the results of this study. For at least the EFC cell line, the commonly used 15% KOSR levels resulted in sub-maximal EB yields for EFC, especially in DMEM:F12. In cases like this, the level of KOSR added can be reduced (e.g. to 5%, Fig. 2) with the potential extra benefit of reducing the variability caused by KOSR lot effects at 15% (Fig. 4). The expense of the EFC cultures could be reduced even further by using KOSR at 1.67%, though such a low level of additive would not normally be effective.
Human ESC are routinely cultured in DMEM:F12 with 20% KOSR. It would be interesting to determine if lower KOSR concentrations could also sustain hESC in an undifferentiated state over multiple passages. However, the higher dose inhibition effect of KOSR observed with EFC mESC may be reduced for hESC when they are cultured on MEF feeders since the feeder “conditioning” of the medium could lower the concentration or otherwise protect hESC from inhibitory components.
To improve control of experimental conditions as well as culture process yields, it will be important that both murine and human ESC be cultured in completely defined serum-free conditions. For serum-free medium development, it would be advisable to perform experiments comparing new serum-free media to those supplemented with serum or KOSR at optimized levels so as to adjust the concentrations of the serum-free components with a more appropriate positive control.
Acknowledgments
The authors gratefully acknowledge Drs. Connie Eaves and Michael O’Connor for their helpful discussions. Financial support for this work was provided by StemCell Technologies, Inc. (Vancouver, BC) and the Canadian Stem Cell Network of Centres of Excellence.
References
- Dulbecco R, Freeman G (1959) Plaque production by the polyoma virus. Virology 8(3):396–397. doi:10.1016/0042-6822(59)90043-1 [DOI] [PubMed]
- Eagle H (1955) Nutrition needs of mammalian cells in tissue culture. Science 122(3168):501–514. doi:10.1126/science.122.3168.501 [DOI] [PubMed]
- Keller G, Kennedy M, Papayannopoulou T, Wiles MV (1993) Hematopoietic commitment during embryonic stem cell differentiation in culture. Mol Cell Biol 13(1):473–486 [DOI] [PMC free article] [PubMed]
- Mather JP, Sato GH (1979) The growth of mouse melanoma cells in hormone-supplemented, serum-free medium. Exp Cell Res 120(1):191–200. doi:10.1016/0014-4827(79)90549-4 [DOI] [PubMed]
- Nagy A, Rossant J, Nagy R, Abramownewerly W, Roder JC (1993) Derivation of completely cell culture-derived mice from early-passage embryonic stem-cells. Proc Natl Acad Sci USA 90(18):8424–8428. doi:10.1073/pnas.90.18.8424 [DOI] [PMC free article] [PubMed]
- Nichols J, Evans EP, Smith AG (1990) Establishment of germ-line-competent embryonic stem (ES) cells using differentiation inhibiting activity. Development 110(4):1341–1348 [DOI] [PubMed]
- Palmqvist L, Glover CH, Hsu L, Lu M, Bossen B, Piret JM, Humphries RK, Helgason CD (2005) Correlation of murine embryonic stem cell gene expression profiles with functional measures of pluripotency. Stem Cells 23(5):663–680. doi:10.1634/stemcells.2004-0157 [DOI] [PubMed]
- Price PJ, Goldsborough MD, Tilkins ML (1998) Embryonic stem cell serum replacement. International Patent Application WO98/30679
- Schmelzer AE, de Zengotita VM, Miller WM (2000) Considerations for osmolality measurement under elevated pCO(2): comparison of vapor pressure and freezing point osmometry. Biotechnol Bioeng 67(2):189–196. doi:10.1002/(SICI)1097-0290(20000120)67:2<189::AID-BIT8>3.0.CO;2-U [DOI] [PubMed]


