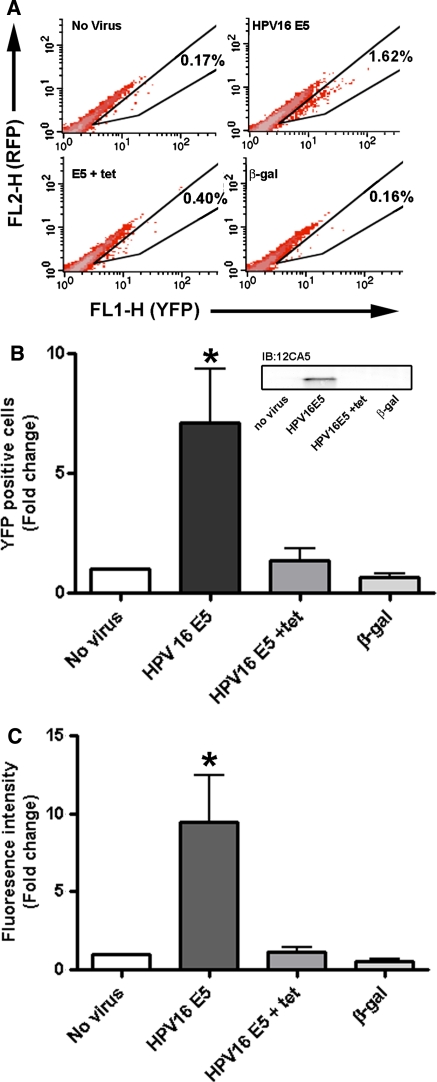
Fig. 3.
Quantitative analysis of cell–cell fusion in HeLa cells. Cells were transfected as described in “Materials and methods”, and infected with a tetracycline-regulatable (‘tet-off’) adenovirus that causes cell fusion (HPV16 E5). As controls for infection, cells were either infected with nothing (“No Virus”), virus in the presence of 1 μg/mL tetracycline (“E5 + tet”), or an adenovirus encoding β-galactosidase (β-gal) to control for any potentially deleterious adenoviral effects. After recovery (72 h), cells were analyzed using a BD FACSCalibur. a Representative Flow cytometry data from each experimental condition. Shown are scattergrams for each of the four cell populations. Each dot on the graph represents a single cell and its associated YFP fluorescence (FL1-H) and Red fluorescence (FL2-H). Non-specific auto-fluorescence activity is characterized by a proportional increased in FL1-H and FL2-H. Only cells with specific increases in YFP activity were scored as positive (boxed region). The percentage of positive cells is indicated within the boxed area. b Data plotted as the percentage of fluorescent bi-nucleated cells. Inset immunoblot using the anti-HA antibody (12CA5) to demonstrate the expression of HPV16 HA-E5. c Data plotted as the total fluorescence (mean fluorescent intensity × percentage of positive cells). This measurement takes into account the fluorescence associated with the entire population of cells. * Indicates p value <0.01 as compared any of the three control conditions

