

Abstract
11C-Loperamide is an avid substrate for P-glycoprotein (P-gp), but it is rapidly metabolized to 11C-N-desmethyl-loperamide (11C-dLop), which is also a substrate for P-gp and thereby contaminates the radioactive signal in brain. Since further demethylation of 11C-dLop generates radiometabolites with low entry into brain, we evaluated the ability of 11C-dLop to quantify the function of P-gp at the blood-brain barrier in monkey.
Methods
Six monkeys underwent twelve PET scans of the brain, five at baseline and seven after pharmacological blockade of P-gp. A subset of monkeys also had PET scans with 15O-H2O to measure cerebral blood flow. To determine if P-gp blockade affected peripheral distribution of 11C-dLop, we measured whole body biodistribution in four monkeys at baseline and after P-gp blockade.
Results
The concentration of 11C-dLop in brain was low under baseline conditions and increased 5-fold after P-gp blockade. This increase was primarily caused by an increased rate of entry into brain rather than a decreased rate of removal from brain. With P-gp blockade, uptake of radioactivity among brain regions correlated linearly with blood flow, suggesting a high single pass extraction. After correction for cerebral blood flow, the uptake of 11C-dLop was fairly uniform among brain regions, suggesting that the function of P-gp is fairly uniformly distributed in brain. On whole-body imaging, P-gp blockade significantly affected distribution of radioactivity only to brain and not to other visually identified source organs. The effective dose estimated for humans was ~ 9 μSv/MBq.
Conclusion
PET imaging with 11C-dLop can quantify P-gp function at the blood-brain barrier in monkey. The single pass extraction of 11C-dLop is high and requires correction for blood flow to accurately measure the function of this efflux transporter. The low uptake at baseline and markedly increased uptake after P-gp blockade suggest that 11C-dLop will be useful to measure a wide range of P-gp function at the blood-brain barrier in humans.
Keywords: P-glycoprotein, loperamide, PET
INTRODUCTION
P-Glycoprotein (P-gp) is a membrane-bound transporter that acts as an efflux pump in several organs of the body (1). At the blood-brain barrier, P-gp and at least three other closely related transporters can block the entry of many drugs and toxins. These substrates have a wide variety of chemical structures but tend to be ampiphilic (i.e., have lipophilic components and a positive charge). The physiological function of P-gp is thought to protect the brain from toxins in blood. P-gp may also have pathophysiological importance. For example, over-expression of P-gp may block the entry of anticonvulsant agents in the area of the epileptogenic focus (2). In addition, decreased P-gp function in Alzheimer's disease (3) and Parkinson's disease (4) may lead to the accumulation of amyloid or to the exposure of dopamine-containing neurons to exogenous toxins, respectively.
99m/94mTc-Sestamibi (5) and 11C-verapamil (6) are substrates of P-gp, but each of these agents has limitations for use at the blood-brain barrier. An effective radiotracer for P-gp at the blood-brain barrier should have high entry in the absence of P-gp. The function of P-gp can then be measured by the extent to which it blocks entry of the substrate radiotracer. In this regard, Tc-radiolabeled sestamibi is a poor agent for the brain, since its high molecular weight (783 amu) and positive charge diminish its entry even in the absence of P-gp. Although 11C-verapamil easily enters the brain after inhibition of P-gp, this radiotracer is rapidly metabolized to lipophilic radioactive compounds that also enter the brain. The presence of multiple radiolabeled species in brain confounds quantitative analysis of P-gp function (7)
In the search for an improved radiotracer to measure P-gp function, we evaluated the 11C-labeled version of loperamide, a non-prescription medication used to treat diarrhea. Loperamide is an opiate agonist and acts on μ-receptors in the gut to slow motility and thereby treat diarrhea. Despite high doses and high plasma concentrations in human subjects, loperamide lacks central nervous system effects, because P-gp efficiently blocks virtually all brain entry (8). 11C-Loperamide is an avid substrate for P-gp at the blood-brain barrier. For example, brain uptake is increased several fold both in P-gp knock out mice and in monkeys after pharmacological blockade of P-gp (9). Unfortunately, 11C-loperamide is rapidly metabolized to 11C-N-desmethyl-loperamide (11C-dLop), which is also an avid substrate for P-gp (10). Thus, after injection of 11C-loperamide, brain radioactivity measured with PET derives from two compounds – namely, the parent radiotracer and its N-desmethyl metabolite. We compared 11C-loperamide and 11C-dLop in regard to the percentage contamination of brain radioactivity in P-gp knock out mice at 30 min after injection of radiotracer. For 11C-loperamide, only 50% of extracted brain radioactivity was parent radiotracer (9). In contrast, for 11C-dLop, 90% of brain radioactivity was parent radiotracer (10). Thus, in comparison to 11C-loperamide, 11C-dLop provides a PET signal from brain of greater radiochemical purity, which allows the plasma concentrations of 11C-dLop to be used as the sole input function for compartmental quantitation of P-gp function.
The primary purpose of this study was to evaluate the ability of 11C-dLop to quantify P-gp function at the blood-brain barrier in monkeys. A secondary purpose of this study was to examine the distribution of radioactivity in the entire body at baseline and after P-gp blockade. Since P-gp is located in many organs, its blockade might alter the distribution and metabolism of 11C-dLop and, thereby, indirectly affect uptake into brain.
MATERIALS AND METHODS
Radiotracer Preparation
11C-dLop was prepared by methylation of the primary amide precursor with 11C-iodomethane (10). The radiotracer was prepared according to our Investigational New Drug Application #78,260, submitted to the US Food and Drug Administration, and a copy of which is available at: http://pdsp.med.unc.edu/snidd/. 11C-dLop was obtained in high radiochemical purity (> 99%) and with high specific activity at time of injection (153.8 ± 111.1 GBq/μmol). The injected activity and specific activity of 11C-dLop corresponded to a mass dose of 1.39 ± 0.76 μg (range 0.33 – 2.38 μg).
PET Data Acquisition
Six male rhesus monkeys (11.9 ± 2.7 kg) underwent twelve PET scans of the brain; five scans were at baseline conditions and seven after P-gp blockade. Animals were immobilized with ketamine (10 mg/kg, i.m.), followed by anesthesia with 1.5% isoflurane in O2 via an endotracheal tube. 11C-dLop (320 ± 56 MBq in 10 mL) was injected i.v., and PET scans were acquired for 90 or 120 min using the High Resolution Research Tomograph (Siemens, Knoxville, TN). Each scan consisted of 27 or 33 frames of increasing duration, from 30 s to 5 min. P-gp was blocked by DCPQ (8 or 16 mg/kg, i.v.), administered 30 min before 11C-dLop. Eli Lilly provided DCPQ ((2R)-anti-5-{3-[4-(10, 11-dichloromethanodibenzo-suber-5-yl)piperazin-1-yl]-2-hydroxypropoxy}quinoline trihydrochloride, which is a potent inhibitor of P-gp. DCPQ was previously reported as compound 14b (9). Images were reconstructed using a list mode Ordered Subset Expectation Maximization algorithm. Scatter and attenuation correction were applied. All data were decay corrected to the time of radiotracer injection.
Arterial Blood Sampling
In five of six monkeys, arterial blood was sampled from an indwelling catheter in the femoral artery. We obtained 18 blood samples in heparin-treated syringes during the two-hour scan. Plasma 11C-dLop was quantified using radio-chromatography (HPLC; methanol-water-triethylamine (75:25:0.1; by vol.) at 2.0 mL/min) and γ-counting. The plasma concentration of 11C-dLop separated from radiolabeled metabolites was used as the input function for the compartmental analysis. The total concentration of radioactivity in whole blood was used for vascular correction of the PET data, assuming that blood constitutes 5% of brain volume. Free fraction of 11C-dLop in plasma was measured by ultrafiltration, as previously described (11).
Compartmental Analysis
MRI images of each monkey were co-registered to the summed PET image of the entire scan. Eight brain regions were identified on the PET image with reference to the co-registered MRI images. The regions and their volumes (cm3) were: frontal cortex (1.05 ± 0.14), anterior cingulate (0.31 ± 0.11), temporal cortex (0.72 ± 0.10), parietal cortex (1.16 ± 0.06), hippocampus (0.43 ± 0.11), occipital cortex (1.70 ± 0.19), putamen (0.78 ± 0.07), and cerebellum (1.10 ± 0.17). The concentration of radioactivity in each region was expressed as standardized uptake value: %SUV = (% injected activity per cm3 brain) × (g body weight). One- and two-tissue compartment models were applied to calculate the rate constants (K1, k2, k3 and k4) and total distribution volume (VT) (12). Nonlinear parameter fitting was performed using PMOD 2.9 (PMOD Technologies, Zurich, Switzerland). The identifiability of the rate constants were obtained from the diagonal of the covariance matrix and expressed as a percentage of the variable itself.
Cerebral Blood Flow Measurement
To measure cerebral blood flow, four of the six monkeys received 15O-H2O scans. For each monkey, two injections of 15O-H2O (148 MBq each) were administered, and each injection was followed by a one-min acquisition. The water scans began at 30 min prior to each 11C-dLop injection and were separated by 15 min to allow activity to decay. For the P-gp blocked condition, the two water scans began at 15 min after the DCPQ injection. That is, DCPQ was given at 45 min before 11C-dLop. In two of the four monkeys, we also measured radioactivity in continuous arterial blood samples after injecting 15O-H2O. ROIs defined on the coregistered MRI for 11C-dLop image were applied directly to the water image assuming no movement between the 15O-H2O and 11C-dLop scans. Absolute blood flow was calculated using an autoradiographic method (13). With absolute blood flow (F) and K1, we further calculated the extraction fraction (E) using the following equation:
| Eq. (1) |
Where
| Eq. (2) |
and PS is the permeability – surface area product.
Whole Body Dosimetry Study
Four male rhesus monkeys (12.1 ± 2.6 kg) underwent seven whole-body PET scans at baseline and after P-gp blockade with DCPQ (8 mg/kg, i.v.). After i.v. injection of 11C-dLop (333 ± 60 MBq), two-dimensional scans were acquired on the GE Advance tomograph (GE Healthcare, Waukesha, WI) in four segments of the body (head to upper thigh) in frames of increasing duration (75 s to 15 min) for a total scan time of 120 min (22 frames). Tomographic images were compressed from front to back into a single planar image. Regions of interest were drawn over source organs that could be visually identified – namely, brain, lungs, liver, kidneys, and thyroid. Residence times from the monkey were converted into corresponding human values by a scaling factor based on organ and body weights of the two species, as described previously (14). Radiation absorption doses were calculated for a 70-kg adult male using OLINDA/EXM 1.0 (15).
RESULTS
P-gp Inhibition Increased Brain Uptake
Under baseline conditions, the concentration of radioactivity in brain was low (~ 50% SUV) and had low washout (Figs. 1A and 4A). To avoid over-fitting the noise associated with low concentrations of radioactivity, we used only the one-tissue model for compartmental analysis. The resulting values for VT and K1 were small in all brain regions, averaging 3.6 ± 0.6 mL· cm−3 and 0.035 ± 0.010 mL· cm−3·min−1, respectively (average of 8 brain regions from 3 scans in 3 monkeys).
FIGURE 1.

(A) Time-activity curve after injection of 11C-dLop in the temporal cortex fitted with one-tissue (solid) and two-tissue (dash) compartment models at baseline (●) and after P-gp blockade (○) (DCPQ 8 mg/kg, i.v.). Only the one-tissue compartment model was used at baseline because of low brain uptake. All tissue curves were corrected for vascular volume assuming that blood constitutes 5% of brain volume. (B) Plasma parent radiotracer time-activity curve at baseline (●) and after P-gp blockade (○) in a single monkey
FIGURE 4.
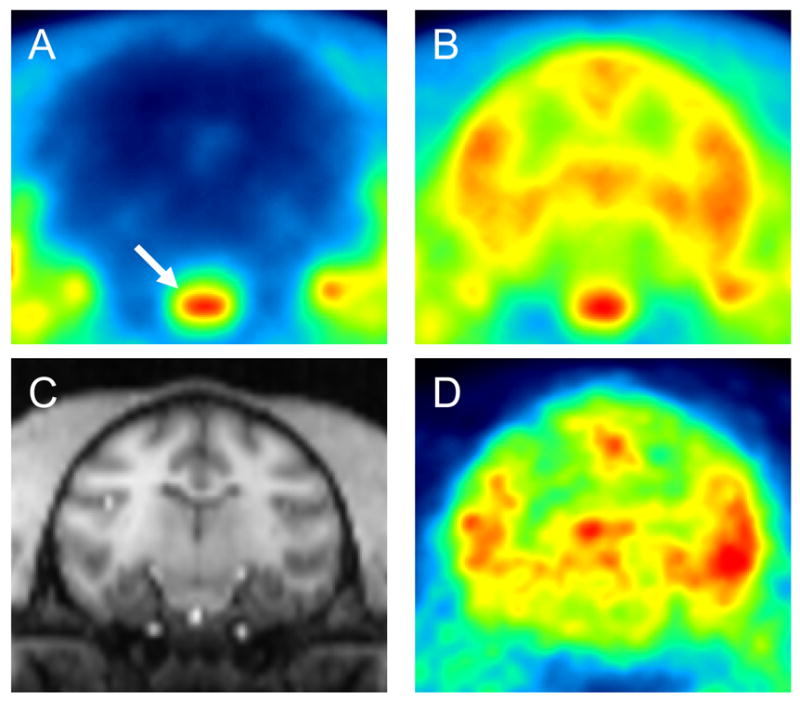
Total summed images (0–120 min) of 11C-dLop at baseline (A) and after P-gp blockade (B). At baseline, all regions of brain except the pituitary (arrow) had very low uptake. (C) MRI scan co-registered with the P-gp blocked image of the same monkey. (D) 15O-H2O scan of the same monkey showing blood flow pattern similar to that after injection of 11C-dLop (B).
After P-gp inhibition by DCPQ (8 mg/kg), radioactivity in brain rapidly increased to a peak of 250% SUV (1A and 4B). However, the washout was still slow, and radioactivity only decreased to 200% SUV at 120 min. The unconstrained two-tissue compartment model provided better fit than the one-tissue compartment model but with only marginal statistical significance (Fig. 1A, F test, p < 0.05). Furthermore, the two-tissue compartment model estimated the kinetic parameters, particularly k3 and k4, with poor identifiability (e.g., > 50%). In contrast, the one-tissue compartment model estimated VT, K1 and k2 with better identifiability (1–5%). Therefore, we chose the one-tissue compartment model for subsequent analyses.
Using the one-tissue compartment model, P-gp blockade increased VT of 11C-dLop by about 5 fold. This increase was primarily due to an increase in K1, since k2 was similar at baseline and after P-gp blockade (Table 1). VT of 11C-dLop remained relatively stable over the 120 min of image acquisition (Fig. 2). For example, VT calculated from 50 min of imaging was within 10% of that calculated from the entire 120 min.
TABLE 1.
One-tissue compartment model: rate constants, distribution volume, and goodness of fit in eight brain regions after P-gp blockade*
| Rate constants
|
Distribution volume
|
Goodness of fit
|
|||
|---|---|---|---|---|---|
| Region | K1 (mL · cm−3 · min−1) (Ident %) | k2 (min−1) (Ident %) | VT (mL · cm−3) (Ident %) | AIC | MSC |
| Frontal cortex | 0.201 ± 0.031 (1.1 ± 0.2) | 0.011 ± 0.004 (2.7 ± 0.7) | 21.1 ± 8.3 (1.9 ± 0.6) | 94 ± 9 | 4.1 ± 0.2 |
| Anterior cingulate | 0.251 ± 0.048 (1.7 ± 0.5) | 0.011 ± 0.004 (3.9 ± 1.5) | 24.2 ± 9.6 (2.8 ± 1.1) | 121 ± 19 | 3.3 ± 0.5 |
| Temporal cortex | 0.250 ± 0.032 (1.1 ± 0.3) | 0.011 ± 0.003 (2.6 ± 0.9) | 24.2 ± 8.7(1.9 ± 0.7) | 96 ± 16 | 4.0 ± 0.4 |
| Pariatal cortex | 0.229 ± 0.036 (1.1 ± 0.2) | 0.011 ± 0.004 (2.4 ± 0.6) | 22.6 ± 9.1 (1.7 ± 0.4) | 93 ± 8 | 4.1 ± 0.1 |
| Hippocampus | 0.236 ± 0.057 (1.9 ± 0.2) | 0.011 ± 0.003 (4.4 ± 1.0) | 22.7 ± 9.3 (3.1 ± 0.9) | 132 ± 7 | 2.8 ± 0.4 |
| Occipital cortex | 0.233 ± 0.035 (1.0 ± 0.2) | 0.012 ± 0.005 (2.2 ± 0.7) | 22.3 ± 9.4 (1.6 ± 0.6) | 86 ± 13 | 4.4 ± 0.4 |
| Putamen | 0.331 ± 0.040 (1.0 ± 0.2) | 0.011 ± 0.004(2.2 ± 0.6) | 31.7 ± 12.4 (1.6 ± 0.5) | 87 ± 10 | 4.4 ± 0.2 |
| Cerebellum | 0.314 ± 0.051 (1.2 ± 0.4) | 0.014 ± 0.004 (2.4 ± 0.9) | 24.2 ± 9.3 (1.8 ± 0.7) | 102 ± 23 | 3.9 ± 0.8 |
P-gp was blocked by DCPQ (8 mg/kg, i.v.) 30 min prior to injection of 11C-dLop
For each brain region, identifiability is listed in parentheses and is expressed as % of the variabe itself.
Values are mean ± SD from four monkeys.
Abbreviations: AIC Akaike Information Criterion; MSC Model Selection Criterion
FIGURE 2.

Time-stability curve of the normalized VT calculated with one-tissue compartment model for frontal cortex (●) and putamen (○), the two brain regions with lowest and highest uptake respectively. Each curve was an average from four monkeys after P-gp blockade (DCPQ 8 mg/kg, i.v.). Error bars represent the identifiability, expressed as a percentage of the variable itself. For each region, VT was calculated with scan durations varying from 20 to 120 min, with 10-min increments. The value of VT was normalized to that determined using the entire 120 min.
Since radioactivity in brain increased quickly and remained relatively stable after P-gp blockade, we evaluated the area under the time-activity curve as a simplified measure of brain uptake that does not require plasma measurements. This simplified analysis essentially assumes that brain uptake is irreversible and quantifies the accumulated uptake. Area under the time-activity curve from 0 to 30 min was linearly and strongly correlated with K1 after P-gp blockade for the eight brain regions in all four monkeys (Fig. 3A, all r > 0.95).
FIGURE 3.

(A) Correlation between rate of brain entry (K1) and area under the time-activity curve of 11C-dLop from 0 to 30 min after P-gp blockade. The area is expressed in units of concentration · time (SUV · min). Data represent eight brain regions from four different monkeys. Correlation coefficients were > 0.99 for all four monkeys. (B) Correlation between relative cerebral blood flow (CBF) and area under the time-activity curve of 11C-dLop from 0 to 30 min after P-gp blockade. Data represented eight brain regions from four different monkeys. CBF was measured as the concentration of radioactivity (%SUV) in each brain region for 1 min after injection of 148 MBq of 15O-H2O.
The increased brain uptake of radioactivity caused by DCPQ was not a secondary, peripheral effect of increased concentration of 11C-dLop in plasma. In fact, the peak concentration and clearance of 11C-dLop from plasma were similar at baseline and after P-gp blockade (Fig. 1B). Furthermore, DCPQ had insignificant effects on the plasma free fraction of 11C-dLop, which were 15.4% ± 1.8% at baseline and 15.8% ± 1.4% after DCPQ in three monkeys (p = 0.85)
Effect of Cerebral Blood Flow
P-gp inhibition increased radioactivity to variable degrees in brain regions but always with the same rank order. For example, P-gp inhibition always increased radioactivity the most in putamen and cerebellum, and least in frontal cortex and hippocampus. We considered two possibilities for this differential uptake of 11C-dLop. One possibility was that P-gp function is not uniformly distributed in brain. A second possibility was that uptake is dependent on regional blood flow, which has reproducible patterns in anesthetized animals. For this second possibility, regions with higher blood flow would have greater uptake of radioactivity. In fact, 11C-dLop uptake, measured using the area under the time-activity curve from 0 to 30 min, correlated linearly with relative blood flow in the eight brain regions in all four monkeys. (Fig. 3B, r = 0.94, p < 0.001). The correlation was also observed visually by the similar distribution of radioactivity in the 15O-H2O and 11C-dLop images (Figs. 4B and 4D).
We corrected brain uptake of 11C-dLop for blood flow after P-gp blockade using a relative method, which compared flow in each region to that in cerebellum. The scatter plot of blood flow vs. 11C-dLop uptake in the eight regions was fitted to a straight line for each monkey (Fig. 5A). A linear correction was then applied to the time-activity curves (Fig. 5B) for 11C-dLop in each region based on blood flow relative to that in the cerebellum. As expected, this correction moved the regional curves together so they were almost overlapping for the initial 25 to 50 min (Fig. 5C). However, the curves began to diverge after about 50 min, suggesting that factors other than blood flow affect the latter portion of the time-activity curve. Nevertheless, these results show that, after correction for relative blood flow, the uptake of 11C-dLop was fairly uniform among these large brain regions, and therefore suggest that the function of P-gp is also fairly uniform in brain.
FIGURE 5.

(A) Correlation of cerebral blood flow and 11C-dLop uptake for eight brain regions in a single monkey after P-gp blockade. Time-activity curves of the eight regions before (B) and after (C) correction for blood based on the fitted straight line in (A). Symbols: FC (frontal cortex), AC (anterior cingulate), TE (temporal cortex), PA (parietal cortex), (HP (hippocampus), OC (occipital cortex), PU (putamen), CE (cerebellum).
Absolute Blood Flow and Extraction Fraction
Since the uptake of 11C-dLop was dependent in part on blood flow, we measured absolute blood flow, which is required to calculate extraction fraction and permeability-surface area product. Among these parameters, the primary effect of P-gp is on permeability (P). That is, P-gp decreases the permeability of drugs that are substrates for this efflux transporter. This primary effect to decrease permeability causes the values of E and K1 to decrease (Equations 1 and 2).
In three of the four monkeys, absolute blood flow was calculated after injection of 15O-H2O by measuring radioactivity in arterial blood and brain. Regional blood flow (mL·cm−3·min−1) was similar at baseline (0.32 to 0.64) and after P-gp blockade (0.37 to 0.95; Table 2). Parietal cortex and putamen had the lowest and highest flow, respectively, under both conditions.
TABLE 2.
Cerebral blood flow and extraction fraction at baseline and after P-gp blockade*
| CBF (mL · cm−3 · min−1)
|
Extraction fraction
|
|||
|---|---|---|---|---|
| Region | Baseline | Blocked | Baseline (n=3) | Blocked (n=5) |
| Frontal cortex | 0.37 ± 0.09 | 0.43 ± 0.17 | 0.09 ± 0.04 | 0.43 ± 0.10 |
| Anterior cingulate | 0.48 ± 0.12 | 0.54 ± 0.20 | 0.06 ± 0.03 | 0.42 ± 0.12 |
| Temporal cortex | 0.46 ± 0.07 | 0.58 ± 0.18 | 0.12 ± 0.03 | 0.40 ± 0.09 |
| Pariatal cortex | 0.32 ± 0.02 | 0.37 ± 0.15 | 0.12 ± 0.06 | 0.57 ± 0.13 |
| Hippocampus | 0.43 ± 0.04 | 0.51 ± 0.15 | 0.12 ± 0.04 | 0.42 ± 0.13 |
| Occipital cortex | 0.31 ± 0.04 | 0.38 ± 0.19 | 0.12 ± 0.06 | 0.58 ± 0.10 |
| Putamen | 0.64 ± 0.07 | 0.95 ± 0.15 | 0.06 ± 0.02 | 0.31 ± 0.10 |
| Cerebellum | 0.61 ± 0.22 | 0.67 ± 0.12 | 0.05 ± 0.02 | 0.42 ± 0.13 |
| Mean | 0.45 | 0.56 | 0.09 | 0.44 |
P-gp was blocked by DCPQ 8 mg/kg (n=4) or 16 mg/kg (n=1), i.v., 30 min prior to injection of 11C-dLop Cerebral blood flow (CBF) is reported as mean ± SD from 3 monkeys
Extraction fraction was calculated using the mean CBF's to the left and averaged across monkeys
We estimated the single pass extraction fraction (E) of 11C-dLop by performing simulations using Equations 1 and 2. The simulated relationship between K1 and F, based on a calculated mean extraction rate (from the 8 regions), fit the observed values for both baseline and P-gp blockade conditions (Fig. 6). The calculated extraction fraction was < 0.09 for all of the eight regions under the baseline condition but increased to between 0.31 and 0.58 after P-gp blockade (Table 2).
FIGURE 6.

Correlation between absolute cerebral blood flow and rate of brain entry (K1) after injection of 11C-dLop at baseline in one animal (▵) and after P-gp blockade in two animals (● and ▴). The symbols represent eight brain regions from each monkey. The curves show the theoretical relationship between CBF and K1 using equations (1) and (2). The theoretical values of K1 were generated using mean permeability and surface product (PS) calculated from CBF and K1 of the eight regions for each study.
DCPQ could theoretically increase brain uptake by blocking P-gp or by increasing blood flow. To assess the latter possibility, we measured cerebral blood flow at baseline and after P-gp blockade. Relative blood flow measured as %SUV did not show significant changes after DCPQ administration. In addition, absolute blood flow increased only 24% after DCPQ (p < 0.01; Table 2). In contrast, extraction increased about five-fold. Thus, the primary effect of DCPQ to increase brain uptake of 11C-dLop was inhibition of P-gp (as measured by increase in extraction) and not the relatively small increase in absolute blood flow.
Whole Body Biodistribution
The brain, lungs, liver, and kidneys were visually identified as organs with moderate to high activities (Fig. 7). The liver had the highest uptake of 11C-dLop with an average peak of 39% injected activity at about 15 min after injection. Lung and kidney also exhibited relatively high uptake of radioactivity with respective peak values of 31% and 11% injected activity at 2 min. Uptake in brain slowly increased during the scan before leveling off at 2% injected activity at about 80 min. P-gp blockade had significant effects only in the brain, which increased from 2% at baseline to 3% injected activity after P-gp blockade.
FIGURE 7.

Maximum intensity projection images after injection of 11C-dLop at baseline (top) and after P-gp blockade (bottom) condition at 1, 5, and 90 min after radiotracer injection.
Human residence times were estimated using average values from the planar images (Supp Table 1). The organs with highest radiation exposure (μSv/MBq) were thyroid (67), kidney (34) and liver (32) (Supp Table 2). P-gp blockade had significant effects only in brain, for which radiation exposure increased from 3 to 5 μSv/MBq. The estimated effective dose (μSv/MBq) for humans was 9.4 and 8.9 at baseline and after P-gp blockade, respectively.
DISCUSSION
The purpose of this study was to evaluate the ability of 11C-dLop to quantify P-gp function at the blood-brain barrier using compartmental modeling. P-gp blockade increased brain uptake of radioactivity about five-fold compared to low uptake at baseline (~ 50% SUV). As predicted from the mechanism of P-gp action, the increased uptake was primarily caused by a ~5 fold increase of entry into brain (K1), with minimal effect on exit from brain (k2). Our results are consistent with the finding that P-gp acts at the vascular endothelium (16) and prevents the entry of substrates into brain. After P-gp blockade, brain uptake was rapid and dependent on blood flow. The effect of cerebral blood flow was corrected with both relative and absolute measurements. With such corrections, brain uptake of 11C-dLop in eight relatively large regions was similar, which suggests that P-gp function is fairly uniformly distributed in brain.
Whole body imaging showed that the radiation exposure of 11C-dLop is modest (~ 9 μSv/MBq), which is consistent with the short half-life of 11C (20.4 min). Finally, P-gp blockade with DCPQ had relatively little effect on the distribution of radioactivity in body, with exception of brain. This result confirmed that the effect of P-gp blockade to increase brain uptake was at the blood-brain barrier and not in the periphery.
Prolonged Retention of 11C-dLop in Brain
After P-gp blockade with DCPQ brain uptake of 11C-dLop was rapid and relatively stable, despite rapidly declining concentrations of radiotracer in plasma. We do not know the reasons for the prolonged retention of radioactivity in brain, but it is unlikely to be due to either radiometabolites or receptor binding. Radiometabolites probably do not accumulate in monkey brain, because rodent studies showed that the vast majority (90%) of radioactivity extracted brain at 30 min was parent radiotracer (10). In addition, we previously reported that the brain uptake of 11C-dLop could not be displaced by the opiate receptor antagonist naloxone or by loperamide itself (10). Thus, the prolonged uptake is not caused by reversible receptor binding. We do not know the reasons for the retention, but ionic trapping is a possibility. That is, intracellular 11C-dLop may be protonated and trapped by positive charge within a vesicle, as occurs with many drugs with pKa in the range of 7 to 8 (17). In fact, the apparent pKa of dLop is 7.3 (10), which would allow ionic trapping in the acidic medium of vesicles such as lysosomes.
Extraction Fraction and Blood Flow
We calculated 11C-dLop to have a single pass extraction in brain of about 40% (Table 2), meaning that about 40% of total 11C-dLop in plasma entered brain during each passage through the capillary bed. This extraction fraction is relatively large and is even larger than the plasma free fraction of 11C-dLop (~ 16%). Therefore, 11C-dLop must dissociate from plasma proteins during the brief (1–2 s) passage through brain capillaries.
The extraction of 11C-dLop after complete P-gp blockade is probably greater than 40%. We previously showed that DCPQ increased brain uptake of 11C-dLop almost linearly in the dose range of 4 to 16 mg/kg (10), with no evidence of a maximal effect. Thus, complete P-gp blockade would increase brain uptake even further, implying that the extraction after complete blockade of P-gp would be > 40%.
The high brain extraction of 11C-dLop and resulting dependence on blood flow have important implications for the capacity of P-gp and the measurement of its function. First, the high extraction (> 40%) confirms both the rapidity and high capacity of P-gp function at the blood-brain barrier. Our results in monkeys are consistent with prior studies in rats that showed the high capacity of P-gp at the blood-brain barrier compared to testes and lymphocytes (18). Second, because of the high extraction of 11C-dLop, regional brain data should be corrected for blood flow to measure the function of P-gp.
Whole Body Dosimetry
In our whole body biodistribution study of 11C-dLop, we found highest uptake of radioactivity in liver, lungs, and kidney. Despite the high uptake in kidney, little radioactivity was excreted via the urine (Fig. 7). Instead, the majority of radioactivity was likely excreted from the liver to gastrointestinal tract. 11C-dLop is demethylated (10) and the resulting one carbon molecule could be exhaled as 11C-CO2. We assessed this possibility by measuring the total radioactivity over the entire field of view (i.e., from head to mid-thigh) over the 120 min of scanning. This measured radioactivity did not decline over time, suggesting that little radioactivity was exhaled during the course of the scan.
The distribution of radioactivity in organs of the body other than the brain is difficult to interpret relative to the know distribution of P-gp (19). For example, since P-gp is known to excrete many drugs via the urine, we predicted the baseline scan would show significant accumulation of radioactivity in urinary bladder and that P-gp blockade would decrease this route of excretion. In fact, under both baseline and blocked conditions, the kidney had high amounts of radioactivity, and the urinary bladder could not even be identified. Brain was the only organ that showed an easily interpreted effect. That is, P-gp blockade increased brain uptake from low levels at baseline to modest levels after P-gp blockade. The corresponding residence times increased from 0.013 h at baseline to 0.021 h after P-gp blockade. This modest 50% increase in radioactivity underestimated that from the kinetic brain studies, because the planar analysis used the compressed whole body images. That is, the uptake at baseline (0.013 h) was artificially high, since the sampled region included muscle and skull anterior and posterior to the brain. In fact, the planar analysis may also explain why we saw no noticeable effect in peripheral organs, like testes, known to express P-gp. That is, tomographic imaging might have shown that P-gp blockade allowed entry of 11C-dLop into some peripheral organs, like testes.
CONCLUSION
We found that 11C-dLop is a promising radiotracer to measure P-gp function at the blood-brain barrier. Brain uptake is low at baseline, consistent with the rapid action and high capacity of P-gp. Pharmacological blockade of P-gp causes about five-fold increase of peak brain activity, which is largely explained by about five-fold increase of brain entry (K1). The single pass extraction of 11C-dLop is high (> 40%) and requires correction for regional blood flow to determine the specific effects of P-gp to block entry of substrates into brain.
Supplementary Material
Acknowledgments
The Intramural Research Program of NIMH supported this research (project # Z01-MH-002795-07). We thank Eli Lilly (Indianapolis, IN) for providing DCPQ; Edward Tuan, Cheryl Morse and Jinsoo Hong for their assistance in this study; the staff of the NIH PET Department for successfully performing the PET studies; and PMOD Technologies (Zurich, Switzerland) for providing its image analysis software. A patent application has been filed on behalf of the US government for PET imaging of P-gp function; Sami S. Zoghbi, Victor W. Pike, Neva Lazarova and Robert B. Innis could personally benefit from this patent.
References
- 1.Ambudkar SV, Dey S, Hrycyna CA, Ramachandra M, Pastan I, Gottesman MM. Biochemical, cellular, and pharmacological aspects of the multidrug tranporter. Annu Rev Pharmacol Toxicol. 1999;39:361–398. doi: 10.1146/annurev.pharmtox.39.1.361. [DOI] [PubMed] [Google Scholar]
- 2.Siddiqui A, Kerb R, Weale ME, et al. Association of multidrug resistance in epilepsy with a polymorphism in the drug-transporter gene ABCB1. N Engl J Med. 2003;348:1442–1448. doi: 10.1056/NEJMoa021986. [DOI] [PubMed] [Google Scholar]
- 3.Cirrito JR, Deane R, Fagan AM, et al. P-glycoprotein deficiency at the blood-brain barrier increases amyloid-beta deposition in an Alzheimer disease mouse model. J Clin Invest. 2005;115:3285–3290. doi: 10.1172/JCI25247. [DOI] [PMC free article] [PubMed] [Google Scholar]
- 4.Kortekaas R, Leenders KL, van Oostrom JC, et al. Blood-brain barrier dysfunction in parkinsonian midbrain in vivo. Ann Neurol. 2005;57:176–179. doi: 10.1002/ana.20369. [DOI] [PubMed] [Google Scholar]
- 5.Bigott HM, Prior JL, Piwnica-Worms DR, Welch MJ. Imaging multidrug resistance P-glycoprotein transport function using microPET with technetium-94m-sestamibi. Mol Imaging. 2005;4:30–39. doi: 10.1162/15353500200504166. [DOI] [PubMed] [Google Scholar]
- 6.Takano A, Kusuhara H, Suhara T, et al. Evaluation of in vivo P-glycoprotein function at the blood-brain barrier among MDR1 gene polymorphisms by using 11C-verapamil. J Nucl Med. 2006;47:1427–1433. [PubMed] [Google Scholar]
- 7.Lubberink M, Luurtsema G, van Berckel BN, et al. Evaluation of tracer kinetic models for quantification of P-glycoprotein function using (R)-[11C]verapamil and PET. J Cereb Blood Flow Metab. 2007;27:424–433. doi: 10.1038/sj.jcbfm.9600349. [DOI] [PubMed] [Google Scholar]
- 8.Sadeque AJ, Wandel C, He H, Shah S, Wood AJ. Increased drug delivery to the brain by P-glycoprotein inhibition. Clin Pharmacol Ther. 2000;68:231–237. doi: 10.1067/mcp.2000.109156. [DOI] [PubMed] [Google Scholar]
- 9.Zoghbi SS, Liow JS, Yasuno F, et al. 11C-loperamide and its N-desmethyl radiometabolite are avid substrates for brain permeability-glycoprotein efflux. J Nucl Med. 2008;49:649–656. doi: 10.2967/jnumed.107.047308. [DOI] [PubMed] [Google Scholar]
- 10.Lazarova N, Zoghbi S, Jinsoo H, et al. Synthesis and evaluation of [N-methyl-11C]N-Desmethyl-loperamide as a new and improved PET radiotracer for Imaging P-gp function. J Med Chem. 2008 doi: 10.1021/jm800510m. In Press. [DOI] [PMC free article] [PubMed] [Google Scholar]
- 11.Gandelman MS, Baldwin RM, Zoghbi SS, Zea-Ponce Y, Innis RB. Evaluation of ultrafiltration for the free-fraction determination of single photon emission computed tomography (SPECT) radiotracers: beta-CIT, IBF, and iomazenil. J Pharm Sci. 1994;83:1014–1019. doi: 10.1002/jps.2600830718. [DOI] [PubMed] [Google Scholar]
- 12.Innis RB, Cunningham VJ, Delforge J, et al. Consensus nomenclature for in vivo imaging of reversibly binding radioligands. J Cereb Blood Flow Metab. 2007;27:1533–1539. doi: 10.1038/sj.jcbfm.9600493. [DOI] [PubMed] [Google Scholar]
- 13.Herscovitch P, Markham J, Raichle ME. Brain blood flow measured with intravenous H215O. I. Theory and error analysis. J Nucl Med. 1983;24:782–789. [PubMed] [Google Scholar]
- 14.Seneca N, Cai L, Liow JS, et al. Brain and whole-body imaging in nonhuman primates with [11C]MeS-IMPY, a candidate radioligand for beta-amyloid plaques. Nucl Med Biol. 2007;34:681–689. doi: 10.1016/j.nucmedbio.2007.06.002. [DOI] [PubMed] [Google Scholar]
- 15.Stabin MG, Sparks RB, Crowe E. OLINDA/EXM: the second-generation personal computer software for internal dose assessment in nuclear medicine. J Nucl Med. 2005;46:1023–1027. [PubMed] [Google Scholar]
- 16.Stewart PA, Beliveau R, Rogers KA. Cellular localization of P-glycoprotein in brain versus gonadal capillaries. J Histochem Cytochem. 1996;44:679–85. doi: 10.1177/44.7.8675989. [DOI] [PubMed] [Google Scholar]
- 17.al-Jaufy AY, King SR, Jackson MP. Purification and characterization of a Shiga toxin A subunit-CD4 fusion protein cytotoxic to human immunodeficiency virus-infected cells. Infect Immun. 1995;63:3073–3078. doi: 10.1128/iai.63.8.3073-3078.1995. [DOI] [PMC free article] [PubMed] [Google Scholar]
- 18.Choo EF, Kurnik D, Muszkat M, et al. Differential in vivo sensitivity to inhibition of P-glycoprotein located in lymphocytes, testes, and the blood-brain barrier. J Pharmacol Exp Ther. 2006;317:1012–1018. doi: 10.1124/jpet.105.099648. [DOI] [PubMed] [Google Scholar]
- 19.Fojo AT, Ueda K, Slamon DJ, Poplack DG, Gottesman MM, Pastan I. Expression of a multidrug-resistance gene in human tumors and tissues. Proc Natl Acad Sci U S A. 1987;84:265–269. doi: 10.1073/pnas.84.1.265. [DOI] [PMC free article] [PubMed] [Google Scholar]
Associated Data
This section collects any data citations, data availability statements, or supplementary materials included in this article.