Abstract
We studied the signaling pathways coupling gonadotropin-releasing hormone (GnRH) secretion to elevations in cAMP levels in the GT1 GnRH-secreting neuronal cell line. We hypothesized that increased cAMP could be acting directly by means of cyclic nucleotide-gated (CNG) cation channels or indirectly by means of activation of cAMP-dependent protein kinase (PKA). We showed that GT1 cells express the three CNG subunits present in olfactory neurons (CNG2, -4.3, and -5) and exhibit functional cAMP-gated cation channels. Activation of PKA does not appear to be necessary for the stimulation of GnRH release by increased levels of cAMP. In fact, pharmacological inhibition of PKA activity caused an increase in the basal secretion of GnRH. Consistent with this observation activation PKA inhibited adenylyl cyclase activity, presumably by inhibiting adenylyl cyclase V expressed in the cells. Therefore, the stimulation of GnRH release by elevations in cAMP appears to be the result of depolarization of the neurons initiated by increased cation conductance by cAMP-gated cation channels. Activation of PKA may constitute a negative-feedback mechanisms for lowering cAMP levels. We hypothesize that these mechanisms could result in oscillations in cAMP levels, providing a biochemical basis for timing the pulsatile release of GnRH.
Gonadotropin-releasing hormone (GnRH) secretion is controlled by a variety of regulatory mechanisms intrinsic to individual neurons or networks of GnRH-secreting neurons and by extrinsic regulatory mechanisms regulated by neurotransmitters released by efferent inputs to GnRH neurons. The development of the highly differentiated GT1 GnRH-secreting neuronal cell lines has provided a model to study the signaling mechanisms involved in the complex regulation of GnRH secretion (1). The GT1 cell lines were established from a hypothalamic tumor induced by genetic targeting of the expression of the oncogene encoding simian virus 40 T antigen to GnRH neurons in a transgenic mouse. The cells are highly differentiated and express and process GnRH at high levels (1, 2). The pulsatile release of GnRH appears to be an intrinsic property of individual or networks of GnRH neurons, since cultures of the GT1 cells release GnRH with a pulse frequency identical to that seen in castrate rodents (3–5). In vivo numerous efferent inputs to GnRH neurons release neurotransmitters that stimulate GnRH secretion (6). Neurotransmitters stimulating GnRH release from GT1 cells include bradykinin, dopamine (DA), endothelin, glutamate, neuropeptide Y, and norepinephrine (NE) (7–12).
The current study is focused on the role of the cAMP signaling pathway in the regulation of GnRH secretion from GT1 cells. GT1 cells express both D1-DA receptors (8) and β1-adrenergic receptors (12) which are positively coupled to adenylyl cyclase (AC). Treatment of GT1 cells with DA or NE increased intracellular cAMP levels and stimulated GnRH secretion in a dose-dependent fashion (8, 12). The GnRH-releasing effects of DA and NE were mimicked by pharmacologically increasing the intracellular cAMP level with 8-Br-cAMP or forskolin treatment (13). The level of secretion of GnRH was proportional to the activation of AC and increases in cAMP levels. These data are all consistent with the hypothesis that the stimulation of AC results in the increased formation of cAMP, activating the signaling cascade responsible for stimulation of GnRH release.
Several studies have shown that depolarization followed by the influx of extracellular Ca2+ via voltage-dependent Ca2+ channels is essential for the stimulation of GnRH secretion from GT1 cells (5, 13, 14). Stimulation of GnRH secretion from GT1 cells by NE was correlated with depolarization of the cells and the influx of extracellular Ca2+ (15). We asked how the increase in cAMP levels would result in depolarization and stimulation of GnRH secretion from GT1 cells. We hypothesized that cAMP could act directly to initiate GnRH secretion, or indirectly by activation of cAMP-dependent protein kinase (PKA). cAMP could act directly by the opening of cAMP-gated cation channels. GnRH neurons develop from the olfactory placode, the anlagen that also contributes the olfactory neurons (16, 17). Since olfactory neurons express cAMP-gated cation channels, which play a key role in depolarization of the neurons by odorants (18), we reasoned that the channels may also be expressed by GnRH neurons. Second, increases in cAMP could activate PKA and phosphorylation of downstream signaling molecules—e.g., phosphorylation of cardiac voltage-dependent Ca2+ channel by PKA resulted in increased Ca2+ channel activity (19).
We have shown that GT1 cells express the three cyclic nucleotide-gated (CNG) subunits present in olfactory neurons (CNG2, -4.3, and -5) (20–22) and have functional cAMP-gated cation channels. Second, pharmacological blockade of PKA activity does not inhibit cAMP-induced stimulation of GnRH, but conversely increases basal GnRH release. GT1 cells express AC V, which is inactivated by phosphorylation by PKA. We hypothesize that activation of cAMP-gated cation channels results in an increase in the excitability of GT1 cells, resulting in the stimulation of GnRH secretion. On the other hand, activation of PKA may decrease cAMP formation, thereby constituting a negative-feedback mechanism for GnRH secretion. These signaling pathways represent potential timing mechanisms for the pulsatile release of GnRH.
Methods
Cell Culture of GT1 Cells.
GT1–1 or GT1–7 cell lines were cultured in Dulbecco's modified Eagle's medium (DMEM) with 10% fetal bovine serum and penicillin/streptomycin. The cultures were maintained at 37°C in a water-saturated atmosphere of 95% O2 and 5% CO2. Cells were cultured until they reached 50–70% confluency. For experiments measuring GnRH or cAMP release the medium was replaced by a defined medium (Opti-MEM; GIBCO/BRL) without serum for 1–2 days. For static culture experiments, GT1–1 cells cultured in 24-well plates were incubated for 15–30 min in Locke's medium with drug or vehicle. Media was collected and stored at −20°C for RIA of GnRH and cAMP (12). cAMP was extracted from cell cultures by freeze–thawing, sonication, and incubation at 4°C for 48 h with 0.1 M HCl. For measuring the minute-to-minute release of GnRH and cAMP, GT1–1 cells plated on 25-mm plastic coverslips coated with Matrigel were perifused in Sykes–Moore chambers (3). Chambers consisting of two cell-coated coverslips were perifused with Locke's medium at a flow rate of 0.15 ml/min. After a 60-min equilibration period, the test drug was added to the medium, and samples were collected every 4 min for 60 min for RIA.
Expression of cAMP-Gated Cation Channels and AC Subtypes.
Total RNA was extracted from GT1–1 and GT1–7 cells and selected control tissues from mice and subjected to reverse transcription–PCR analysis (RT-PCR) using specific primers for CNG2, -4.3, and -5 and AC subtypes. The resulting PCR products were separated on 8% polyacrylamide gels, and fragments of interest were isolated and subcloned into a pKS Superscript vector (Stratagene) or pcRII1 vector (Invitrogen) and sequenced by using the dideoxynucleotide method, and the sequence was analyzed by a blast search (23). For analysis of expression of the CNG2 channel (originally termed OCNC1) in GT1 cells, primers to a conserved region of the rat CNG2 gene were used (20). The (+) and (−) primers were 5′-CATCAACATCAAAGGGAACA-3′ and 5′-CCTCAGCATTCACATCCAAC-3′. Primers to the C-terminal conserved region of rCNG5 (originally termed rOCNC2), corresponding to the cAMP-binding domain, were used to determine whether the CNG5 was expressed (22). The (+) and (−) primers were 5′-GTCATCATCCACTGGAATGCTTG-3′ and 5′-GGGCAAGTTGGCAGTGGTAGCTGATGAT-3′. The (+) and (−) primers for the rCNG4.1 and CNG4.3 (also termed CNCβ1a and CNGβ1b) subunits consisted of 5′-CTCTACTTGAAACTTGGCGTGAAC-3′ and 5′-AATCATCACAGAGAAAGC-3′ (21). The (+) and (−) primers specific for the CNG4.3 splice variant were 5′-GGCCTGAACATGGAGCTGAAT-3′ and 5′- CGACGGATGGAGCTCCTGAT-3′. For analysis of the AC subtypes, primers were used that amplify a conserved region in the C terminus and detected subtypes I–VI in bovine tissue (24). The (+) and (−) primers are 5′-GCTCAGACCATCGGTAGCACCTACATGGC-3′ and 5′-GCGAATTCACTGTATTICCCCAGATCTCATA-3′.
Electrophysiological Recordings.
Patch clamp experiments were performed on GT1–1 and GT1–7 cells in the on-cell and excised patch configurations (25). Pipettes were constructed from Corning 7740 borosilicate tubing (outside diameter 1.5 mm) (WPI; Sarasota, FL) and had a resistance of between 3 and 5 MΩ. Recordings were made after obtaining seals greater then 1 GΩ (in the on-cell mode, the patch was then excised and used if the seal remained greater then 1 GΩ). Symmetrical pipette and bath solutions were used and consisted of 134 mM NaCl, 2.8 mM KCl, 2 mM MgCl2, 2 mM CaCl2, 6 mM glucose, and 10 mM Hepes, pH 7.2. A low-chloride recording solution was also used that consisted of 134 mM sodium methanesulfonate (NaMes), 5 mM NaCl, 6 mM glucose, and 10 mM Hepes, pH 7.2.
Intact Cell Phosphorylation.
The intracellular ATP pools of GT1 cells were labeled by incubating cultured cells in phosphate-free Locke's medium for 2 h before a 2-h incubation in Locke's medium with 0.15 mCi/ml [32P]Pi. The cells were treated with 10 μM H-89 (Calbiochem), a specific PKA inhibitor, dissolved in DMSO or with DMSO alone for 30 min and with 10 μM forskolin for the final 10 min. Drug treatment was terminated by rinsing in ice-cold PBS and extracting in 10 mM NaPi at pH 7.2, 150 mM NaCl, 1% Nonidet P-40, 1% deoxycholate, 0.1% SDS, 1 mM EGTA, 50 mM NaF, and 1 mM Pefabloc (Boehringer Mannheim). Labeled proteins were separated by SDS/PAGE and analyzed by autoradiography.
AC Assays.
To prepare membranes GT1 cells were suspended in 250 mM sucrose/20 mM Tris⋅HCl, pH 7.5/1.5 mM MgCl2/1 μM leupeptin/10 μM Pefabloc and lysed by nitrogen cavitation (26). EGTA (100 mM, 1/80 vol) was added to the lysate before centrifugation for 10 min at 900 × g. The supernatant was centrifuged for 30 min at 47,800 × g, and the membrane pellet was resuspended and homogenized in 20 mM Tris⋅HCl, pH 7.5/1 mM EDTA/1 mM DTT/4 μg/ml aprotinin. Membranes were incubated in AC buffer consisting of 50 mM Tris⋅HCl at pH 8, 1 mM EDTA, 2.5 mM MgCl2, 2 mM 2-mercaptoethanol, 1 μg/ml BSA, 10 mM creatine phosphate, 100 units/ml creatine kinase, 0.1 mM ATP, 20 μM GTP, and, when indicated, 50 nM of recombinant PKA catalytic subunit for 10 min at 25°C. Aliquots of the preincubation mixture were incubated in a final volume of 50 μl for 15 min at 30°C in 1 mM cAMP/0.4 mM ATP/0.1 mM GTP/0.1 μCi of [3H]cAMP (25–40 Ci/mmol; 1 Ci = 37 GBq)/4 μCi of [α-32P]ATP (3,000 Ci/mmol), and, where indicated, 10 μM DA or 100 μM forskolin. The reactions were terminated by the addition of 450 μl of 0.5% SDS, 1 mM cAMP, and 1 mM ATP. cAMP was purified by using Dowex and alumina chromatography, and the recovery of cAMP was corrected for by the recovery of the [3H]cAMP. Inhibition of AC activity by PKA was analyzed under each treatment condition for the three experiments by using paired two-tailed Student's t test with Bonferonni's corrections for multiple comparisons.
Results
cAMP Regulation of GnRH Secretion.
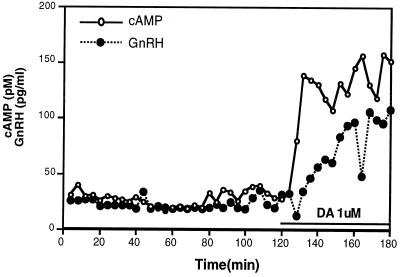
We previously showed that GT1 cells expressed D1-DA receptors that were positively coupled to AC (8) and that increases in cAMP levels resulted in the secretion of GnRH (13). Since intracellular cAMP is rapidly exported out of a variety of cells (27), we asked whether we could simultaneously follow dynamic changes in GnRH and cAMP. Treatment of perifused GT1 cells with DA (1 μM) caused a 50% increase in cAMP levels in the first sample obtained (4 min), and the cAMP levels reached a maximum by 8 min and remained elevated for the duration of the sampling period (60 min; Fig. 1). This rapid rise in cAMP levels in the media was similar to the profile of the accumulation of intracellular cAMP in GT1 cells after treatment with DA (8). Addition of DA also stimulated GnRH secretion, although GnRH release was significantly delayed, with no increase seen until 12 min after drug administration. The maximum increase in GnRH did not occur until 30 min (similar results were obtained in a second experiment). We then asked what signaling pathways were involved in the coupling of the increase in cAMP levels to the secretion of GnRH.
Figure 1.
Effect of DA on simultaneous release of GnRH and cAMP from GT1 cells. GT1 cell-coated coverslips were perifused with Locke's medium and samples were collected every 4 min after a 1-h equilibration period. DA (1 μM) was added to the perifused medium for the second hour of collection. RIA was used to measure both cAMP and GnRH in the samples.
Expression of CNG Channel Genes.
We hypothesized that cAMP might stimulate GnRH secretion via cAMP-gated cation channels. The cAMP-gated cation channel in olfactory neurons appears to consist of three subunits, CNG2, -4.3, and -5 (20–22). Specific primers for RT-PCR studies were designed from published sequences of the channel cDNAs. Primers for CNG2 yielded the expected 662-bp fragment. The nucleotide sequence was 99% identical and the amino acid sequence was 100% identical to the sequences of the rCNG2 channel (20). Primers to rCNG5 yielded the expected 197-bp fragment. The nucleotide sequence was greater than 94% identical and the amino acid sequence was 100% identical to that for rCNG5 (22). Primers that did not discriminate between CNG4.1 and -4.3 yielded the predicted fragment of 378 bp, and the nucleotide sequence was 93% identical and the amino acid sequence 100% identical to the published sequences for rCNG4.3 (21). With primers to a unique N-terminal region of CNG4.3 a 204-bp fragment was obtained, which when digested with ApaI yielded the expected 53- and 151-bp fragments. Coexpression of all three subunits appears to be necessary to reconstitute CNG channels most closely resembling the native channels in olfactory neurons (28).
Functional cAMP-Gated Cation Channels.
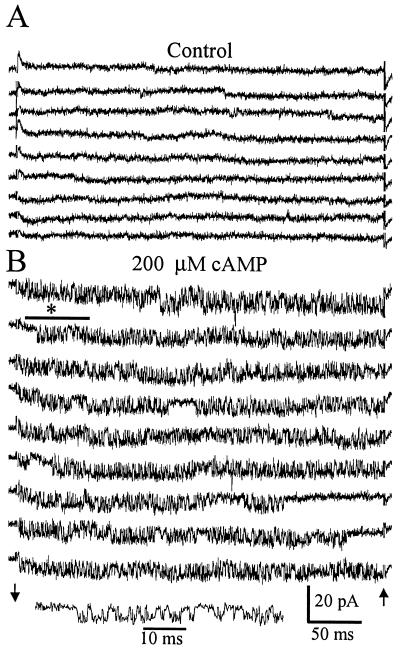
Since the three olfactory CNG subunits were expressed in GT1 cells, we determined whether functional CNG channels were present by using the patch clamp technique. Fig. 2 shows single-channel recordings of a cAMP-activated channel obtained in GT1–1 cells. Fig. 2A is a recording from an excised patch before the addition of cAMP. Square current transitions are present but there are no bursts of rapid transitions between the open and closed states. This is typical of a patch containing cAMP-activated channels in the absence of added cAMP. Fig. 2B is the same patch after the addition of 200 μM cAMP to the solution bathing the cytoplasmic face of the membrane. Channel activity is increased and rapid open-closed transitions are frequent, the so-called flickering activity characteristic of CNG channels. The channel is cationic; currents had the same unitary amplitude in low-Cl− recording solutions as in normal solutions. Currents activated by cAMP had similar amplitude and kinetics in solutions containing NaMes and KMes, indicating approximately equal sensitivity for Na+ or K+. The conductance for the channel is approximately 60 pS. Similar cAMP-activated channel activity was observed in 12 patches from GT1–1 cells and 4 patches from GT1–7 cells. Approximately 50% of the patches that were excised did not contain cAMP-activated channels; the slow infrequent transitions were absent before cAMP addition, and no fast channel transitions were seen after cAMP addition.
Figure 2.
Activation of a cAMP-gated cation channel in an excised patch from a GT1 neuron. (A) Consecutive sweeps in the absence of cAMP show a low level of spontaneous channel activity. Channel openings are seen as downward deflections. (B) Consecutive sweeps beginning 45 s after the addition of 200 μM cAMP to the solution bathing the cytoplasmic face of the membrane. An increase in the open probability of the channel is seen as well as distinctive rapid transitions between the open and closed states. Channel activity marked by the bar and asterisk is plotted with an expanded time scale to show the detail. Recordings were performed with 140 mM NaCl solutions in the bath and pipette. Arrows indicate the beginning and end of the −120-mV pulse delivered to the pipette. Capacitance transients were blanked at the arrows.
The electrophysiological properties of the cAMP-gated channels in GT1–1 cells are similar to those reported for olfactory neurons or cells expressing the subunits expressed in the neurons (22, 28, 29). GT1 neurons exhibit spontaneous action potentials leading to oscillations in intracellular Ca2+ concentration ([Ca2+]i) and propagated intercellular Ca2+ waves (14) (25). Increasing the concentration of cAMP increases the frequency of the [Ca2+]i oscillations (A.C.C., R.I.W., and J.L.C., unpublished data). The cAMP-gated channel could provide a driving force for increasing the frequency of this spontaneous activity. Na+ entry into the cell through the channel at the resting membrane potential could result in depolarization initiating Ca2+ entry through L-type voltage-gated Ca2+ channels.
PKA Regulation of GnRH Secretion.
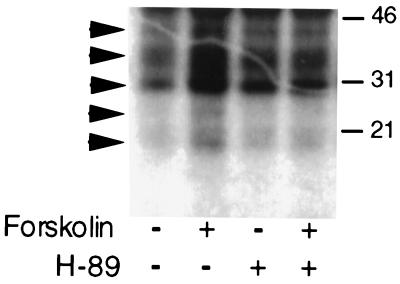
To determine whether activation of PKA was also involved in mediating the stimulation of GnRH secretion by elevated cAMP levels, we treated GT1 cells with the specific PKA inhibitor H-89 before increasing cAMP levels. Treatment with 10 μM H-89 was sufficient to block forskolin-induced phosphorylation of proteins in GT1–1 cells metabolically labeled with [32P]orthophosphate. Treatment with 10 μM forskolin resulted in the appearance of five phosphorylated bands (arrows) on SDS/PAGE gels, which was substantially blocked by pretreatment with H-89 (Fig. 3).
Figure 3.
Inhibition of forskolin-induced phosphorylation of proteins by treatment with 10 μM H-89. GT1–1 cells were metabolically labeled with [32P]orthophosphate for 2 h before addition of the drugs. Autoradiographic analysis of an SDS/PAGE gel showed five forskolin-induced phosphorylated protein bands (arrows) that were blocked by H-89 treatment. Gel mobilities for 46-, 31-, and 21-kDa standards are shown on the right.
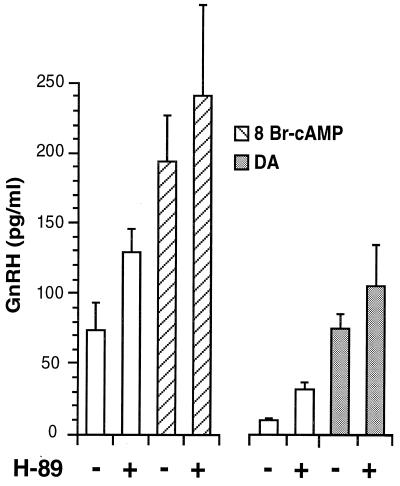
Surprisingly, treatment of GT1–1 cells in static culture with 10 μM H-89 did not block the ability of DA or 8-Br-cAMP to stimulate GnRH secretion (Fig. 4). Furthermore, in both experiments treatment with H-89 alone stimulated basal GnRH release. Stimulation of basal GnRH secretion was shown in separate experiments to be dose-dependent for concentrations of H-89 between 10 and 25 μM (data not shown). Therefore, activation of PKA was not necessary for the cAMP-induced stimulation of GnRH release. Furthermore, the observation that a PKA inhibitor stimulated basal GnRH secretion suggested that activation of PKA was involved in suppressing GnRH release.
Figure 4.
Effect of blockade of PKA activity on GnRH release. Treatment with H-89 (10 μM) had no effect on stimulation of GnRH release by addition of 8-Br-cAMP (1 mM) and DA (1 μM) to GT1 cells. However, in both experiments treatment with H-89 alone stimulated basal GnRH release. Each point represents the mean ± SE of six wells.
PKA Regulation of cAMP Formation.
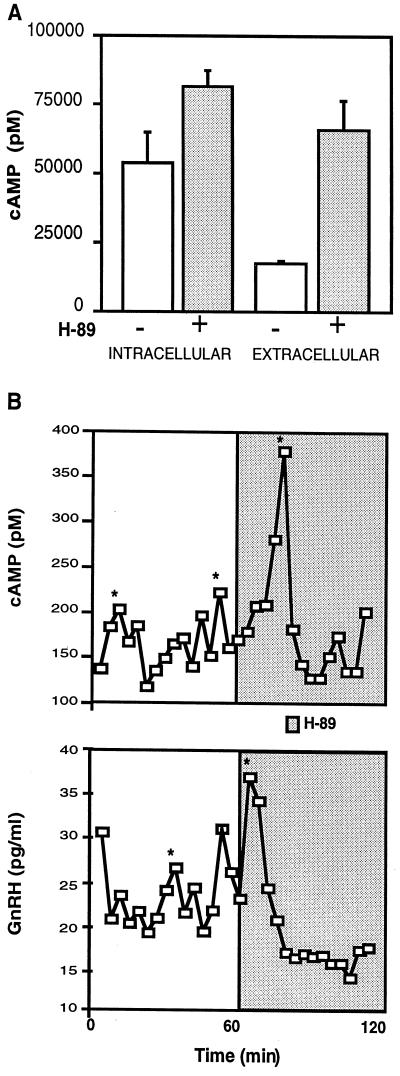
We hypothesized that PKA might lower GnRH secretion by lowering cAMP levels. Consistent with this idea, incubation of GT1 cells in static culture with H-89 for 15 min stimulated cAMP release into the medium (Fig. 5A). A small insignificant increase was also seen in intracellular cAMP levels. In perifused GT1–1 cells treatment with H-89 stimulated the release of large amplitude pulses in cAMP and GnRH as determined by the cluster analysis algorithm (Fig. 5B) (30). These findings strongly support the hypothesis that increased PKA activity is inversely correlated with the extracellular level of cAMP. These experiments provide an additional correlation between elevated cAMP levels and increased GnRH release.
Figure 5.
Effect of blockade of PKA activity on cAMP levels in static culture (A) and perifusion (B). (A) Treatment of GT1–1 cells with 10 μM H-89 for 15 min in static culture resulted in an 3-fold increase in cAMP released into the medium, whereas a small but not significant increase was observed in intracellular cAMP levels. Values are the mean ± SE of six wells. (B) In perifusion, the addition of H-89 resulted in the rapid and simultaneous release of GnRH (Lower) and cAMP (Upper) into the conditioned media. Samples were collected every 4 min. *, Significant pulse detected by the cluster analysis algorithm (30). Similar results were obtained in a second experiment.
Expression of AC Isoforms in GT1 Cells.
The activity of two related subtypes of AC, V and VI, was shown to be inhibited after phosphorylation by PKA (31). Therefore, we determined which AC subtypes were expressed by GT1 cells by RT-PCR analysis. With the primers used, the expected amplified fragments for AC subtypes were AC I and II = 263; AC IV = 270, AC III = 300, and AC V and AC VI = 254 (24). PCR products of 254 bp and 270 bp were obtained from GT1 cells, with the 254-bp product being more abundant. By restriction analysis the 254-bp band was identified as AC V and/or AC VI. Partial digestion of the band was observed with RsaI, which is specific for AC V, and HaeII, which is specific for AC VI. The 270-bp fragment was cut by AvaII, consistent with the presence of an AC IV transcript. The 254-bp band was subcloned, and the sequence was found by blast analysis to be 80% identical to the published sequence for the rat AC V cDNA (32). Therefore, activation of PKA could decrease cAMP levels by inhibiting AC V activity.
PKA Inhibition of AC Activity.
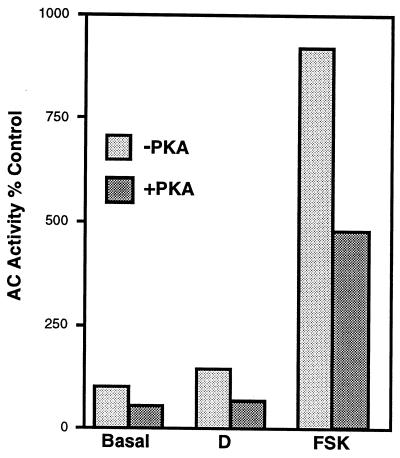
To directly determine whether GT1 cells expressed PKA-regulated AC activity, plasma membranes were isolated and preincubated with recombinant catalytic subunit of PKA. The catalytic subunit in the absence of the regulatory subunit is constitutively active. Membranes were then incubated with [α-32P]ATP to determine the rate of formation of cAMP. Pretreatment with the catalytic subunit of PKA resulted in a decrease of the rate of formation of cAMP under basal conditions, or after stimulation with DA or forskolin (Fig. 6). The mean percent inhibitions for three independent experiments were 20%, 44%, and 35%, respectively (P < 0.05 for each of the three conditions). The ability of increased PKA activity to inhibit AC activity is in close agreement with the observations that GT1 cells express AC V and possibly AC VI.
Figure 6.
Inhibition of basal and DA- (10 μM) or forskolin- (FSK, 100 μM) stimulated AC activity by PKA. GT1 cell membranes were preincubated with 50 nM of the catalytic subunit of PKA for 10 min and the rate of formation of [32P]cAMP was determined. Values are the mean of duplicates from a single experiment. Similar results were obtained in two additional experiments.
Discussion
The coupling between the elevation of intracellular cAMP levels in GT1 cells and the release of GnRH has been clearly established. Elevating cAMP levels in GT1 cells pharmacologically with 8-Br-cAMP or forskolin, or by activating D1-DA or β1-adrenergic receptors stimulated GnRH release (8, 12, 13). In this study, treatment with DA resulted in the rapid release of cAMP from GT1–1 cells, with elevations in GnRH lagging behind by approximately 5–10 min. The rapid increase in extracellular cAMP correlated closely with earlier measurements of intracellular cAMP in cells pretreated with a phosphodiesterase (PDE) inhibitor (8). The transport of cAMP out of the cells permitted the assessment of the dynamics of the changes in cAMP levels. The large (10-fold) elevations in cAMP levels observed in the medium are much greater than the less than doubling seen with intracellular cAMP. Only in the presence of PDE inhibitors are manyfold increases in intracellular cAMP observed (8). These findings imply that cAMP within the whole cell is rapidly hydrolyzed by PDE. However, a pool of cAMP, apparently close to the plasma membrane and AC, can be significantly elevated and transported from the cell. An additional hypothesis is that AC may be directly involved in the transport of cAMP. The topographical resemblance of AC to plasma membrane transporters led to the speculation that it may transport cAMP (33).
In many cells types, including corticotropes stimulated by corticotropin (ACTH) (34) and renal epithelial cells stimulated by vasopressin (27), it has been shown that elevations in intracellular cAMP levels are mirrored by changes in extracellular cAMP. In renal epithelial cells it was shown that cAMP is actively transported out of the cells by a probenecid-sensitive mechanism (27). The significance of the movement of cAMP out of the GT1 cells is unclear. Extracellular cAMP released from Dictyostelium acts on receptors on the outside of the cell (35); however, to date no one has described cAMP receptors on the extracellular membrane of mammalian cells.
We then asked what the mechanism was by which increases in cAMP are coupled to the secretion of GnRH. We have shown that GT1 cells express the CNG2, -4.3, and -5 subunits of the cAMP-gated cation channel. Functional cAMP-gated channels are present in high numbers in inside-out membrane patches of GT1–1 cells. Although these channels are permeable to both Na+ and K+, there would be a depolarizing influx of Na+ into the cell at physiologic membrane potentials; i.e., the resting potential is near the equilibrium potential for K+ and far from the equilibrium potential for Na+. The depolarizing influx of Na+ would lead to increased excitability of GT1 cells, and in turn an increase in GnRH release.
GT1 cells show spontaneous activity characterized by oscillations in membrane potential, bursts of action potentials, and oscillatory increases in [Ca2+]i that are generated by the influx of Ca2+ through voltage-gated Ca2+ channels (14, 25). Consistent with the idea that elevated cAMP levels would increase the depolarizing drive of GT1 cells are the observations that increased cAMP levels dramatically increase the frequency of Ca2+ oscillations (A.C.C., R.I.W., and J.L.C., unpublished data), and the secretion of GnRH (8, 12). Strongly supporting the role of CNG channels in the cAMP-induced stimulation of Ca2+ oscillations is the recent observation that this effect is blocked by pretreatment with the CNG channel blocker l[d]-cis-diltiazem (A.C.C., R.I.W., and J.L.C., unpublished data).
The activation of PKA is clearly not involved in mediating the stimulation of GnRH secretion by elevated levels of cAMP. Similarly, the cAMP-induced increase in Ca2+ oscillations was not blocked with H-9, another inhibitor of PKA (A.C.C., R.I.W., and J.L.C., unpublished data). The unexpected result that treatment with H-89, a PKA inhibitor, increased release of both cAMP and GnRH is consistent with the hypothesis that activation of PKA decreases cAMP levels in a negative-feedback fashion. In perifusion studies the inhibition of PKA resulted in the rapid elevation of cAMP release. The stimulation of cAMP release was synchronous with the release of GnRH. We showed that one way in which PKA activation leads to a decrease in cAMP levels is by inhibiting the formation of cAMP by AC. GT1 cells express AC V and possibly AC VI, both of which have been shown to be inhibited after phosphorylation by PKA (31). If AC is involved in the transport of cAMP, possibly phosphorylation by PKA might also inhibit this function.
Another potential mechanism controlling the intracellular level of cAMP is its hydrolysis by PDE. We showed that PDE activity also plays an important modulatory role in regulating cAMP levels and GnRH secretion in GT1 cells (36). GT1 cells express three PDE subtypes: the calmodulin-dependent PDE1B and the cAMP-specific PDE4B and PDE4D. Pharmacological inhibition of PDE4 activity increases cAMP levels and stimulates GnRH secretion. Interestingly, the cells contain a splice variant of PDE4D, PDE4D3, that is activated by PKA (37). Therefore, PDE4D may constitute a second limb of a PKA-regulated negative-feedback loop.
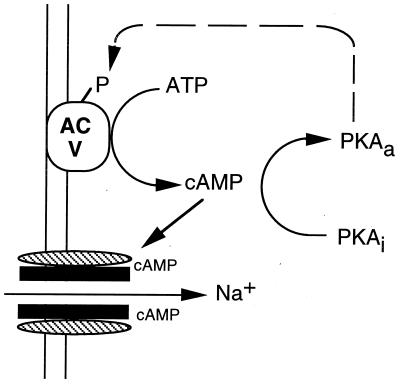
These findings lead us to hypothesize that cAMP and associated signaling events could constitute a timing mechanism for the pulsatile release of GnRH from GT1 cell cultures. Cyclical changes in cAMP are known to function as biological clocks. In the slime mold Dictyostelium, rhythmic changes in cell aggregation are timed by cyclical changes in cAMP (38). Oscillations in cAMP have also been implicated in timing of contraction of the heart (19). We have shown that increases in cAMP stimulate GnRH release, and we have provided data that the stimulation is mediated by cAMP-gated cation channels expressed by the cells (Fig. 7). The activation of PKA appears to regulate a negative-feedback loop decreasing the level of cAMP. Activation of PKA decreases cAMP levels, presumably by inhibition of AC V and/or AC VI. The PDE pathway may also constitute a second negative-feedback limb regulated in part by PKA (36). We hypothesize that the constitutive activities of AC V/VI are the driving force for the generation of cAMP. The observations that cAMP levels are elevated by blocking PDE4 or PKA activities support this idea. A model for the pulsatile behavior of GnRH neurons has been described which predicts that a network of interconnected cells with periodic alterations in cell excitability would show pulsatile behavior (39). We hypothesize that the levels of cAMP in GT1 cells may oscillate, altering cell excitability and constituting a biological clock for the pulsatile release of GnRH.
Figure 7.
Summary of cAMP signaling pathways in GT1 cells. Increased levels of cAMP result in the opening of cAMP-gated cation channels, allowing the influx of Na+ and increased excitability of the cell. Inactive PKA (PKAi) is activated by increased cAMP levels (PKAa), resulting in the phosphorylation (P) and inhibition of AC V and a decrease in cAMP levels. Solid lines represent stimulation and broken lines, inhibition.
Clearly the physiological significance of these findings needs to be tested in an in vivo model. The recent findings that the pulsatile release of GnRH is an intrinsic property of endogenous GnRH neurons cultured from the olfactory placode of a primate adds credence to the physiological relevance of findings in GT1 cell lines (40). Importantly the interpulse interval of the GnRH pulses in the primate cells was 50 min, similar to that seen in castrate monkeys, whereas in GT1 cells it was 25 min, similar to that seen in castrate rodents. Cultures of GnRH neurons from olfactory placode also show spontaneous Ca2+ oscillations and propagated Ca2+ waves (41), similar to those reported in GT1 cells (25). The use of transgenic technologies offers the ability to test the role of the cAMP signaling molecules in the regulation of pulsatile GnRH release in the rat. For example, the expression of the dominant-negative mutant of the regulatory subunit of PKA, which inhibits PKA activity (42), could be targeted to GnRH neurons by using the promoter enhancer regions of the GnRH gene.
Acknowledgments
This work was supported by National Institutes of Health Grants HD-08924 (R.I.W.), NS-02808 (A.C.C.), and NS-32283 (A.C.C.).
Abbreviations
- GnRH
gonadotropin-releasing hormone
- DA
dopamine
- AC
adenylyl cyclase
- PKA
cAMP-dependent protein kinase
- CNG
cyclic nucleotide-gated
- Mes
methanesulfonate
- RT-PCR
reverse transcription–PCR analysis
- [Ca2+]i
intracellular Ca2+ concentration
- PDE
phosphodiesterase
Footnotes
Article published online before print: Proc. Natl. Acad. Sci. USA, 10.1073/pnas.040545197.
Article and publication date are at www.pnas.org/cgi/doi/10.1073/pnas.040545197
References
- 1.Mellon P L, Windle J J, Goldsmith P C, Padula C A, Roberts J L, Weiner R I. Neuron. 1990;5:1–10. doi: 10.1016/0896-6273(90)90028-e. [DOI] [PubMed] [Google Scholar]
- 2.Wetsel W C, Mellon P L, Weiner R I, Negro-Vilar A. Endocrinology. 1991;129:1584–1595. doi: 10.1210/endo-129-3-1584. [DOI] [PubMed] [Google Scholar]
- 3.Martinez de la Escalera G, Choi A L, Weiner R I. Proc Natl Acad Sci USA. 1992;89:1852–1855. doi: 10.1073/pnas.89.5.1852. [DOI] [PMC free article] [PubMed] [Google Scholar]
- 4.Wetsel W C, Valenca M M, Merchenthaler I, Liposits Z, Lopez F J, Weiner R I, Mellon P L, Negro-Vilar A. Proc Natl Acad Sci USA. 1992;89:4149–4153. doi: 10.1073/pnas.89.9.4149. [DOI] [PMC free article] [PubMed] [Google Scholar]
- 5.Krsmanovic L Z, Stojilkovic S S, Merelli F, Dufour S M, Virmani M A, Catt K J. Proc Natl Acad Sci USA. 1992;89:8462–8466. doi: 10.1073/pnas.89.18.8462. [DOI] [PMC free article] [PubMed] [Google Scholar]
- 6.Kordon C, Drouva S, Martinez de la Escalera G, Weiner R I. In: The Physiology of Reproduction. 2nd Ed. Knobil E N J, editor. Vol. 1. New York: Raven; 1994. pp. 1621–1681. [Google Scholar]
- 7.Shi B, Mahesh V B, Bhat G K, Ping L, Brann D W. Neuroendocrinology. 1998;67:209–218. doi: 10.1159/000054316. [DOI] [PubMed] [Google Scholar]
- 8.Martinez de la Escalera G, Gallo F, Choi A L, Weiner R I. Endocrinology. 1992;131:2965–2971. doi: 10.1210/endo.131.6.1280208. [DOI] [PubMed] [Google Scholar]
- 9.Krsmanovic L Z, Stojilkovic S S, Balla T, al-Damluji S, Weiner R I, Catt K J. Proc Natl Acad Sci USA. 1991;88:11124–11128. doi: 10.1073/pnas.88.24.11124. [DOI] [PMC free article] [PubMed] [Google Scholar]
- 10.Mahachoklertwattana P, Black S M, Kaplan S L, Bristow J D, Grumbach M M. Endocrinology. 1994;135:1709–1712. doi: 10.1210/endo.135.4.7523101. [DOI] [PubMed] [Google Scholar]
- 11.Besecke L M, Wolfe A M, Pierce M E, Takahashi J S, Levine J E. Endocrinology. 1994;135:1621–1627. doi: 10.1210/endo.135.4.7925125. [DOI] [PubMed] [Google Scholar]
- 12.Martinez de la Escalera G, Choi A L, Weiner R I. Endocrinology. 1992;131:1397–1402. doi: 10.1210/endo.131.3.1354602. [DOI] [PubMed] [Google Scholar]
- 13.Martinez de la Escalera G, Choi A L, Weiner R I. Neuroendocrinology. 1995;61:310–317. doi: 10.1159/000126853. [DOI] [PubMed] [Google Scholar]
- 14.Charles A C, Hales T G. J Neurophysiol. 1995;73:56–64. doi: 10.1152/jn.1995.73.1.56. [DOI] [PubMed] [Google Scholar]
- 15.Uemura T, Nishimura J, Yamaguchi H, Hiruma H, Kimura F, Minaguchi H. Endocr J. 1997;44:73–78. doi: 10.1507/endocrj.44.73. [DOI] [PubMed] [Google Scholar]
- 16.Schwanzel-Fukuda M, Pfaff D W. Nature (London) 1989;338:161–164. doi: 10.1038/338161a0. [DOI] [PubMed] [Google Scholar]
- 17.Wray S, Grant P, Gainer H. Proc Natl Acad Sci USA. 1989;86:8132–8136. doi: 10.1073/pnas.86.20.8132. [DOI] [PMC free article] [PubMed] [Google Scholar]
- 18.Nakamura T, Gold G H. Nature (London) 1987;325:442–444. doi: 10.1038/325442a0. [DOI] [PubMed] [Google Scholar]
- 19.Sculptoreanu A, Rotman E, Takahashi M, Scheuer T, Catterall W A. Proc Natl Acad Sci USA. 1993;90:10135–10139. doi: 10.1073/pnas.90.21.10135. [DOI] [PMC free article] [PubMed] [Google Scholar]
- 20.Dhallan R S, Yau K W, Schrader K A, Reed R R. Nature (London) 1990;347:184–187. doi: 10.1038/347184a0. [DOI] [PubMed] [Google Scholar]
- 21.Sautter A, Zong X, Hofmann F, Biel M. Proc Natl Acad Sci USA. 1998;95:4696–4701. doi: 10.1073/pnas.95.8.4696. [DOI] [PMC free article] [PubMed] [Google Scholar]
- 22.Liman E R, Buck L B. Neuron. 1994;13:611–621. doi: 10.1016/0896-6273(94)90029-9. [DOI] [PubMed] [Google Scholar]
- 23.Altschul S F, Gish W, Miller W, Myers E W, Lipman D J. J Mol Biol. 1990;215:403–410. doi: 10.1016/S0022-2836(05)80360-2. [DOI] [PubMed] [Google Scholar]
- 24.Granneman J G. Endocrinology. 1995;136:2007–2012. doi: 10.1210/endo.136.5.7720648. [DOI] [PubMed] [Google Scholar]
- 25.Costantin J L, Charles A C. J Neurophysiol. 1999;82:429–435. doi: 10.1152/jn.1999.82.1.429. [DOI] [PubMed] [Google Scholar]
- 26.Saloman Y, Londos C, Rodbell M. Anal Biochem. 1974;58:541–548. doi: 10.1016/0003-2697(74)90222-x. [DOI] [PubMed] [Google Scholar]
- 27.Strewler G J. Am J Physiol. 1984;246:C224–C230. doi: 10.1152/ajpcell.1984.246.3.C224. [DOI] [PubMed] [Google Scholar]
- 28.Bönigk W, Bradley J, Müller F, Sesti F, Boekhoff I, Ronnett G V, Kaupp U B, Frings S. J Neurosci. 1999;19:5332–5347. doi: 10.1523/JNEUROSCI.19-13-05332.1999. [DOI] [PMC free article] [PubMed] [Google Scholar]
- 29.Bradley J, Li J, Davidson N, Lester H A, Zinn K. Proc Natl Acad Sci USA. 1994;91:8890–8894. doi: 10.1073/pnas.91.19.8890. [DOI] [PMC free article] [PubMed] [Google Scholar]
- 30.Veldhuis J D, Johnson M L. Am J Physiol. 1986;250:E486–93. doi: 10.1152/ajpendo.1986.250.4.E486. [DOI] [PubMed] [Google Scholar]
- 31.Iwami G, Kawabe J, Ebina T, Cannon P J, Homcy C J, Ishikawa Y. J Biol Chem. 1995;270:12481–12484. doi: 10.1074/jbc.270.21.12481. [DOI] [PubMed] [Google Scholar]
- 32.Premont R T, Chen J, Ma H W, Ponnapalli M, Iyengar R. Proc Natl Acad Sci USA. 1992;89:9809–9813. doi: 10.1073/pnas.89.20.9809. [DOI] [PMC free article] [PubMed] [Google Scholar]
- 33.Krupinski J, Coussen F, Bakalyar H A, Tang W J, Feinstein P G, Orth K, Slaughter C, Reed R R, Gilman A G. Science. 1989;244:1558–1564. doi: 10.1126/science.2472670. [DOI] [PubMed] [Google Scholar]
- 34.Horvath J E, Groot K, Schally A V. Proc Natl Acad Sci USA. 1995;92:1856–1860. doi: 10.1073/pnas.92.6.1856. [DOI] [PMC free article] [PubMed] [Google Scholar]
- 35.Halloy J, Lauzeral J, Goldbeter A. Biophys Chem. 1998;72:9–19. doi: 10.1016/s0301-4622(98)00119-7. [DOI] [PubMed] [Google Scholar]
- 36.Sakakibara H, Conti M, Weiner R I. Neuroendocrinology. 1998;68:365–373. doi: 10.1159/000054386. [DOI] [PubMed] [Google Scholar]
- 37.Alvarez R, Sette C, Yang D, Eglen R M, Wilhelm R, Shelton E R, Conti M. Mol Pharmacol. 1995;48:616–622. [PubMed] [Google Scholar]
- 38.Tomchik K J, Devreotes P N. Science. 1981;212:443–446. doi: 10.1126/science.6259734. [DOI] [PubMed] [Google Scholar]
- 39.Gordan J D, Attardi B J, Pfaff D W. Neuroendocrinology. 1998;67:2–17. doi: 10.1159/000054293. [DOI] [PubMed] [Google Scholar]
- 40.Terasawa E, Keen K L, Mogi K, Claude P. Endocrinology. 1999;140:1432–1441. doi: 10.1210/endo.140.3.6559. [DOI] [PubMed] [Google Scholar]
- 41.Terasawa E, Schanhofer W K, Keen K L, Luchansky L. J Neurosci. 1999;19:5898–5909. doi: 10.1523/JNEUROSCI.19-14-05898.1999. [DOI] [PMC free article] [PubMed] [Google Scholar]
- 42.Clegg C H, Correll L A, Cadd G G, McKnight G S. J Biol Chem. 1987;262:13111–13119. [PubMed] [Google Scholar]


