Abstract
Protein folding is considered here by studying the dynamics of the folding of the triple β-strand WW domain from the Formin binding protein 28 (FBP). Starting from the unfolded state and ending either in the native or nonnative conformational states, trajectories are generated with the coarse-grained united residue (UNRES) force field. The effectiveness of principal component analysis (PCA), an already-established mathematical technique for finding global, correlated motions in atomic simulations of proteins, is evaluated here for coarse-grained trajectories. The problems related to PCA and their solutions are discussed. The folding and non-folding of proteins are examined with free energy landscapes. Detailed analyses of many folding and non-folding trajectories at different temperatures show that PCA is very efficient for characterizing the general folding and non-folding features of proteins. It is shown that the first principal component captures and describes in detail the dynamics of a system. Anomalous diffusion in the folding/non-folding dynamics is examined by the mean-square displacement, (MSD), and the fractional diffusion and fractional kinetic equations. The collision-less (or ballistic) behavior of a polypeptide undergoing Brownian motion along the first few principal components is accounted for.
Keywords: principal component analysis, 1E0L, UNRES force field, folding dynamics, anomalous diffusion
INTRODUCTION
The dynamics of protein folding can be discussed in terms of the diffusive properties of the polypeptide chain. Principal component analysis (PCA), a covariance-matrix-based mathematical technique, is a procedure to reduce a multidimensional complex set of variables to a lower dimension along which the diffusive properties at all stages of protein folding can be identified. Folding does not refer to a progressive pathway of unique single conformations, but rather to interconversions among ensembles of conformations in a back-and-forth progression from the unfolded to the folded state. In this paper, we treat the protein-folding problem by presenting information about the folding and non-folding events of a small 37-residue protein, the triple β-strand WW domain from the Formin-binding protein 28 (FBP) (1E0L in PDB notation1).
The formation of intermolecular β-sheets is thought to be a crucial event in the initiation and propagation of amyloid diseases such as Alzheimer’s disease2 and spongiform encephalopathy,3 and to be involved in a number of disease pathologies,4 trafficking,5 and cellular signaling.6 Yet, the dynamics of formation of β-sheets is still not fully understood. Consequently, much experimental7 and theoretical8–10 research is being carried out with the WW domain families of proteins, the smallest natural β-sheet structures, to gain insight into the dynamics of formation of β-sheets.
Folding of proteins involves motion in a large range of length and time scales. Thus far, there are no experimental techniques to describe protein dynamics, in which fluctuations range from bond-distance variations of tenths of Angstroms on the femtosecond time scale to folding of the whole protein on a time scale of seconds. All-atom molecular dynamics (MD) simulation is the only computational method with which to study these motions. However, there are two major obstacles limiting its usefulness: (i) the shortness of the achievable simulation times, and (ii) the multidimensionality of the system (>104 degrees of freedom with explicit solvent).
In all-atom MD simulations, the time scales of current computers (hundreds of nanoseconds) are at least one order of magnitude smaller than the folding time of proteins.11 During the past decades, many approximate methods have been developed to attack the folding problem. These approaches are either physics or knowledge-based methods.12–14 One of them makes use of a physics-based united-residue (UNRES) force field developed in our group over the past several years.15–19 Each amino acid residue is represented by only two interaction sites, which makes the model simple enough with which to carry out large-scale simulations. In formulating UNRES, averages are evaluated over the fast degrees of freedom, facilitating its application to MD simulations. The advantage of UNRES compared to other mesoscopic protein force fields is that it has been derived carefully as a potential of mean force of polypeptide chains17 and ultimately parameterized18,19 based on the concept of a hierarchical protein energy landscape.20,21 Together with the efficient conformational space annealing (CSA) method22 of global optimization and, more recently with MD simulations,23,24 UNRES is able to predict the structures of real-size proteins without ancillary information from structural databases.19,25 Therefore, UNRES appears to be a good mesoscopic force field for studying the folding pathways of proteins in real time.
Out of thousands of modes in proteins, only a few modes contain more than half of the total fluctuations of the system; therefore, a strategy is needed to identify the most important (slow) modes. For this purpose, principal component analysis (PCA),26–34 also called quasi-harmonic analysis,35 molecule optimal dynamic coordinates,36,37 and essential dynamics method,38 is one of the most efficient methods.
Although PCA can separate the modes of motion based on amplitude, one should be careful in interpreting the results of this analysis. First, the set of modes capturing the major fluctuations of a system depend on the width of the sampling window. In other words, with increasing width of the sampling window, more and more slower modes can acquire larger amplitudes and appear as the dominant mode.28 Second, random (normal) diffusion can produce cosine-shaped principal components (PCs),30 which can mistakenly be interpreted as a transition of the system from one state to another. This problem exists in only short MD trajectories30 and should not be confused with PCs of long trajectories, which also may have the shape of a cosine-like function identifying the real transition. Third, it is important to eliminate overall rotation for large-amplitude motion, on which the PCA results ultimately depend, especially for peptides and small proteins. This problem has been solved recently by introducing a novel PCA, based on the replacement of Cartesian coordinates in PCA by internal coordinates (dihedral angles), called dihedral principal component analysis (dPCA).39
The cause of the first two problems in PCA is the insufficiency of the simulation time for sampling. Thus, determination of a minimum MD simulation length, which is required for the convergence of sampling, is still an actively-studied topic. Thus far, there is no unique solution of this problem. The length of a minimum MD simulation can change from system to system, and depends on the size of the system. For small peptides, 1 ns simulation is enough time to achieve convergence of sampling;40 proteins require much longer simulation times, but how much longer is still not clear. Several years ago, Hess introduced the cosine content of PCs,31 which is a good indicator of bad sampling; however, accurate study of the convergence behavior in proteins is impossible because current computers are not fast enough to probe all available conformations.31 One example is the recent unsuccessful attempt to solve the convergence problem, in which the authors performed 26 independent 100ns MD simulations for the membrane protein rhodopsin.34 The results showed that the sampling was not fully converged even for individual loops.34 Thus, because all-atom MD simulations, that must achieve convergence, are insufficiently long when treating large proteins, it is not easy to satisfy the basic motivation for using PCA in the analysis of all-atom MD trajectories, which is the identification of slow modes and their use for prediction of long-time dynamics.
Besides the development of new theoretical approaches, in recent years many experiments have been carried out to study protein folding. The energy landscape language has emerged for experimentalists and theorists to describe how proteins fold and function.41–43 The picture of the free energy landscape of proteins has benefited from a variety of experimental studies44–46 of fast-folding events, and computational studies47–49 of small fast-folding proteins and peptides. The difficulties to compute the free energy landscapes for medium- and large-size proteins are related, again, to the time limitations in all-atom MD simulations. In order to study larger proteins and overcome the problems mentioned above, coarse-grained MD trajectories are required.
A theoretical investigation of the folding dynamics of β-sheet motifs is always challenging and not always achievable at the atomic level of simulation because of the longer folding time compared to that of the α-helix. This challenge makes it more interesting to study this basic structural motif of proteins because UNRES easily simulates the folding dynamics of a protein such as 1E0L. Many MD simulations, starting from the extended state and ending either in the native or nonnative conformational states, are carried out here at different temperatures with the coarse-grained UNRES force field, and then analyzed by PCA. By analysis of full folding/non-folding trajectories, we show that PCA is a very powerful technique to extract reliable information about the dominant behavior over the folding landscape. We demonstrate the evolution of the lowest-indexed PC from the randomly diffusive regime to the unfolded state and then to the native state. The free energy landscapes in the space of the two largest principal components for 1E0L illustrate mainly a three-state folding pathway although, for some trajectories at higher temperature, we observe extremely fast direct folding with the disappearance of an intermediate basin (two-state folding).
We also study the diffusive behavior along the low-indexed PCs for both a full trajectory starting from the unfolded state and ending either in the native or nonnative conformational states, and in unfolded, folded, and transition states separately by using the mean-square displacement (MSD) and the fractional-diffusion and fractional-kinetic equations.50,51 We show that the diffusive behavior of the system analyzed by MSD depends strongly on the length of the MD simulation. Slow diffusion (subdiffusion) is revealed for the native state, the first half of the unfolded state, and the full trajectory; however, we observed an enhanced diffusion (superdiffusion) in the transition state and in the second half of the unfolded state. Moreover, we show that the behavior of a system along cosine-shaped PCs cannot be normal diffusive, and confirmed the correctness of an earlier finding of collision-less (or ballistic) behavior30 of a polypeptide undergoing Brownian motion.
RESULTS AND DISCUSSION
Principal components
Since coarse-grained models enable us to carry out MD simulations starting from the unfolded state and ending in the native state, and consume a fairly short CPU time, we have employed the UNRES force field to generate many trajectories at different temperatures for 1E0L,1 Fig. 1. In this work, we present the results of fast-, slow-, and non-folding trajectories at different temperatures analyzed by PCA. All trajectories start with the same initial (extended) structure but with different velocities. The terms fast- and slow-folding are arbitrary. The total time of all MD simulations is the same, ~ 600 ns. If the protein folds before 300 ns (half of the entire simulation time), then the trajectory is called fast-folding; if the protein spends half (or more) of the entire trajectory time to fold, then the trajectory is called slow-folding. If the system never folds during the entire 600 ns MD simulation, then the trajectory is called non-folding.
Figure 1.
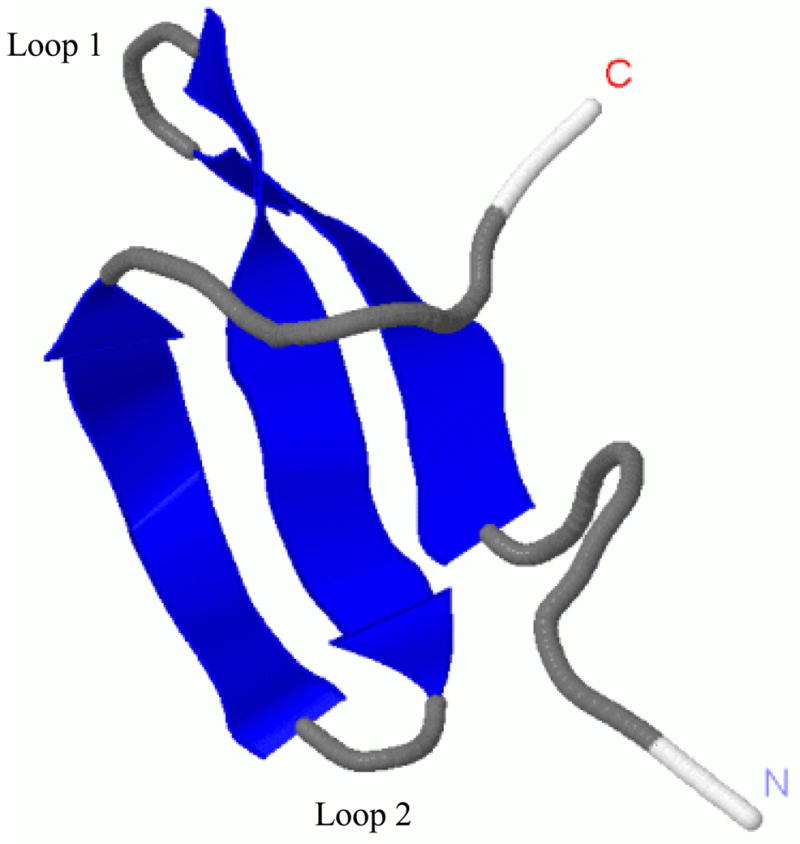
Experimental NMR structure1 of the triple β-strand WW domain from the Formin binding protein 28 (FBP) (1E0L).
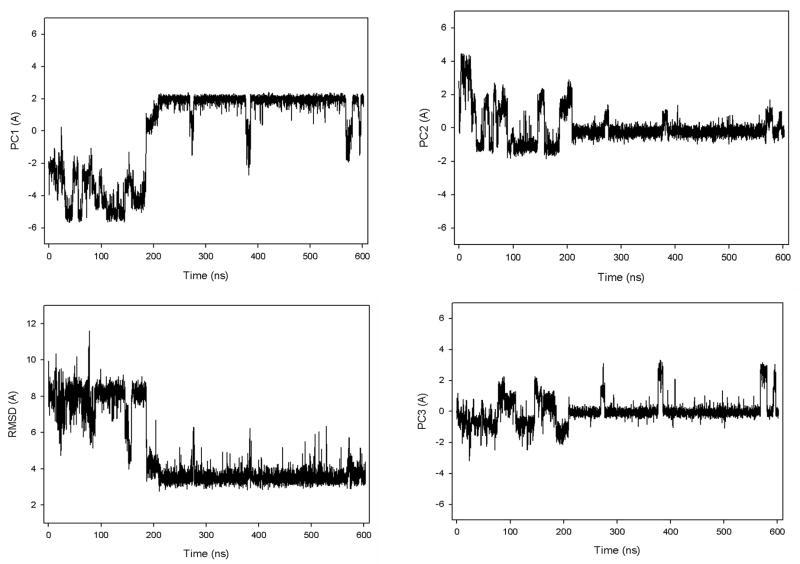
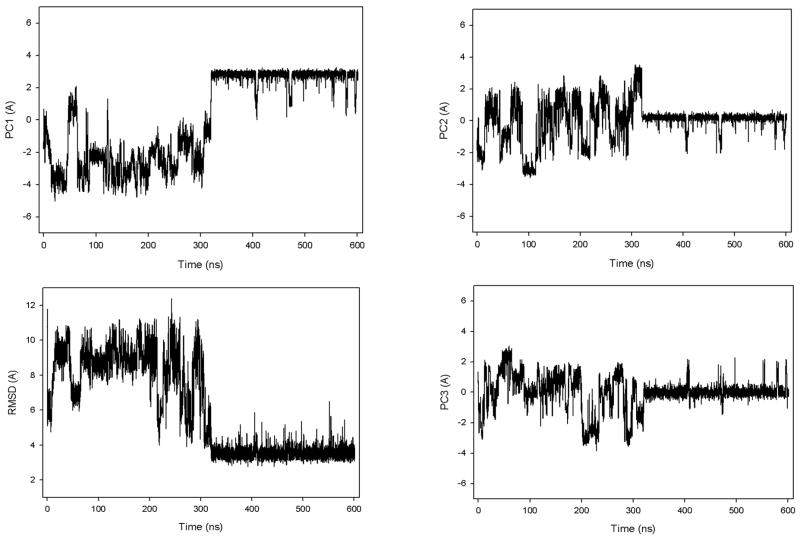
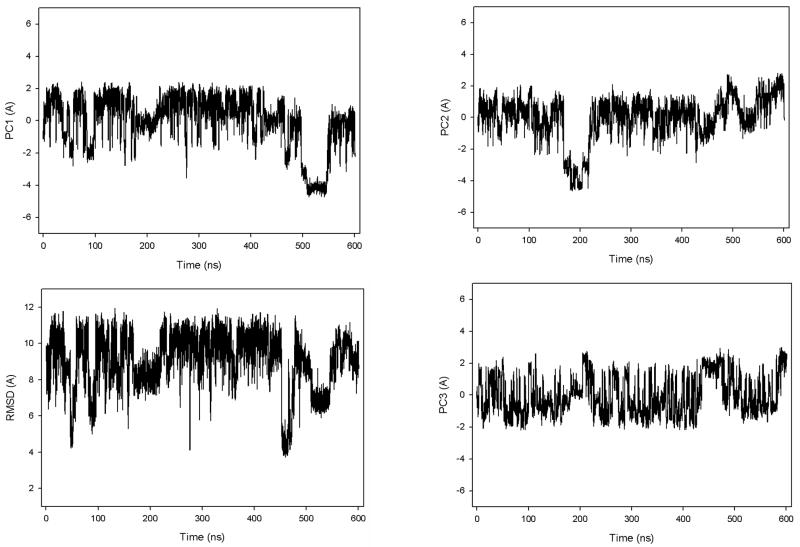
Figure 2 illustrates the first three PCs and the root-mean-square deviation (rmsd) from the native structure of fast- (panel a), slow- (panel b), and non-folding (panel c) MD trajectories for 1E0L at 330K. These three trajectories are representative of many MD trajectories that we have obtained at 330K. The calculated and experimental7 folding temperatures of 1E0L are 339 K and 337 K, respectively. Since the time scale of the dynamics with the coarse-grained UNRES model does not correspond to that of the all-atom dynamics because of averaging over the secondary degrees of freedom in UNRES, the time given in the Figures and in the text below is regarded as an UNRES time. There is a clear correlation between PC1 and the rmsd for the fast- and slow-folding MD trajectories. The PC1 in these trajectories not only nicely captures the motion of the protein during the entire trajectory, but also contains the large part, 56.4% and 48.1%, of the overall fluctuations for the fast- and slow-folding MD trajectories, respectively. Although some correlation between PC2 and higher-indexed PCs and rmsd is noticeable in some parts of the trajectory, these PCs mainly identify the transition from the unfolded state to the native state. Such a behavior and the relatively small contributions to the total fluctuations (for example, in the fast-folding trajectory, the contributions of PC2 and PC3 to the total fluctuation are seven and eleven times less, respectively, than the contribution of PC1) make the higher-indexed PCs less important. Thus, the main features of the energy landscape of the system for fast- and slow-folding trajectories can be represented by the first PC.
Figure 2.
The first three principal components and rmsd from the native structure of fast- (a), slow- (b), and non-folding (c) MD trajectories at 330K for 1E0L.
In contrast to the fast- and slow-folding trajectories, in which the first PC captures most of the behavior of the rmsd, the correlation between PC’s and rmsd is observed in the first three PCs in the non-folding MD trajectory (panel c); also, the amplitudes of fluctuation along PC1 and PC2 (in panel c) are relatively similar to each other. Hence, the distribution of the captured parts of the overall fluctuations by the first few PCs is different for the non-folding MD trajectory: PC1 ~ 18.4%, PC2 ~ 12.9%, PC3 ~ 10.2%. Thus, for the non-folding trajectory, the first PC is not enough to depict the main features of the energy landscape.
The principal components can be classified into three categories: multiply-hierarchical, singly-hierarchical, and harmonic.29
The free energy profile, μi(qi) = − kBT ln Pi(qi), along multiply-hierarchical PC(qi)’s, where Pi(qi), T and kB are the pdf, the absolute temperature, and the Boltzmann constant, respectively, is highly-rugged, i.e., anharmonic, and many local minima appear in a multiple number of coarse-grained minima. The multiply-hierarchical PCs are a main contributor to the total fluctuations, and associated with global collective motions.27,29 The collective motion in a protein is any motion that involves a number of atoms moving in a concerted fashion.27 The protein moving along a multiply-hierarchical PC significantly changes its intra-molecular packing topology.52 The probability distribution along a second category of PC, viz., singly-hierarchical, is Gaussian-like with a single peak, and the free energy profile along a singly-hierarchical PC is characterized by a number of local minima arranged within a single coarse-grained minimum.29 The last category of PC, viz., harmonic, does not contribute significantly to the total fluctuation since it involves low-amplitude local minima and corresponds to local motions.29 Such local motions have largely been averaged out in formulating UNRES.
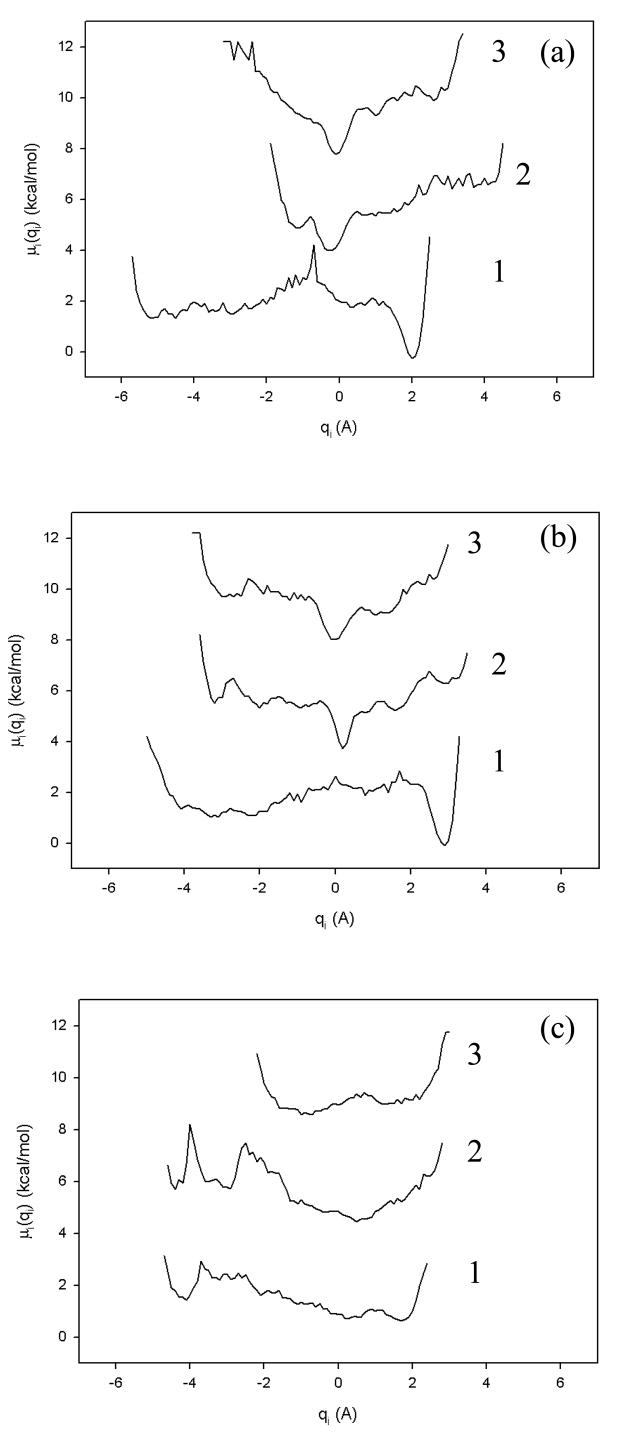
Figure 3 illustrates the free energy profiles of the first three PCs of all three MD trajectories (in panels a, b, and c) described in Fig. 2. In order to avoid overlapping, the free energy profiles in Fig. 3 are shifted by 4×(i − 1) units (i is the index of the PC) along the ordinate axis. Unlike all-atom MD trajectories, in which the free energy profiles of the first few tens of PCs usually exhibit a multiply-hierarchical shape,29 in the UNRES trajectories the free energy profiles along only PC1 for the fast- and slow-folding trajectories, and the free energy profiles along the first two PCs for the non-folding trajectory can be characterized as multiply-hierarchical (i.e., they contain more than one major basin of minima). This feature of the coarse-grained UNRES model, in which fast motions are averaged out, is advantageous and important for the reason discussed below.
Figure 3.
Free energy profiles of the first three principal components (qi) for fast- (a), slow- (b), and non-folding (c) MD trajectories at 330K for 1E0L. The numbers 1, 2, 3 within each panel refer to PC1, PC2 and PC3.
The point is that the subspace spanned by the multiply-hierarchical PCs, which corresponds to the largest fluctuations, contains the most important molecular conformations. However, the identification of all conformational states is difficult if the subspace is formed by more than two PCs, thereby requiring a high-dimensional energy landscape. This is mainly due to the fact the principal components of the same category are not independent of each other,29 and the visualization of conformational states in these higher dimensions is unfeasible. The free energy profiles illustrated in Fig. 3, in which a multiply-hierarchical shape is revealed mainly along the first PC (or the first two PCs for the non-folding trajectory), show that the problem related to the visualization of states in the subspaces does not exist for UNRES trajectories. Based on the fact that the subspace formed by multiply-hierarchical PCs contains the most important molecular conformations, Hegger et al.53 defined the dimension of the free energy landscape by the number of multiply-hierarchical PCs. Based on this definition, the dimension of the free energy landscape for UNRES folding and non-folding trajectories decreases to one and two, respectively. One of the proofs of the Hegger et al.53 definition is the correlation between PC1 and rmsd in Fig. 2. It is an important feature of the UNRES model, since the dimension of the free energy landscape of the much smaller system, the alanine peptide (Ala10), constructed from all-atom MD trajectories, is 8 and the dimension increases with the size of the system.53
Convergence of sampling
One of the main problems pointed out by many authors,28,31,33,34,40 which appears when analyzing trajectories by PCA, is the convergence of sampling. As mentioned in the Introduction, for short MD simulations, insufficient for convergence of sampling, the first several PCs can have the shape of a cosine function caused by random motion of the polypeptide chain without potential barriers, as characteristic of Brownian motion.30,31 Therefore, the cosine content (defined in the Methods section) was introduced31 as a measure of the closeness of the PC to a cosine shape, which appeared to be a good indicator for predicting whether or not a trajectory has sampled a free energy landscape sufficiently for convergence.31,33,40 The value of the cosine content varies between 0 (no cosine shape) and 1 (perfect cosine shape). When the cosine content of the first few PCs is close to 1 (an indication of bad sampling), the largest-scale motions in the protein dynamics cannot be distinguished from that for particles, i.e. polypeptide chains, executing random diffusion, and so cannot be interpreted in terms of specific features of the energy landscape.30,31,33,40
It should be noted that there is no conventional threshold separating the times of insufficient and sufficient sampling as determined by the value of the cosine content; however, our previous studies33,40 show that such a crossover might lie somewhere around a cosine content of 0.2 for small peptides, and increases up to 0.5 for proteins. Coarse-grained MD simulations allow us to obtain the projections of the entire MD trajectories from the unfolded state to the native state. Therefore, we can illustrate the evolution (change) of the PCs with MD simulation time, starting from cosine-shaped projections for the unfolded state, emerging from simple Brownian motion30 encountered in short-time simulations, proceeding to projections obtained from trajectories that are long enough to overcome random diffusion, in which the results depend only on sampling because of lack of potential barriers, and reach potential barriers on the free energy landscape, in which the values of the cosine content lie below a threshold value and the free energy landscape is independent of the starting structure on any segment of a folding trajectory.
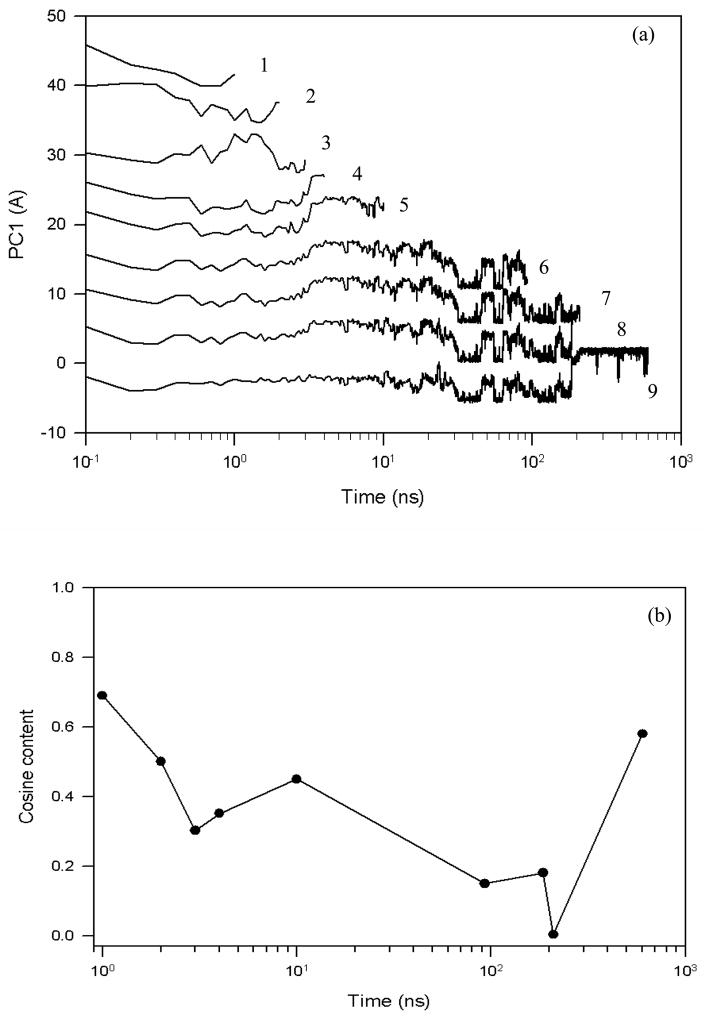
To show such a time-evolution of a PC, we divided one of the folding trajectories into segments of increasing length and carried out a principal component analysis for each segment. The results are shown in Fig. 4(a). In order to avoid overlapping, and to plot several projections at different time scales (differing by a few orders of magnitude), we first shifted the projections along the ordinate axis, and then used a logarithmic scale for the abscissa. Since the logarithmic scale distorts the cosine-shaped projection, additionally we plotted the cosine contents of these projections in Fig. 4(b) to show the closeness of the shapes of the projections to the cosine function.
Figure 4.
The first principal component (a) and the cosine contents of PC1 (b) of a fast folding trajectory for 1E0L at 330K for different time scales, starting from random diffusion (lines 1 and 2) and ending with a full trajectory (ninth line).
Based on the results shown on these panels, the projections can be classified into three categories: (i) projections of Brownian motion (lines 1 and 2), showing high cosine content; (ii) projection identifying the end of random diffusion and the beginning of the region in the free energy landscape where a potential barrier is encountered (line 3), showing lower cosine content; (iii) projections of trajectories that have already overcome random diffusion and have reached the region of the potential barriers (lines 4–9). Because of the high value of the cosine content (non-converged trajectories) and the qualitatively different behavior of the first two shortest projections (~ 1 and 2 ns), lines 1 and 2, they cannot be considered as a reliable source for the free energy landscape over which the dynamics occurs. Therefore, these projections belong to the first category (Brownian motion). The cosine contents of the next two shortest projections (third and fourth lines) are below the threshold value (0.5); however, based on the change in shape between lines 3 and 4, they can be interpreted as follows. The third shortest projection (~ 3 ns), line 3, neither exhibits a half-cosine shape nor mimics the projections of longer trajectories, which indicates that 3 ns can be considered as a transition time when the system stops behaving as one with Brownian motion and reaches barriers on the free energy landscape. This projection belongs to category (ii) (end of random diffusion). Based on the behavior of the fourth shortest projection (~ 4 ns), line 4, which exhibits the shapes of the longer-time projections, we can conclude that the trajectory is already past the region of random diffusion and is caused by the potential barriers. This and all other longer-time projections illustrated in Fig. 4(a) are representatives of category (iii). In order to strengthen our arguments about sufficient sampling, we have analyzed ten 4 ns time interval segments obtained from the MD trajectory shown in Fig. 4(a). Eight of them illustrated qualitatively similar free energy profiles with two prominent minima, which is consistent with the free energy profile of the full trajectory. Also, the high value of the cosine content at the last point in Fig. 4(b) has nothing to do with random diffusion, but corresponds to the transition of the system from one state to another, as shown in PC1 of Fig. 2(a).
Thus, based on the results illustrated in Fig. 4, we can conclude that the threshold, separating the times of insufficient and sufficient sampling, determined by the value of the cosine content lies around 0.5, as was obtained in our previous study.40 Also, for 1E0L, the 4 ns MD simulation [line 4 of Fig. 4(a)] appears to be enough time to achieve convergence of sampling.
Free energy landscapes of folding/non-folding MD simulations
The folding kinetics of the FBP28 WW domain was studied by different groups at different levels of modeling.8–10 Using a sequence-dependent Cα-based Gô-like model, Karanicolas and Brooks found that the FBP28 WW domain folds with biphasic kinetics because the formation of loop 2 contacts is independent of the folding of the remainder of the protein.8 The same authors revisited the FBP28 WW domain using a biased-sampling method with an all-atom model and with implicit representation of the solvent. After analyzing the free-energy landscapes from MD simulations, they concluded that the FBP28 WW domain may adopt two slightly different forms of packing in its hydrophobic core.9 Recent studies by Mu and co-workers,10 using replica exchange MD simulations in explicit water, showed that the FBP28 WW domain adopts different hydrophobic packing forms due to the misfolding of turn 2. Further discussion of a possible folding mechanism of this domain is provided below.
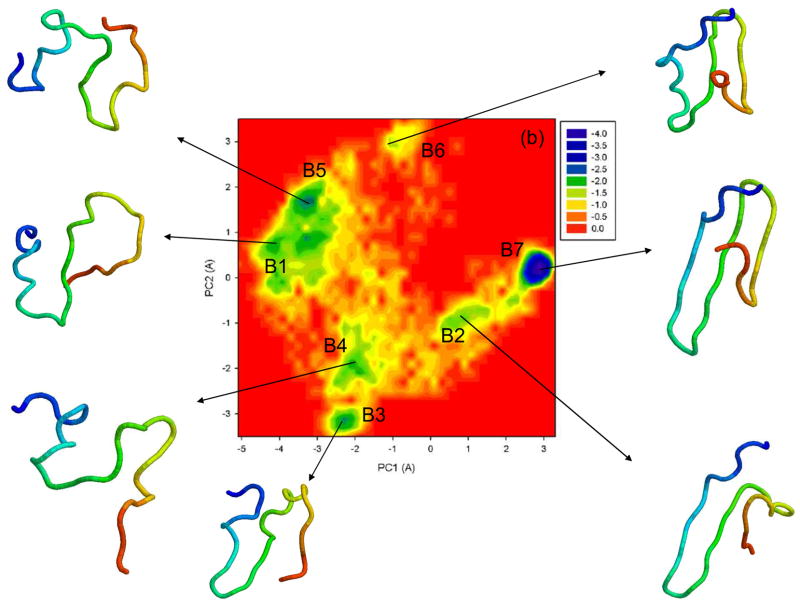
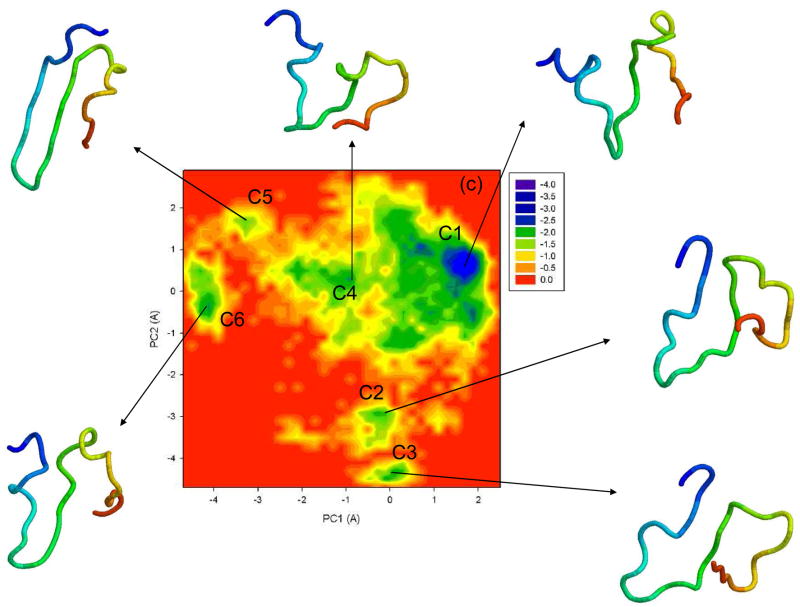
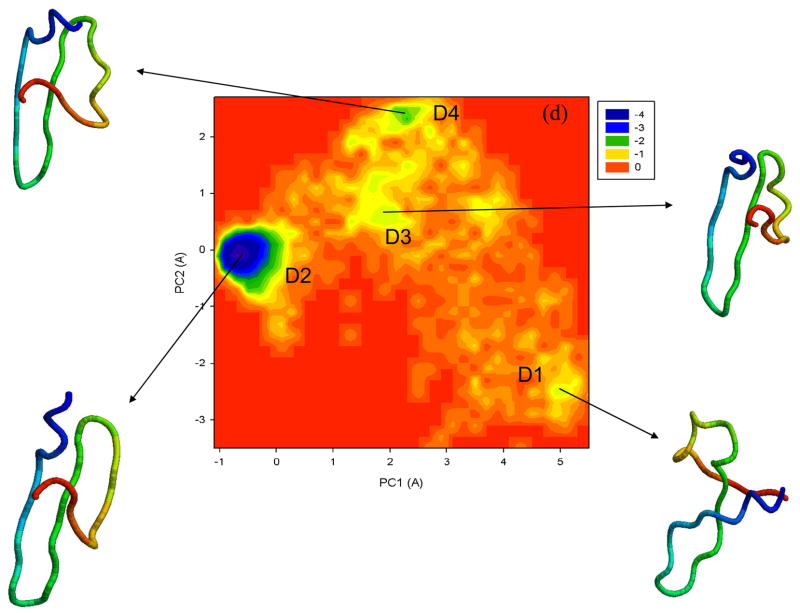
To illustrate folding/unfolding events obtained by the UNRES MD simulations for 1E0L, we constructed free energy landscapes along the first two PCs, μ(q1, q2) = − kBT ln P(q1, q2). Figure 5 shows the free energy landscapes for the MD trajectories discussed in Fig. 2 and for extremely fast-folding MD trajectory at 335K. The first two panels (a, b) correspond to the fast- and slow-folding trajectories, respectively. Two global basins with local minima and the transition state can be identified in both free energy landscapes.
Figure 5.
Free energy landscapes (in kcal/mol) for 1E0L with representative structures at the minima of fast- (a), slow- (b), and non-folding (c) MD trajectories at 330K, and an extremely fast-folding MD trajectory at 335K (d). A1–A5, B1–B7, C1–C6, D1–D4 are the minima on the free energy landscapes. The structures are colored from blue to red from the N- to the C-terminus.
In panel (a), the A1, A2, and A3 minima with representative structures belong to the unfolded state, in which the system spends ~ 30% [Fig. 2(a)] of the entire MD simulation time. The minima A4 and A5, with representative structures and ~ 5% and 65% occupation times, correspond to the “collapse” and native state, respectively. In particular, in the unfolded state the system mainly jumps back and forth between minima A1 and A2, and between minima A2 and A3; however, the final jump from the unfolded state takes place from minimum A3. The protein overcomes the barrier between the non-native and native states by undergoing a “collapse” to minimum A4, and then proceeding to the native state (minimum A5). The representative structures in the local minima of the unfolded state do not show any sign of formation of strands or loops; however, at minimum A4, it can be seen that loop 2, strand 3 and partially strand 2 are formed. Loop 1 and strand 1 are formed in the transition state.
The non-native state of the free energy landscape in panel (b) can be characterized by five distinct minima, B1 – B5; however, B1 and B5 appear as a sub-basin, in which the system stays at the beginning and at the end of the non-native state and spends ~ 35% of the entire trajectory time there. As in the fast-folding trajectory (panel a), the system overcomes the barrier of the transition state between the unfolded and native state (B7) through the “collapse” (the shallow minimum B6). Unlike the fast-folding trajectory, loop 1, strand 1 and partially strand 2 are formed in the second local minimum (B2) of the non-native state. However, the system starts to lose the β-sheet structure step by step from minimum to minimum (B3–B5). At minimum B6, as in the fast-folding trajectory, loop 2, strand 3 and partially strand 2 are formed, and loop 1 and strand 1 are formed in the transition state.
Panel (c) illustrates the free energy landscape of the non-folding trajectory. It can be seen that the system contains quite a large sub-basin characterized by the major, deep minimum C1 and shallow minimum C4, in which the system remains for the longest period of time [~ ¾ of the entire trajectory, Fig. 2(c)] with periodic jumps to minima C2 and C3. By jumping between these four minima, the protein tries to form loops and strands, although none of them is completely formed. In this non-folding trajectory, the protein does not “collapse”, as occurred in previous trajectories but, instead, the system jumps to minimum C5, with quite a small rmsd (~ 3.8 Ǻ) [Fig. 2(c)]; however, the structures found in minimum C5 are misfolded, since strand 3 has lost part of the β-structure. The protein does not spend a long time in the misfolded state [~ 2% of the entire trajectory time, Fig. 2(c)] and jumps back to minimum C4. After that, the system jumps from minimum C4 to minimum C6, in which it spends ~ 7% of the entire trajectory time, Fig. 2(c), and then jumps back to the sub-basin. Thus, in this case, the protein does not fold.
All the minima, and the time (in %) spent in the minima, can be identified on the first PC in Fig. 2. It should be noted that the collapsing property of the version of the UNRES force field62 used in the present MD simulations is caused by a largely exaggerated SC-SC interaction component (This undesirable feature of the force field is now being circumvented by imposing an increase of the radius of gyration at temperatures larger than the folding-transition temperature; A. Liwo, S. Ołdziej, C. Czaplewski, U. Kozłowska, H. A. Scheraga, unpublished work). However, the “collapse” is instantaneous and is then followed by folding to the native state.
If the “collapse” can be considered as a state, then most of the landscapes of the MD trajectories studied here illustrate mainly a three-state folding pathway although, for some trajectories at higher temperature (335K), illustrated in Fig. 5(d), we observed extremely fast direct folding without the appearance of an intermediate (“collapse”) basin (two-state folding). These findings are consistent with the experimental results obtained by Nguyen et al.7
In particular, in an extremely fast-folding trajectory, the system spends a very short time in the infolded state (minimum D1) and jumps directly to the native state (D2). After that, during the entire trajectory the protein jumps several times to the non-native state (minima D3, D4) but, as during the first time, it returns every time to the native state very quickly. Thus, we observe a few folding/unfolding events in this trajectory. Unlike the trajectories at 330K, in this trajectory we do not see the steps in which strands and loops are formed during the first fold (D1–D2). However, when the system makes short-time jumps from the native state to the non-native state (D2–D3, D2–D4), only strand 3 loses part of the β-structure.
Although not shown here, the PC1 – PC3 free energy landscapes are similar to the PC1 – PC2 landscapes illustrated in Fig. 5.
Finally, we note that we have combined the above-discussed fast-, slow-, and non-folding MD trajectories at 330K, calculated the first few PCs, and constructed the free energy profiles and landscape (not shown). The free energy profiles and landscape for the combined trajectory visually look like the ones for the fast- and slow-folding trajectories illustrated in Fig. 5(a, b). In other words, two global basins with local minima and the transition state can be identified. This is not surprising since the whole trajectory consists of two folding trajectories and one non-folding one. The folding pathway in the combined trajectory contains the folding pathways of all three trajectories, and depends on the order of the trajectories. In other words, the folding pathway of the combined MD trajectory repeats the folding pathways of all three trajectories in the order in which they are placed.
Diffusion in folding dynamics
Diffusion-mediated searching for a specific target is frequently used in biology ranging from the macroscopic prey-predator level in zoology to the binding of ligands to macromolecules in living cells and folding/unfolding in proteins. The searching of events is governed mainly by normal diffusion characteristic of Brownian motion or its qualitatively slower companion subdiffusion; however, it has been shown,54 that another type of diffusion, called enhanced diffusion or superdiffusion, is a very efficient way to search for targets, and outperforms Brownian normal diffusion as a statistical strategy for finding randomly located objects. Using the language of proteins, subdiffusion indicates that a system is trapped in local minima in conformational space, and superdiffusion emerges when the system makes long jumps in conformational space.
The mean-square displacement (MSD), a measure of the overall motion present in a protein, is found to be proportional to t2HD, where the quantity HD is the Hölder exponent which, in the case of simple Brownian motion, has the value ½ (normal diffusion). The values of HD > ½ and < ½ correspond to superdiffusion and subdiffusion, respectively.37 When the value HD = 1, superdiffusive behavior is called collision-less (ballistic).30
Anomalous diffusion (i.e. sub- and superdiffusion) controls the cooperative motion characterized by the MD trajectories which, in turn, are projected onto a set of collective variables defined by PCA. However, it is not a trivial task to interpret the cooperativity exhibited along the low-indexed PCs.30,55 For example, MSD analysis showed that cosine-shaped projections of a Brownian particle along the first few PCs exhibit ballistic motion, even though the whole system behaves diffusively.30 For a protein (OMPf), it has been shown that the MSD of the first two PCs, the dynamics of which along these low-indexed PCs resembles that for Brownian motion, illustrates subdiffusive behavior on time scales below 100ps, and ballistic behavior on longer time scales.30 This behavior was considered as an artifact of a short simulation time because the PCA filters ballistic motions out of a diffusive system.30,55 We address this problem at the end of this section
Using MSD analysis, we have scrutinized the diffusive behavior along the low-indexed PCs for several different UNRES MD trajectories of the FBP28 WW domain. We have selected the folding/non-folding trajectories below, very close to, and above the folding temperature (Tf = 337 K), respectively.
Since the global motions along PC1 contain a major part of the total fluctuation in 1E0L, our interest was focused on the diffusive behavior of the system along this PC. The MSDs along PC1 of the different folding/non-folding trajectories below the folding temperature (namely 320K, 330K, 335K) show that all trajectories are subdiffusive (HD < ½). These findings are consistent with earlier results obtained by Yang et al. from single molecule experiments,56 which also showed subdiffusive behavior. However, in order to observe a conformational transition, i.e., superdiffusive behavior, it is necessary to carry out an MSD analysis of the PC of parts of the fast-folding MD trajectory.
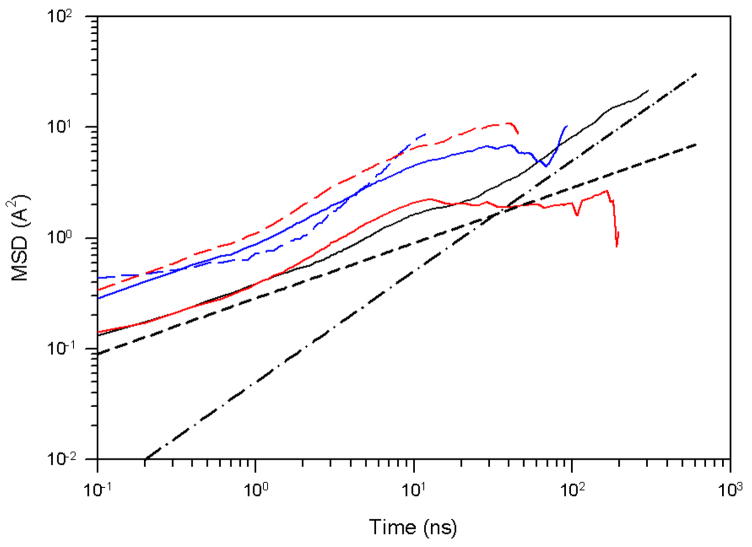
For this purpose, we have split the fast-folding trajectory [Fig. 2(a)] into the unfolded region (from 0 to 186 ns), the transition region (from 187 to 210 ns), and the native region (from 211 to 600 ns), and carried out a PCA for each region. Figure 6 illustrates the MSD as a function of time for PC1 of these regions.
Figure 6.
The mean square displacement of PC1 for the fast-folding MD trajectory for 1E0L at 330K, i.e., below the folding temperature. The black solid line corresponds to the full trajectory, the red solid and dashed lines correspond to the native and the first half of the unfolded states, respectively; the blue solid and dashed lines correspond to the entire unfolded and transition states, respectively; the black dashed and dash-dot lines correspond to t0.5 and t1, respectively.
The native region of the trajectory (red solid line in Fig. 6) exhibits very strong subdiffusive behavior (HD = 0.07). This is not surprising because the system spends the longest time in the native state in this trajectory, i.e., it falls into, and is trapped in, a deep well on the free energy landscape [Figs. 3(a) and 5(a)], which gives rise to subdiffusion.
Since it is of great interest to characterize the diffusive behavior in the unfolded region of a trajectory, we studied the first half (from 0 to 93 ns) and the entire unfolded region (from 0 to 186 ns) in the MD simulation. Both the first half of the unfolded region (red dashed curve in Fig. 6) and the entire unfolded region (blue solid curve in Fig. 6) are less subdiffusive (HD = 0.25) than the native region (red solid curve in Fig. 6) of the trajectory. The MSD of the entire unfolded region (blue solid line in Fig. 6) in its first half repeats the behavior of half of the unfolded state (red dashed line in Fig. 6). The steeper slope at the end of the MSD curve of the entire unfolded region of the trajectory, corresponding to strong superdiffusive behavior (HD = 0.73), is an indication of long jumps that the system makes to proceed over the transition state barrier to the native state.
Most of the MSD curve of the transition region of the trajectory (blue dashed line in Fig. 6) illustrates superdiffusive behavior (HD = 0.56), as expected.
Although we observed superdiffusion in the unfolded and in the transition state, the full trajectory does not exhibit superdiffusive behavior, for the following reasons. The MSD analysis depends on the time interval over which the system travels. Since the protein spends ~ 65% of the total MD simulation time in the native state with strong subdiffusive behavior, for the trajectory considered, it is normal that superdiffusion of the MSD of the full trajectory is not observed. The above findings for the trajectory below the folding temperature, in general, coincide with the results obtained by Matsunaga et al.55
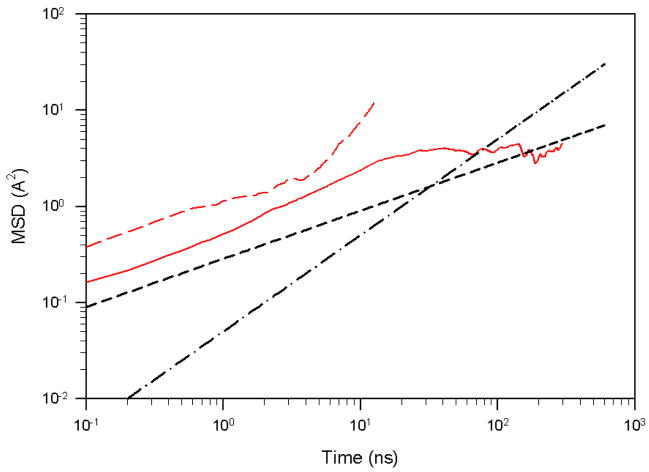
Another interesting finding in the work of Matsunaga et al.55 is that the system exhibits superdiffusive behavior for the trajectories above the folding temperature. Depending on the temperature (below or above the folding temperature), the behavior of UNRES MD trajectories is noticeably different. The folding trajectories for 1E0L at 320K and 330K exhibit quite a stable native state and, once the system folds, it remains in the native state until the end of the simulation [Fig. 2(a,b)]. At 335K, the native state is still stable, although we observe a few folding/unfolding events, Fig. 7(a), [the free energy landscape of this trajectory was illustrated in Fig. 5 (d)]. At 350K, we still observe folding/unfolding events; however, the unfolded state is more stable than the native state, Fig. 7(b), and no folding is observed in trajectories at 360K, Fig. 7(c). All these trajectories are representative of many MD trajectories that we have obtained at 335K, 350K and 360K. Similar behavior of the system was observed by the authors of the work reported in ref. 55 (private communication with Drs. Matsunaga and Komatsuzaki). Because the folding time decreases as T approaches the folding temperature from below, superdiffusion can be observed in a full trajectory even below the folding temperature. A good illustration of this behavior is shown in Fig. 8, in which we plotted the MSD along PC1 for the very fast-folding trajectory for 1E0L at 335K, which folds a few times during the entire trajectory [the rmsd as a function of time for this trajectory is illustrated in Fig. 7(a)]. The red dashed line corresponds to the MSD of the system in the time interval of first folding [~ 27.5 ns, in Fig. 7(a)], whereas the red solid line exhibits diffusive behavior of the system during the entire trajectory with few folding/unfolding events. The results reveal different diffusive behavior: for the trajectory up to first folding, we observe superdiffusive behavior (red dashed curve in Fig. 8), and for the entire trajectory the behavior is subdiffusive (red solid curve in Fig. 8). Thus, superdiffusion can be observed for a folding trajectory even at T < Tf, but again, the type of diffusion depends very much on the duration of the trajectory. Superdiffusion can easily be observed at T > Tf [Fig. 7 (b) and 7(c)] because, at these temperatures, the native state is not as stable as it is at T < Tf, and hence, it is not difficult to find folding events at short time intervals due to the large fluctuations at these temperatures.
Figure 7.
The rmsd as a function of time for MD trajectories for 1E0L at 335 K (a), at 350 K (b), and at 360 K (c).
Figure 8.
The mean square displacement of PC1 of the very fast-folding MD trajectory for 1E0L at 335K. The red dashed line illustrates the MSD of PC1 calculated for the time interval of first folding [~ 27.5 ns in Fig. 7(a)]; the red solid line is the MSD of PC1 for the full trajectory [Fig. 7(a)]; the black dashed and dash-dot lines correspond to t0.5 and t1, respectively.
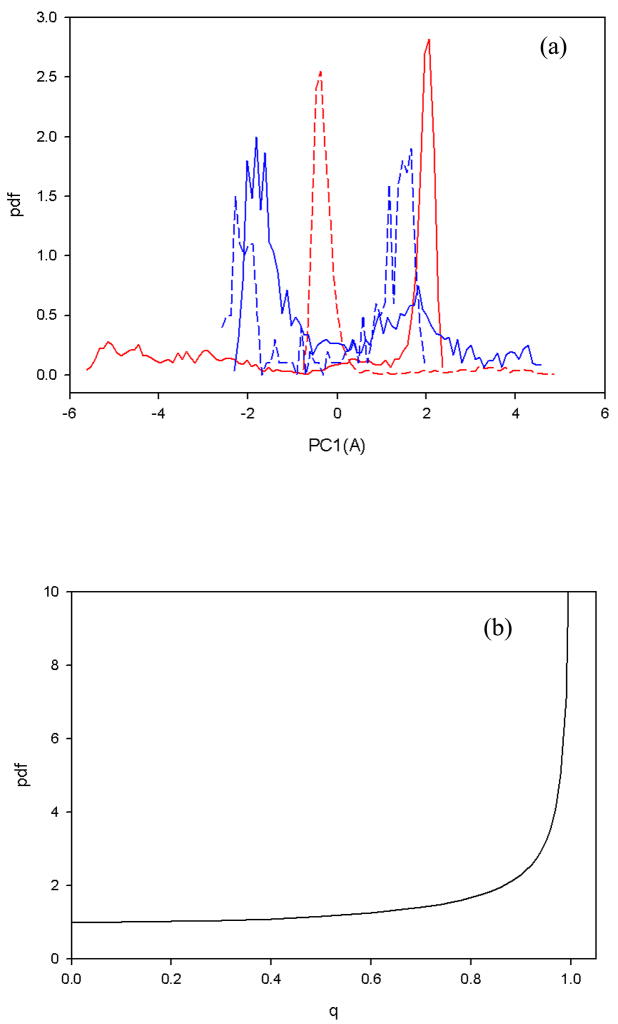
In order to strengthen these arguments about the observed superdiffusion, we have extended our studies of anomalous diffusion by analyzing the shapes of the pdf for unfolded, native, transition states, and the full trajectory. For this analysis, we selected the same fast-folding trajectory illustrated in Fig. 6. The fractional diffusion and fractional kinetic equations are useful approaches for the description of anomalous types of relaxation and diffusion processes.50,51 Particularly, the fractional diffusion equation is considered as an especially suitable tool for the description of subdiffusive processes (0 < HD < ½); whereas the diffusion processes in the domain of sub-ballistic superdiffusion (1/2 < HD < 1) can be described by a fractional kinetic equation.50 Based on an interpretation in terms of these fractional equations [see Eqs. 8(a) and 8(b) in Methods], the computed single-cusp shape (red dashed and solid lines) of the probability distribution function of the native state and the full trajectory, respectively, illustrated in Fig. 9(a), corresponds to subdiffusive behavior [0 < α < 1 in Eq. 8(a)]; the multiple-hump shape [blue dashed and solid lines in Fig. 9(a)] corresponds to the transition and unfolded state, respectively, and indicate the presence of superdiffusion in these states [0 < α < 1 in Eq. 8(b)]. Moreover, according to the fractional kinetic equation,50 when more pronounced multiple humps appear in the pdf, stronger superdiffusion is indicated. Although the end of the unfolded state exhibits much stronger superdiffusion (HD = 0.73) than the transition state (HD = 0.56), latter [blue dashed line in Fig. 9(a)] illustrates more pronounced multiple humps than the unfolded state [blue solid line in Fig. 9(a)]. The reason that the second hump in the unfolded state is less pronounced is the following: ~ 82% of the MSD curve for the transition state showed superdiffusive behavior whereas superdiffusion was exhibited only in the last quarter of the unfolded state. In order to illustrate the shapes of the pdf of the transition, unfolded, native states and the full trajectory clearly in one Figure, we made the heights of the plots of Fig. 9(a) arbitrary, because they have very different time scales.
Figure 9.
(a) The probability distribution function of PC1, computed from the fast-folding MD trajectory at 330K [Fig. 2(a)]. The red solid and dashed lines correspond to the pdf of the full trajectory and the native state, respectively; the blue solid and dashed lines correspond to the pdf of the unfolded and transition state, respectively. (b) The pdf as a function of the dimensionless q (with A =1) of the analytical cosine function of Brownian motion.
Finally, in order to explain why Brownian motion along cosine-shaped PCs shows ballistic behavior, we employed a recently derived33 pdf of a cosine function, , where q corresponds to a PC, A is an amplitude of the cosine function, and |q| < A. It is clear that P(q) differs from the Gaussian function, which is characteristic of Brownian motion, and has the shape illustrated in Fig. 9(b). The same shape for the pdf was observed for the ballistically dominated regime by Sokolov et al.,57 studying the ballistic nature of the Richardson dispersion,58 which pertains to a mean square relative separation between two particles, initially to each other, that evolves in time according to t3.
CONCLUSIONS
We have examined the dynamics of the folding of the triple β-strand WW domain from the Formin binding protein 28 (FBP), using PCA to analyze the MD trajectories generated with the coarse-grained UNRES force field. Since the UNRES model easily simulates the folding dynamics of small- and medium-size proteins, we have analyzed many fast-, slow-, and non-folding MD trajectories at different temperatures. Detailed analyses of these trajectories showed that PCA, an already-proven mathematical technique for studying MD trajectories of protein fluctuations, is a very efficient method for characterizing the general folding and non-folding features of proteins. In addition, because UNRES trajectories can encompass longer time scales, than all-atom trajectories, the coarse-grained MD trajectories enabled us to illustrate the solutions of well-known problems related to PCA, e.g., the evolution from Brownian motion to motion in the unfolded state and then in the native state, which was very difficult and sometimes impossible to describe in all-atom MD simulations. Trajectories that lead to folded structures, and those that do not, were analyzed by constructing free energy landscapes along the first two PCs. Our findings are in agreement with results obtained in earlier theoretical10 and experimental7 studies. We have shown that, in the coarse-grained trajectories examined, the first PC (sometimes the first two PCs) may contain the largest part of the total fluctuations of the system, and the dimensions of the free energy landscape can be reduced to one or two.
Anomalous diffusion in folding dynamics has been studied with the mean-square displacement. Superdiffusion was observed along the first PC in the unfolded and transition states at T = 330K. Also, superdiffusive behavior was revealed in a very fast-folding trajectory below the folding temperature of 335K, which implies that the protein is capable of folding. The validity of these findings has been checked by a fractional kinetic equation. Moreover, by analyzing the pdf of the cosine function, we explained why Brownian motion along cosine-shaped PCs cannot be normal diffusive, but is ballistic, in confirmation of the correctness of earlier findings.30
METHODS
UNRES model and simulation details
The UNRES model of polypeptide chains14,16 is illustrated in Fig. 10. A polypeptide chain is represented as a sequence of α-carbon (Cα) atoms linked by virtual Cα …Cα bonds with united peptide groups halfway between the neighboring Cα’s, and united side chains, whose sizes depend on the nature of the amino acid residues, attached to the respective Cα’s by virtual Cα …SC bonds. The effective energy is expressed by Eq. 1,59
Figure 10.
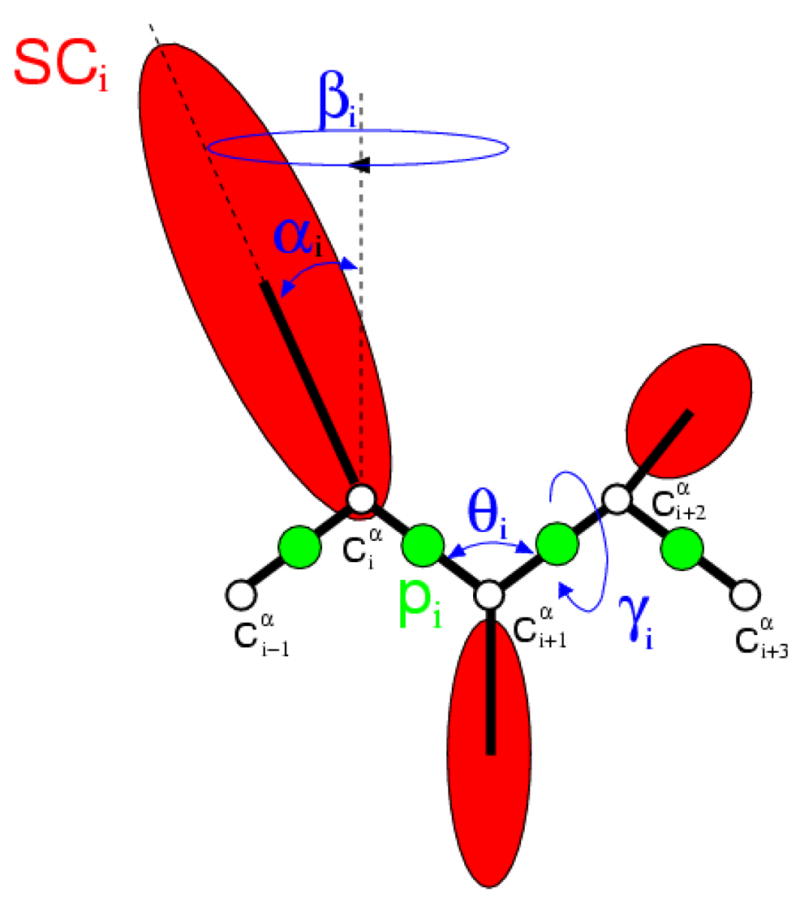
The UNRES model of polypeptide chains. The interaction sites are red side-chain centroids of different sizes (SC) and the peptide-bond centers (p) are indicated by green circles, whereas the α-carbon atoms (small empty circles) are introduced only to assist in defining the geometry. The virtual Cα···Cα bonds have a fixed length of 3.8 Ǻ, corresponding to a trans peptide group; the virtual-bond (θ) and virtual-dihedral (γ) angles are variable. Each side chain is attached to the corresponding α-carbon with a fixed “bond length”, bSCi, variable “bond angle”, αi, formed by SCi and the bisector of the angle defined by , and , and with a variable “dihedral angle”, βi, of counter-clockwise rotation about the frame.
| (1) |
with59
| (2) |
where the successive terms represent side chain-side chain, side chain-peptide, peptide-peptide, torsional, double-torsional, bond-angle bending, side-chain local (dependent on the angles α and β of Fig. 10), distortion of virtual bonds, multi-body (correlation) interactions, and formation of disulfide bridges, respectively. The w’s are the relative weights of each term. The correlation terms arise from a cumulant expansion60,61 of the restricted free energy function of the simplified chain obtained from the all-atom energy surface by integrating out the secondary degrees of freedom. The temperature-dependent factors defined by Eq. 2 and introduced in our recent work59 reflect the fact that the UNRES effective energy is an approximate cumulant expansion of the restricted free energy. The virtual-bond vectors are the variables used in molecular dynamics.
The version of the UNRES force field implemented in this work was parameterized62 using 1E0L and the engrailed homeodomain (1ENH) as the training proteins, to reproduce the experimental temperature-dependent folding free energy of these two proteins.7,63 The folding-transition temperature [calculated in ref. 62 from the results of multiplexed replica-exchange molecular dynamics (MREMD)64,65 simulations with 64 trajectories run at temperatures ranging from T = 250 to T = 480 K and processing the results of the simulations with the weighthed-histogram-analysis method (WHAM)66] was 339 K (compared to the experimental7 value of 337 K). The theory and procedure for running mesoscopic molecular dynamics with UNRES is described in our earlier work.23,24 Here, we carried out canonical molecular dynamics runs24 with the Berendsen thermostat at T = 330 K, 335 K, and 340 K, i.e., around the folding-transition temperature. The time step in molecular dynamics simulations was δt = 0.1 mtu (1 mtu = 48.9 fs is the “natural” time unit of molecular dynamics23) and the coupling parameter of the Berendsen thermostat was τ = 1 mtu.
Principal component analysis
The PCA method is based on the covariance matrix with elements Cij for coordinates i and j
| (3) |
where x1,···, x3N are the mass-weighted Cartesian coordinates of an N-particle system and 〈 〉 is the average over all instantaneous structures sampled during the simulations. The symmetric 3N × 3N matrix C can be diagonalized with an orthonormal transformation matrix R:
| (4) |
where λ1 ≥ λ2 ≥ ··· ≥ λ3N are the eigenvalues, and RT is the transpose of R. The columns of R are the eigenvectors, or the principal modes; the trajectory can be projected onto the eigenvectors to give the principal components qi(t), i = 1, …, 3N:
| (5) |
The eigenvalue λi is the mean-square fluctuation in the direction of the principal mode. The first few PCs typically describe collective, global motions of the system, with the first PC containing the largest mean-square fluctuation.
Since we study the coarse-grained MD trajectories, in PCA we replaced the Cartesian coordinates by UNRES backbone coordinates(θi, γj),
| (6) |
where i = 1, …, N and j = 1, …, N−1, are the numbers of θ and γ angles, respectively. As shown by Mu et al.39 and Altis et al.,67 such a transformation from the space of backbone angles to a linear metric coordinate space allows us to avoid potential problems due to the periodicity of the angles.
The cosine content for principal component i is defined as30,31,33,40
| (7) |
where T is the length of the simulation, and the number of periods of the cosine function is equal to half of the principal component index.31
Fractional diffusion and fractional kinetic equations
The fractional diffusion and fractional kinetic equations, which are very useful for describing sub- and superdiffusive processes, respectively, have the following forms50,51
| (8a) |
| (8b) |
where P(x,t) is the pdf of being at a certain position x at time t, Ka and K2−a are diffusion constants, and and are the Reimann-Liouville operators defined through the following relations:50,51
| (9a) |
| (9b) |
| (9c) |
The MSD, 〈x2(t)〉, associated with Eqs. 8a and 8b, has the following forms:50,51
| (10a) |
| (10b) |
where Γ is the gamma function. The MSD associated with the fractional kinetic equation shows ballistic and Browniam motion when α → 0 and α → 1, respectively. The solutions for the propagators of Eq. 8a and 8b in computable form are obtained by the series:50,51
| (11a) |
| (11b) |
The P(x,t) in Eq. 11a shows a cusp shape, which corresponds to subdiffusion; however, when α → 1, the pdf has a Gaussian shape (normal diffusion). The P(x,t) in Eq. 11b exhibits the shapes of multiple humps, which corresponds to superdiffusion but, for α → 1, it shows a Gaussian shape. The larger that 2 − α becomes, the more pronounced and sharper are the humps.50
Acknowledgments
This work was supported by grants from the National Institutes of Health (GM-14312), the National Science Foundation (MCB05-41633), and the Fogarty Foundation (TW7193). This research was conducted by using the resources of (a) our 880-processor Beowulf cluster at the Baker Laboratory of Chemistry and Chemical Biology, Cornell University, (b) the National Science Foundation Terascale Computing System at the Pittsburgh Supercomputer Center, (c) the John von Neumann Institute for Computing at the Central Institute for Applied Mathematics, Forschungszentrum Juelich, Germany, (d) the Beowulf cluster at the Department of Computer Science, Cornell University, (e) the resources of the Center for Computation and Technology at Louisiana State University, which is supported by funding from the Louisiana legislature (f) our 45-processor Beowulf cluster at the Faculty of Chemistry, University of Gdańsk, (g) the Informatics Center of the Metropolitan Academic Network (IC MAN) in Gdańsk, and (h) the Interdisciplinary Center of Mathematical and Computer Modeling (ICM) at the University of Warsaw.
Footnotes
Publisher's Disclaimer: This is a PDF file of an unedited manuscript that has been accepted for publication. As a service to our customers we are providing this early version of the manuscript. The manuscript will undergo copyediting, typesetting, and review of the resulting proof before it is published in its final citable form. Please note that during the production process errors may be discovered which could affect the content, and all legal disclaimers that apply to the journal pertain.
References
- 1.Macias MJ, Gervais V, Civera C, Oschkinat H. Structural analysis of WW domains and design of a WW prototype. Nat Struct Biol. 2000;7:375–379. doi: 10.1038/75144. [DOI] [PubMed] [Google Scholar]
- 2.Serpell LC. Alzheimer’s amyloid fibrils: structure and assembly. Biochim Biophys Acta. 2000;1502:16–30. doi: 10.1016/s0925-4439(00)00029-6. [DOI] [PubMed] [Google Scholar]
- 3.Pruisner SB. Prions. Proc Natl Acad Sci USA. 1998;95:13363–13383. doi: 10.1073/pnas.95.23.13363. [DOI] [PMC free article] [PubMed] [Google Scholar]
- 4.Sudol M. The WW domain binds polyprolines and is involved in human diseases. Exp Mol Med. 1996;28:65–69. [Google Scholar]
- 5.Passani LA, Bedford MT, Faber PW, McGinnis KM, Sharp AH, Gusella JF, Vonsattel JP, MacDonald ME. Huntingtin’s WW domain partners in Huntington’s disease post-mortem brain fulfill genetic criteria for direct involvement in Huntington’s disease pathogenesis. Human Mol Gen. 2000;9:2175–2182. doi: 10.1093/hmg/9.14.2175. [DOI] [PubMed] [Google Scholar]
- 6.Ilslay JL, Sudol M, Winder SJ. The WW domain: linking cell signaling to the membrane cytoskeleton. Cell Signal. 2002;14:183–189. doi: 10.1016/s0898-6568(01)00236-4. [DOI] [PubMed] [Google Scholar]
- 7.Nguyen H, Jäger M, Moretto A, Gruebele M, Kelly JW. Tuning the free-energy landscape of a WW domain by temperature, mutation, and truncation. Proc Natl Acad Sci USA. 2003;100:3948–3953. doi: 10.1073/pnas.0538054100. [DOI] [PMC free article] [PubMed] [Google Scholar]
- 8.Karanicolas J, Brooks CL., III The structural basis for biphasic kinetics in the folding of the WW domain from a formin-binding protein: Lessons for protein design? Proc Natl Acad Sci USA. 2003;100:3954–3959. doi: 10.1073/pnas.0731771100. [DOI] [PMC free article] [PubMed] [Google Scholar]
- 9.Karanicolas J, Brooks CL., III Integrating folding kinetics and protein function: Biphasic kinetics and dual binding specificity in a WW domain. Proc Natl Acad Sci USA. 2004;101:3432–3437. doi: 10.1073/pnas.0304825101. [DOI] [PMC free article] [PubMed] [Google Scholar]
- 10.Mu Y, Nordenskiold L, Tam JP. Folding, misfolding, and amyloid protofibril formation of WW domain FBP28. Biophys J. 2006;90:3983–3992. doi: 10.1529/biophysj.105.076406. [DOI] [PMC free article] [PubMed] [Google Scholar]
- 11.Day R, Daggett V. All-atom simulations of protein folding and unfolding. Adv Protein Chem. 2003;66:373–403. doi: 10.1016/s0065-3233(03)66009-2. [DOI] [PubMed] [Google Scholar]
- 12.Bradley P, Chivian D, Meiler J, Misura KMS, Rohl CA, Schief WR, Wedemeyer WJ, Schueler-Furman O, Murphy P, Schonbrun J, Strauss CEM, Baker D. Rosetta predictions in CASP5: Successes, failures, and prospects for complete automation. Proteins. 2003;53:457–468. doi: 10.1002/prot.10552. [DOI] [PubMed] [Google Scholar]
- 13.Skolnick J, Zhang Y, Arakaki AK, Kolinski A, Boniecki M, Szilagyi A, Kihara D. TOUCHSTONE: A unified approach to protein structure prediction. Proteins. 2003;53:469–479. doi: 10.1002/prot.10551. [DOI] [PubMed] [Google Scholar]
- 14.Scheraga HA, Liwo A, Ołdziej S, Czaplewski C, Pillardy J, Ripoll DR, Vila JA, Kazmierkiewicz R, Saunders JA, Arnautova YA, Jagielska A, Chinchio M, Ninias M. The protein folding problem: global optimization of force fields. Front Biosci. 2004;9:3296–3323. doi: 10.2741/1482. [DOI] [PubMed] [Google Scholar]
- 15.Liwo A, Pincus MR, Wawak RJ, Rackovsky S, Scherega HA. Prediction of protein conformation on the basis of a search for compact structures; test on avian pancreatic polypeptide. Protein Sci. 1993;2:1715–1731. doi: 10.1002/pro.5560021016. [DOI] [PMC free article] [PubMed] [Google Scholar]
- 16.Liwo A, Ołdziej S, Pincus MR, Wawak RJ, Rackowsky S, Scheraga HA. A united-residue force field for off-lattice protein-structure simulations. I Functional forms and parameters of long-range side-chain interaction potentials from protein crystal data. J Comput Chem. 1997;18:849–873. [Google Scholar]
- 17.Liwo A, Ołdziej S, Czaplewski C, Kozlowska U, Scheraga HA. Parametrization of backbone-electrostatic and multibody contributions to the UNRES force field for protein-structure prediction from ab initio energy surfaces of model systems. J Phys Chem B. 2004;108:9421–9438. [Google Scholar]
- 18.Ołdziej S, Liwo A, Czaplewski C, Pillardy J, Scheraga HA. Optimization of the UNRES force field by hierarchical design of the potential-energy landscape. 2 Off-lattice tests of the method with single proteins. J Phys Chem B. 2004;108:16934–16949. [Google Scholar]
- 19.Ołdziej S, Lagiewka J, Liwo A, Czaplewski C, Chinchio M, Nanias M, Scheraga HA. Optimization of the UNRES force field by hierarchical design of the potential-energy landscape. 3 Use of many proteins in optimization. J Phys Chem B. 2004;108:16950–16959. [Google Scholar]
- 20.Hardin C, Eastwood MP, Prentiss M, Luthey-Schulten Z, Wolynes PG. Folding funnels: The key to robust protein structure prediction. J Comput Chem. 2002;23:138–146. doi: 10.1002/jcc.1162. [DOI] [PubMed] [Google Scholar]
- 21.Liwo A, Arlukowicz P, Czaplewski C, Ołdziej S, Pillardy J, Scheraga HA. A method for optimizing potential-energy functions by a hierarchical design of the potential-energy landscape: Application to the UNRES force field. Proc Natl Acad Sci USA. 2002;99:1937–1942. doi: 10.1073/pnas.032675399. [DOI] [PMC free article] [PubMed] [Google Scholar]
- 22.Lee J, Liwo A, Ripoll DR, Pillardy J, Scheraga HA. Calculation of protein conformation by global optimization of a potential energy function. Proteins. 1999;3:204–208. doi: 10.1002/(sici)1097-0134(1999)37:3+<204::aid-prot26>3.3.co;2-6. [DOI] [PubMed] [Google Scholar]
- 23.Khalili M, Liwo A, Rakowski F, Grochowski P, Scheraga HA. Molecular dynamics with the united-residue model of polypeptide chains. I Equations of motion and tests of numerical stability in the microcanonical mode. J Phys Chem B. 2005;109:13785–13797. doi: 10.1021/jp058008o. [DOI] [PMC free article] [PubMed] [Google Scholar]
- 24.Khalili M, Liwo A, Jagielska A, Scheraga HA. Molecular dynamics with the united-residue model of polypeptide chains. II Langevin and Berendsen-bath dynamics and tests on model α-helical systems. J Phys Chem B. 2005;109:13798–13810. doi: 10.1021/jp058007w. [DOI] [PMC free article] [PubMed] [Google Scholar]
- 25.Pillardy J, Czaplewski C, Liwo A, Lee J, Ripoll DR, KaŸmierkiewicz R, Ołdziej S, Wedemeyer WJ, Gibson KD, Arnautova YA, Saunders J, Ye YJ, Scheraga HA. Recent improvements in prediction of protein structure by global optimization of a potential energy function. Proc Natl Acad Sci USA. 2001;98:2329–2333. doi: 10.1073/pnas.041609598. [DOI] [PMC free article] [PubMed] [Google Scholar]
- 26.Kitao A, Hirata F, Gô N. The effects of solvent on the conformation and the collective motions of protein: Normal mode analysis and molecular dynamics simulations of melittin in water and in vacuum. Chem Phys. 1991;158:447–472. [Google Scholar]
- 27.Hayward S, Gô N. Collective variable description of native protein dynamics. Annu Rev Phys Chem. 1995;46:223–250. doi: 10.1146/annurev.pc.46.100195.001255. [DOI] [PubMed] [Google Scholar]
- 28.Balsera MA, Wriggers W, Oono Y, Schulten K. Principal component analysis and long time protein dynamics. J Phys Chem. 1996;100:2567–2572. [Google Scholar]
- 29.Kitao A, Hayward S, Gô N. Energy landscape of a native protein: jumping-among-minima model. Proteins. 1998;33:496–517. doi: 10.1002/(sici)1097-0134(19981201)33:4<496::aid-prot4>3.0.co;2-1. [DOI] [PubMed] [Google Scholar]
- 30.Hess B. Similarities between principal components of protein dynamics and random diffusion. Phys Rev E. 2000;62:8438–8448. doi: 10.1103/physreve.62.8438. [DOI] [PubMed] [Google Scholar]
- 31.Hess B. Convergence of sampling in protein simulations. Phys Rev E. 2002;65:0319101–03191010. doi: 10.1103/PhysRevE.65.031910. [DOI] [PubMed] [Google Scholar]
- 32.Tournier AL, Smith JC. Principal components of the protein dynamical transition. Phys Rev Lett. 2003;91:2081061–2081064. doi: 10.1103/PhysRevLett.91.208106. [DOI] [PubMed] [Google Scholar]
- 33.Maisuradze GG, Leitner DM. Principal component analysis of fast-folding λ-repressor mutants. Chem Phys Lett. 2006;421:5–10. [Google Scholar]
- 34.Grossfield A, Feller SE, Pitman MC. Convergence of molecular dynamics simulations of membrane proteins. Proteins. 2007;67:31–40. doi: 10.1002/prot.21308. [DOI] [PubMed] [Google Scholar]
- 35.Levy RM, Srinivasan AR, Olson WK, McCammon JA. Quasiharmonic method for studying very low frequency modes in proteins. Biopolymers. 1984;23:1099–1112. doi: 10.1002/bip.360230610. [DOI] [PubMed] [Google Scholar]
- 36.Garcia AE. Large-amplitude nonlinear motions in proteins. Phys Rev Lett. 1992;68:2696–2699. doi: 10.1103/PhysRevLett.68.2696. [DOI] [PubMed] [Google Scholar]
- 37.Garcia AE, Hummer G. Conformational dynamics of cytochrome c: correlation to hydrogen exchange. Proteins. 1999;36:175–191. [PubMed] [Google Scholar]
- 38.Amadei A, Linssen ABM, Berendsen HJC. Essential dynamics of proteins. Proteins. 1993;17:412–425. doi: 10.1002/prot.340170408. [DOI] [PubMed] [Google Scholar]
- 39.Mu Y, Nguyen PH, Stock G. Energy landscape of a small peptide revealed by dihedral angle principal component analysis. Proteins. 2005;58:45–52. doi: 10.1002/prot.20310. [DOI] [PubMed] [Google Scholar]
- 40.Maisuradze GG, Leitner DM. Free energy landscape of a biomolecule in dihedral principal component space: sampling convergence and correspondence between structures and minima. Proteins. 2007;67:569–578. doi: 10.1002/prot.21344. [DOI] [PubMed] [Google Scholar]
- 41.Frauenfelder H, Sligar SG, Wolynes PG. The energy landscapes and motions of proteins. Science. 1991;254:1598–1603. doi: 10.1126/science.1749933. [DOI] [PubMed] [Google Scholar]
- 42.Brooks CL, III, Onuchic JN, Wales DJ. Taking a walk on a landscape. Science. 2001;293:612–613. doi: 10.1126/science.1062559. [DOI] [PubMed] [Google Scholar]
- 43.Wales DJ. Energy Landscapes. Cambridge University Press; Cambridge: 2003. [Google Scholar]
- 44.Gruebele M. The fast protein folding problem. Annu Rev Phys Chem. 1999;50:485–516. doi: 10.1146/annurev.physchem.50.1.485. [DOI] [PubMed] [Google Scholar]
- 45.Myers JK, Oas TG. Mechanisms of fast protein folding. Annu Rev Biochem. 2002;71:783–815. doi: 10.1146/annurev.biochem.71.110601.135346. [DOI] [PubMed] [Google Scholar]
- 46.Yang WY, Gruebele M. Folding at the speed limit. Nature. 2003;423:193–197. doi: 10.1038/nature01609. [DOI] [PubMed] [Google Scholar]
- 47.Karplus M, McCammon JA. Molecular dynamics simulations of biomolecules. Nat Struct Biol. 2002;9:646–652. doi: 10.1038/nsb0902-646. [DOI] [PubMed] [Google Scholar]
- 48.Brooks CL., III Protein and peptide folding explored with molecular simulations. Acc Chem Res. 2002;35:447–454. doi: 10.1021/ar0100172. [DOI] [PubMed] [Google Scholar]
- 49.Granakaran S, Nymeyer H, Portman JJ, Sanbonmatsu KY, Garcia AE. Peptide folding simulations. Curr Opin Struct Biol. 2003;13:168–174. doi: 10.1016/s0959-440x(03)00040-x. [DOI] [PubMed] [Google Scholar]
- 50.Metzler R, Klafter J. Accelerating Brownian motion: A fractional dynamics approach to fast diffusion. Europhys Lett. 2000;51:492–498. [Google Scholar]
- 51.Metzler R, Klafter J. The random walk’s guide to anomalous diffusion: A fractional dynamics approach. Phys Rep. 2000;339:1–77. [Google Scholar]
- 52.Noguti T, Gô N. Structural basis of hierarchical multiple substates of a protein. IV: Rearrangments in atom packing and local determinations. Proteins. 1989;5:125–131. doi: 10.1002/prot.340050206. [DOI] [PubMed] [Google Scholar]
- 53.Hegger R, Altis A, Nguyen PH, Stock G. How complex is the Dynamics of peptide folding? Phys Rev Lett. 2007;98:0281021–0281024. doi: 10.1103/PhysRevLett.98.028102. [DOI] [PubMed] [Google Scholar]
- 54.Viswanathan GM, Boldyrev SV, Havlin S, Da Luz MGE, Raposo EP, Stanley HE. Optimizing the success of random searches. Nature. 1999;401:911–914. doi: 10.1038/44831. [DOI] [PubMed] [Google Scholar]
- 55.Matsunaga Y, Li CB, Komatsuzaki T. Anomalous diffusion in folding dynamics of minimalist protein landscape. Phys Rev Lett. 2007;99:2381031–2381034. doi: 10.1103/PhysRevLett.99.238103. [DOI] [PubMed] [Google Scholar]
- 56.Yang H, Luo LG, Karnchanaphanurach P, Louie TM, Rech I, Cova S, Xun L, Xie XS. Protein Conformational Dynamics Probed by Single-Molecule Electron Transfer. Science. 2003;302:262–266. doi: 10.1126/science.1086911. [DOI] [PubMed] [Google Scholar]
- 57.Sokolov IM, Klafter J, Blumen A. Ballistic versus diffusive pair dispersion in the Richardson regime. Phys Rev. 2000;61:2717–2722. [Google Scholar]
- 58.Richardson LF. Atmospheric diffusion shown on a distance-neighbour graph. Proc R Soc London Ser A. 1926;110:709–737. [Google Scholar]
- 59.Liwo A, Khalili M, Czaplewski C, Kalinowski S, Ołdziej S, Wachucik K, Scheraga HA. Modification and optimization of the united-residue (UNRES) potential energy function for canonical simulations. I Temperature dependence of the effective energy function and tests of the optimization method with single training proteins. J Phys Chem B. 2007;111:260–285. doi: 10.1021/jp065380a. [DOI] [PMC free article] [PubMed] [Google Scholar]
- 60.Kubo R. Generalized cumulant expansion method. J Phys Soc Japan. 1962;17:1100–1120. [Google Scholar]
- 61.Liwo A, Czaplewski C, Pillardy J, Scheraga HA. Cumulant-based expressions for the multibody terms for the correlation between local and electrostatic interactions in the united-residue force field. J Chem Phys. 2001;115:2323–2347. [Google Scholar]
- 62.Liwo A, Czaplewski COłdziej S, Kozłowska U, Makowski M, Kalinowski S, KaŸmierkiewicz R, Shen H, Maisuradze G, Scheraga HA. Optimization of a physics-based united-residue force field (UNRES) for protein folding simulations. In: Muenster G, Wolf D, Kremer M, editors. NIC Series, NIC Symposium. Vol. 38. Juelich, Germany: 2008. pp. 63–69. [Google Scholar]
- 63.Mayor U, Grossman JG, Foster NW, Freund SMV, Fersht AR. The denaturated state of engrailed homeodomain under denaturating and native conditions. J Mol Biol. 2003;333:977–991. doi: 10.1016/j.jmb.2003.08.062. [DOI] [PubMed] [Google Scholar]
- 64.Rhee YM, Pande VS. Multiplexed-replica exchange molecular dynamics method for protein folding simulation. Biophys J. 2003;84:775–786. doi: 10.1016/S0006-3495(03)74897-8. [DOI] [PMC free article] [PubMed] [Google Scholar]
- 65.Nanias M, Czaplewski C, Scheraga HA. Replica exchange and multicanonical algorithms with the coarse-grained united-residue (UNRES) force field. J Chem Theor Comput. 2006;2:513–528. doi: 10.1021/ct050253o. [DOI] [PMC free article] [PubMed] [Google Scholar]
- 66.Kumar S, Bouzida D, Swendsen RH, Kollman PA, Rosenberg JM. The weighted histogram analysis method for free-energy calculations on biomolecules. I. The method J Comput Chem. 1992;13:1011–1021. [Google Scholar]
- 67.Altis A, Nguyen PH, Hegger R, Stock G. Dihedral angle principal component analysis of molecular dynamics simulations. J Chem Phys. 2007;126:2441111–24411110. doi: 10.1063/1.2746330. [DOI] [PubMed] [Google Scholar]


