

Abstract
Mathematical models have recently been used to predict the future burden of multidrug-resistant tuberculosis (MDRTB)1-3. These models suggest the threat of multidrug resistance to TB control will depend on the relative ‘fitness’ of MDR strains and imply that if the average fitness of MDR strains is considerably less than that of drug-sensitive strains, the emergence of resistance will not jeopardize the success of tuberculosis control efforts. Multidrug resistance in M. tuberculosis is conferred by the sequential acquisition of a number of different single-locus mutations that have been shown to have heterogeneous phenotypic effects. Here we model the impact of initial fitness estimates on the emergence of MDRTB assuming that the relative fitness of MDR strains is heterogeneous. We find that even when the average relative fitness of MDR strains is low and a well-functioning control program is in place, a small subpopulation of a relatively fit MDR strain may eventually outcompete both the drug-sensitive strains and the less fit MDR strains. These results imply that current epidemiological measures and short-term trends in the burden of MDRTB do not provide evidence that MDRTB strains can be contained in the absence of specific efforts to limit transmission from those with MDR disease.
Tuberculosis (TB) is a global health emergency that demands concerted management efforts. Recent World Health Organization reports reveal that MDRTB is a substantial problem in every region evaluated4. However, the impact of the emergence of multidrug-resistant (MDR) strains on global TB control remains unclear. Throughout much of the world, control strategies include case detection through sputum microscopy and standardized treatment regimens administered without drug sensitivity testing. Although this approach is effective in managing TB that is drug-sensitive or resistant to one antibiotic, it neither detects nor cures the majority of cases of MDRTB.
This exclusive focus on drug-sensitive and monoresistant tuberculosis arises from two considerations. The first is the cost and complexity of detecting and treating drug-resistant tuberculosis, and the second is the perception that drug-resistant pathogens are less likely to cause epidemics than drug-sensitive ones. This perception is based on the observation that mutations that confer resistance often alter gene products important for the pathogen's survival and thus exact a ‘fitness cost’5.
Mathematical models have been developed to describe the transmission dynamics and the impact of interventions for many infectious diseases6,7, including drug-sensitive8-11 and drug-resistant tuberculosis1-3,12. Previous work on the population dynamics of drug resistance has shown that the fitness of drug-resistant strains is a key determinant of the future burden of drug-resistant pathogens in general13,14 and specifically of drug-resistant TB1 and MDRTB2,3. When the average fitness of MDR strains is assumed to be substantially less than drug-sensitive strains, these models predict that the emergence of multidrug resistance will not jeopardize the success of control efforts that focus on the treatment of drug-sensitive disease.
The reproductive fitness of an individual strain of M. tuberculosis is a complex characteristic determined by the bacterium's ability to infect a susceptible host, persist and proliferate, and be transmitted to a secondary host. Laboratory studies comparing the relative fitness of drug-resistant and drug-sensitive organisms through competition assays have found that although some mutations compromise growth and the ability to survive oxidative stress15, others have minimal in vitro effects. Furthermore, when fitness costs were detected, they were often short-lived because compensatory mutations rapidly accumulated to restore biological function16. The results of empirical studies that have compared the reproductive potential of drug-resistant and drug-sensitive strains in human populations have been similarly heterogeneous; some reports indicate that drug-resistant strains of M. tuberculosis spread less readily than drug-sensitive strains17, whereas others show no difference in disease transmission18.
Despite the heterogeneity in the fitness of MDR strains suggested by the studies cited, previous models of the transmission dynamics of drug-resistant TB have assumed a single fixed value of average fitness for MDR strains. Given that drug-resistant strains of M. tuberculosis show a range of fitness19, we constructed a model that incorporates the emergence of multidrug resistance during therapy, heterogeneity of fitness of MDR strains, and competition during an epidemic (Fig. 1). Following previous TB models, we assumed that susceptible individuals are infected at a rate that is proportional to the prevalence of people with active disease; once infected, individuals progress to disease through a fast route (primary disease) or a slow route (reactivation), and individuals who are infected but do not have active disease may become reinfected (exogenous reinfection). To incorporate competition between MDR and drug-sensitive organisms, we modeled three distinct strains: one that is drug-sensitive and two MDR strains that differ in relative fitness compared to the drug-sensitive strain. The ‘unfit’ MDR strain (designated by subscript ‘U’) has a low fitness (0.3) relative to the drug-sensitive strain, whereas the ‘fit’ MDR strain (subscript ‘F’) has a relative fitness that ranges from 0.8 and 1.2 (Table 1). As evidence suggests that most mutations conferring a MDR phenotype will incur an initial fitness cost, we assumed that mutation leads to the unfit MDR phenotype (aU) 100 times as often as the fit MDR phenotype (aF).
Figure 1.
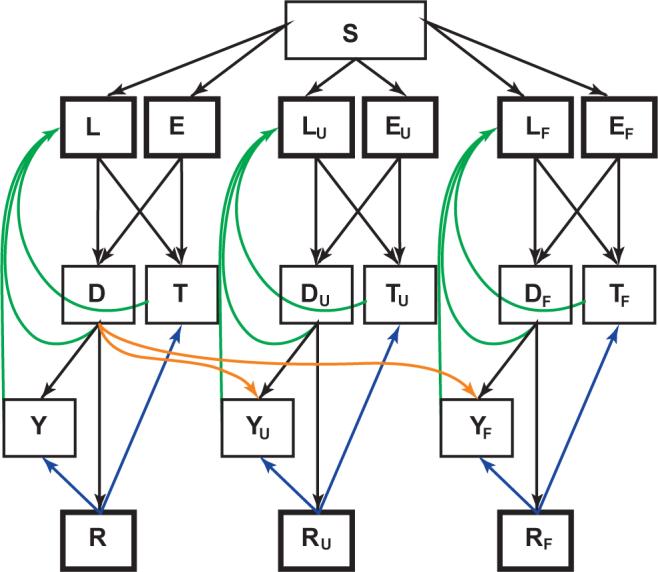
Multistrain tuberculosis model structure. Boxes represent state variables; the flow between states is described by the differential equations in Methods. States of infection with MDR strains are identified by subscript ‘U’ (‘unfit’ MDR strain) and ‘F’ (‘fit’ MDR strain). Heavy boxes indicate states from which individuals can be reinfected. Orange arrows indicate multidrug resistance acquired through failed therapy, green arrows represent self-cure and blue arrows represent relapse from drug cure. S, susceptible to infection; L, latent infection, slow progression; E, latent infection, fast progression; T, infectious TB, undetected; D, infectious TB, detected; Y, infectious TB, failed therapy; R, cured by drugs.
Table 1.
Definition and values of model parameters
| Parameter | Definition | Unstructured treatment | DOTS-like treatment strategy |
|---|---|---|---|
| μ | Birth/non-TB death rate per year | 0.02 | |
| β | Transmission rate constanta | 0.0000085 | |
| cU | Fitness cost for ‘unfit’ MDR strain | 0.7 | |
| cF | Fitness cost for ‘fit’ MDR strain | Ranges between 0.2 and −0.2 | |
| p | Proportion of those infected who are fast progressorsb | 0.14 | |
| m | Partial immunity afforded by previous infectionb | 0.65 | |
| τ1 | Rate of progression from latency to active disease per yearb | 0.000113 | |
| τ2 | Rate of progression for fast progressors per yearb | 0.88 | |
| ϕ | TB-specific death rate per yearb | 0.3 | |
| σ | Rate of self-cure per yearb | 0.2 | |
| κ | Rate at which detected individuals are treated and classified as either cures or failures per year | 0.083 | |
| f | Proportion of cases identified and treated | 0.5 | 0.7 |
| g | Treatment efficacy for drug-sensitive TB20,21 | 0.5 | 0.85 |
| gR | Treatment efficacy for drug-resistant TB (either fit or unfit)22 | 0.28 | 0.47 |
| aU | Proportion of drug-sensitive treatment failures acquiring ‘unfit’ resistant TB | 0.03 | 0.01 |
| aF | Proportion of drug-sensitive treatment failures acquiring ‘fit’ resistant TB | 0.0003 | 0.0001 |
| δ | Rate of relapse from chemotherapeutic cure per year | 0.001 | |
We initially modeled the course of a drug-sensitive tuberculosis epidemic prior to the introduction of combination chemotherapy. This simulation yielded measures of disease consistent with those from selected high-burden regions (Table 2a). We then modeled a 30-year period before the introduction of Directly Observed Treatment, Short-course (DOTS) treatment, during which drugs were available, but detection and cure rates reflected the suboptimal program performance reported before the implementation of the DOTS strategy. We estimated that approximately 3% of those with initially drug-sensitive disease who fail pre-DOTS treatment acquired multidrug resistance (Table 1). The results of this simulation reflect the current epidemiology observed in high-burden countries (Table 2b). These results also show that the early course of the MDRTB epidemic is insensitive to the relative fitness of the MDR phenotype, with negligible differences in the estimated burden of drug-sensitive or MDRTB over a wide range of fitness costs.
Table 2.
Model fit and simulation results
| a Epidemiology of tuberculosis before drug introduction | ||
|---|---|---|
| Measurea | Observed | Model results |
| Proportion of the population with latent infection23 | >90% over age 11 (Vienna, 1909) | 82% |
| >80% of 13−14-year-olds (Prague) | ||
| |
44−79% of 18-year-olds (Europe, 1948−1951) |
|
| Prevalence of smear positive TB23 | Average 200−300 cases/100,000 | 1,649/100,000b |
| |
Range 150−950/100,000 (Africa and Asia, late 1950s) |
|
| TB mortality23 | 600/100,000 per year (London, 1800) | 494/100,000 |
| 650/100,000 per year (Alaska, 1928−1932) | ||
| 380/100,000 per year (Czechoslovakia, 1900) | ||
| |
200/100,000 per year (The Netherlands, 1900) |
|
| Proportion of all deaths which are due to TB23 | 35% (Alaska, 1930) | 20% |
| 10% (Germany, 1901) | ||
| 5% (Germany, 1938) | ||
| b Current tuberculosis epidemiology from selected high-burden countries24 and model simulation results | ||||||||
|---|---|---|---|---|---|---|---|---|
| Model simulationsc | ||||||||
| Cambodia | China | India | Russia | S. Africa | RF=80% | RF=100% | RF=120% | |
| Proportion with latent infection (sensitive and MDR) | 66% | 31% | 46% | 22% | 39% | 65% | 65% | 65% |
| Proportion with latent MDR infection | 0.2% | 0.2% | 0.2% | |||||
| Detected smear positive TB prevalence/100,000 | 492 | 82 | 215 | 229 | 93 | 234d | 235d | 235d |
| Prevalence of infectious TB/100,000 | 464 | 464 | 465 | |||||
| Proportion of detected TB that is MDR25 | Median for 28 countries and regions = 2.2% (95% CI 1.1−3.8) | 2.1% | 2.2% | 2.4% | ||||
| Proportion of total TB that is MDR | 1.3% | 1.4% | 1.6% | |||||
| TB deaths/100,000 | 131 | 19 | 40 | 165 | 24 | 104 | 104 | 104 |
We assume that all infections and disease are due to drug-sensitive strains prior to the introduction of antibiotics.
The model result is for both detected and undetected cases. Additionally, the model results include all infectious TB cases (not only those who are sputum smear-positive).
RF = relative fitness of the ‘fit’ MDR strain compared with the drug-sensitive strain.
Includes all infectious cases (not only those who are sputum smear-positive).
To explore the long-term dynamics of MDRTB, we then modeled the implementation of the DOTS program beginning 30 years after the initiation of unstructured treatment. We assumed case detection and cure rates for drug-sensitive disease consistent with World Health Organization goals21, improved treatment efficacy for MDR disease and a reduced proportion of those acquiring the multidrug-resistant phenotype through failed treatment (Table 1). As was observed in many countries that saw significant reductions in TB incidence after antibiotics became available, drug-sensitive disease is rapidly brought under control through the implementation of DOTS. In contrast to the short-term results discussed above, the simulated long-term course of tuberculosis epidemics depends critically on the relative fitness of MDR strains (Fig. 2).
Figure 2.

Sensitivity of long-term projections of MDRTB epidemics to the relative fitness of MDR strains. Colored traces represent infection and disease with the MDR strains; black traces represent infection and disease with the drug-sensitive strain. Colors represents the projected course of the epidemic given an assumption about the relative fitness of the ‘fit’ MDR strain (red: cF = −0.2; orange: cF = −0.1; green: cF = 0; blue: cF = 0.1; pink: cF = 0.2). (a) Proportion of population with latent TB infections over time. (b) Prevalence of infectious TB over time. (c) Evolution of mean fitness of extant MDR strains toward the relative fitness of the ‘fit’ MDR strain.
In this simulation, almost all of the MDR cases generated early in the course of the epidemic harbor the unfit strain; thus, the average fitness is low. When the prevalence of drug-sensitive tuberculosis is reduced through the implementation of DOTS, the impact of acquired drug-resistance on the emerging MDR epidemic becomes less important and the predominant driving force of incident MDR infections shifts to the transmission of MDR strains. Consequently, the fitness difference between the circulating strains becomes the primary determinant of new infections and interstrain competition leads to the ascent of the most transmissible strains (Fig. 2c).
The model demonstrates that even when the most fit MDR strain is assumed to be less fit than the drug-sensitive strain, the MDR strain will eventually outcompete the drug-susceptible strain (Fig. 2b). However, there exists a fitness threshold for the ‘fit’ MDR strain below which multidrug-resistant disease will not continue to spread as long as DOTS treatment goals are met. In these simulations, this threshold is exceeded when the most fit MDR strains are greater than 70% as fit as the drug-sensitive strains.
This model makes several simplifying assumptions. First, because the relationship between contact patterns and the spread of airborne infections is not well understood, we modeled the population as a homogenously mixing unit. Although this is oversimplified, we based this decision on molecular epidemiological data that suggest substantial transmission of TB occurs following casual contact with infectious TB cases26 and contact tracing fails to identify most secondary cases27. Second, we modeled the acquisition of multidrug resistance as a single-step process despite the fact that MDR is acquired through sequential accumulation of point mutations. Because monoresistant strains are thus included in the drug-sensitive (non-MDR) population, we may have underestimated the relative fitness of MDR strains in comparison to the non-MDR strains in the model. Finally, we modeled tuberculosis dynamics in a limited set of scenarios consistent with epidemiological data from developing countries. Recent work demonstrates that tuberculosis dynamics are highly sensitive to the rate of infection and suggests that it may not be possible to generalize our results to the setting of a developed country in which the incidence and prevalence of tuberculosis are declining28.
Our model suggests that despite a short-term decline in the tuberculosis burden following the implementation of DOTS, the exclusive treatment of drug-sensitive and monoresistant tuberculosis may contribute to the emergence of MDR disease in at least two ways: (i) treatment directly contributes to the pool of MDR cases through acquired resistance, albeit at much lower rates under DOTS than pre-DOTS programs, and (ii) the removal of infectious individuals with predominantly drug-sensitive disease decreases the force of infection and subsequently replenishes the pool of individuals who are fully susceptible to infection with circulating MDR strains.
Previous studies suggest that the fitness of MDR strains is heterogeneous. We demonstrate that future burden of MDRTB is more dependent on the distribution of fitness among circulating strains than on the initial average reproductive fitness. We show that even if highly transmissible MDR strains are only rarely generated through poor treatment, MDRTB may eventually become a major public health threat. Our simulations indicate that DOTS policies should be coupled with strategies to limit the spread of MDRTB (for example, DOTS-plus29) in order to mitigate the long-term threat of MDR disease. Although an optimal approach would include the concurrent administration of high-quality DOTS programs and the introduction of second-line drug therapy for those with MDRTB, limited resources have made this difficult to achieve. How this combined approach can best be implemented in resource-constrained settings is a topic for urgent operational research.
METHODS
Model structure
Our deterministic compartmental model is described by the set of ordinary differential equations shown in Supplementary Methods.
Individuals are born susceptible to infection (S) and then may be infected with a circulating strain of M. tuberculosis. The strain-specific infection rate is proportional to the prevalence of individuals with active disease due to that strain and a strain-specific transmission parameter β (1 – c), where c denotes the fitness ‘cost’ of the particular resistance phenotype of that strain. Thus, for the drug-sensitive strain, c = 0. In this formulation, β is proportional to the probability of a transmission event conditional on contact with an infectious individual and inversely proportional to the population size; thus β has units of persons−1time−1.
A proportion (p) of the infected individuals transitions into a rapidly progressive state (E, EU and EF), while the remaining infected individuals (1 – p) transition to a latent state (L, LU, and LF). Those with latent infections progress to active disease at rate τ1, considerably slower than those in the rapidly progressive state who transition to active disease at rate τ2.
A proportion of those developing active disease (f) is detected and treated (D, DU and DF), while the remaining individuals (1 – f) with active disease remain undetected and untreated (T, TU and TF). Those detected are processed and treated at rate κ. Of those with drug-sensitive disease who are treated, a proportion g are cured while 1 – g fail. Those who fail may develop drug resistance; a proportion of these (aU) acquires the ‘unfit’ MDR strain (YU), while a much smaller proportion (aF) acquires the ‘fit’ MDR strain (YF). Those detected but not yet treated (D, DU and DF) and treatment failures (Y, YU and YF) continue to be infectious.
Individuals with active disease self-cure at rate σ; we assume that those who self-cure transition back into the corresponding latently infected state (L, LU or LF) and thus remain at risk for reactivation. Treatment cures (R, RU and RF) relapse to disease at rate δ. A proportion (f) of these relapses are detected and will be classified as treatment failures (Y, YU and YF) while the remaining relapses (1 – f) remain undetected (T, TU and TF).
Except for those with active disease, all individuals with a history of infection may be reinfected by another circulating strain. Prior infection affords partial immunity m to reinfection with any strain. Previous models demonstrate that exogenous reinfection of individuals plays an important role in tuberculosis epidemics in high-incidence areas10 and epidemiologic studies confirm that reinfection is common in settings where transmission is intense30.
Individuals die at a fixed mortality rate μ; those with active disease will also die at an increased tuberculosis-specific rate ϕ. All deaths are replaced by births into the susceptible state.
Modeling the fitness cost of drug resistance
The dynamics of the MDR strains differ from the drug-sensitive strain in two ways: the three strains have different transmission parameters and the proportion of MDR cases cured on therapy (gR) is smaller than the proportion of drug-sensitive cases cured (g). We modeled different fitness costs for each of the two MDR strains, but assumed that treatment efficacy is equivalent for both MDR strains. Although the MDR phenotype results from the stepwise accumulation of mutations, we collapsed the parameters describing these sequential mutations into a single step in a manner similar to that of other modelers2,3. This reflects the fact that monoresistant strains can be controlled by the therapeutic regimens used in DOTS and consequently will exhibit the same dynamics as do sensitive strains under this strategy. For our base model, the values for all other parameters that describe the natural progression of disease were identical for each of the three strains. Although our base model assumes that the cost of fitness is entirely captured by reducing the transmissibility of MDR tuberculosis, additional analyses demonstrate that MDR strains also outcompete drug-sensitive strains in projected tuberculosis epidemics when fitness costs are instead exacted from the rates of disease progression (data not shown).
Baseline model prior to the introduction of antituberculosis drugs
We used the historical data on the epidemiological indices of tuberculosis infection and disease to calibrate the transmission parameter, β (Table 2). Because β is parameterized as persons−1 time−1, our fitted β reflects the choice of population under study. To facilitate comparison with other models, we arbitrarily report the β for a population size of 1 million (Table 1) and modeled the introduction of a single case of drug-susceptible tuberculosis into a hypothetical population of 1 million individuals, allowing tuberculosis infection and disease to equilibrate. We used time steps of 0.1 year and an Euler integration method.
ACKNOWLEDGMENTS
We thank M. Lipsitch, B. Cooper, M. Becerra and M. Smurzynski for critical reviews of a draft of this manuscript.
Footnotes
Note: Supplementary information is available on the Nature Medicine website.
COMPETING INTERESTS STATEMENT The authors declare that they have no competing financial interests.
References
- 1.Blower SM, Gerberding JL. Understanding, predicting and controlling the emergence of drug- resistant tuberculosis: a theoretical framework. J. Mol. Med. 1998;76:624–636. doi: 10.1007/s001090050260. [DOI] [PubMed] [Google Scholar]
- 2.Dye C, Williams BG. Criteria for the control of drug-resistant tuberculosis. Proc. Natl. Acad. Sci. USA. 2000;97:8180–8185. doi: 10.1073/pnas.140102797. [DOI] [PMC free article] [PubMed] [Google Scholar]
- 3.Dye C, Espinal MA. Will tuberculosis become resistant to all antibiotics? Proc. R. Soc. Lond. B. Biol. Sci. 2001;268:45–52. doi: 10.1098/rspb.2000.1328. [DOI] [PMC free article] [PubMed] [Google Scholar]
- 4.World Health Organization . Anti-tuberculosis drug resistance in the world, report #3. WHO; Geneva: 2004. [Google Scholar]
- 5.Andersson DI, Levin BR. The biological cost of antibiotic resistance. Curr. Opin. Microbiol. 1999;2:489–493. doi: 10.1016/s1369-5274(99)00005-3. [DOI] [PubMed] [Google Scholar]
- 6.Anderson RM, May RM. Infectious Diseases of Humans: Dynamics and Control. Oxford University Press; Oxford: 1991. [Google Scholar]
- 7.Grenfell BT, Anderson RM. Pertussis in England and Wales: an investigation of transmission dynamics and control by mass vaccination. Proc. R.. Soc. Lond. B Biol. Sci. 1989;22:213–252. doi: 10.1098/rspb.1989.0022. [DOI] [PubMed] [Google Scholar]
- 8.Blower SM, Small PM, Hopewell PC. Control strategies for tuberculosis epidemics: new models for old problems. Science. 1996;273:497–500. doi: 10.1126/science.273.5274.497. [DOI] [PubMed] [Google Scholar]
- 9.Blower SM, et al. The intrinsic transmission dynamics of tuberculosis epidemics. Nat. Med. 1995;1:815–821. doi: 10.1038/nm0895-815. [DOI] [PubMed] [Google Scholar]
- 10.Vynnycky E, Fine PE. The natural history of tuberculosis: the implications of age-dependent risks of disease and the role of reinfection. Epidemiol. Infect. 1997;119:183–201. doi: 10.1017/s0950268897007917. [DOI] [PMC free article] [PubMed] [Google Scholar]
- 11.Dye C, Garnett GP, Sleeman K, Williams BG. Prospects for worldwide tuberculosis control under the WHO DOTS strategy: Directly observed short-course therapy. Lancet. 1998;352:1886–1891. doi: 10.1016/s0140-6736(98)03199-7. [DOI] [PubMed] [Google Scholar]
- 12.Castillo-Chavez C, Feng Z. To treat or not to treat: the case of tuberculosis. J. Math. Biol. 1997;35:629–656. doi: 10.1007/s002850050069. [DOI] [PubMed] [Google Scholar]
- 13.Schrag SJ, Perrot V, Levin BR. Adaptation to the fitness costs of antibiotic resistance in Escherichia coli. Proc. R. Soc. Lond. B Biol. Sci. 1997;264:1287–1291. doi: 10.1098/rspb.1997.0178. [DOI] [PMC free article] [PubMed] [Google Scholar]
- 14.Lipsitch M, Levin BR. The population dynamics of antimicrobial chemotherapy. Antimicrob. Agents Chemother. 1997;41:363–373. doi: 10.1128/aac.41.2.363. [DOI] [PMC free article] [PubMed] [Google Scholar]
- 15.Ordway DJ, Sonnenberg MG, Donahue SA, Belisle JT, Orme IM. Drug-resistant strains of Mycobacterium tuberculosis exhibit a range of virulence for mice. Infect. Immun. 1995;63:741–743. doi: 10.1128/iai.63.2.741-743.1995. [DOI] [PMC free article] [PubMed] [Google Scholar]
- 16.Sherman DR, et al. Compensatory ahpC gene expression in isoniazid-resistant Mycobacterium tuberculosis. Science. 1996;272:1641–1643. doi: 10.1126/science.272.5268.1641. [DOI] [PubMed] [Google Scholar]
- 17.Garcia-Garcia ML, et al. Clinical consequences and transmissibility of drug-resistant tuberculosis in southern Mexico. Arch. Intern. Med. 2000;160:630–636. doi: 10.1001/archinte.160.5.630. [DOI] [PubMed] [Google Scholar]
- 18.Teixeira L, et al. Infection and disease among household contacts of patients with multidrug-resistant tuberculosis. Int. J. Tuberc. Lung Dis. 2001;5:321–328. [PubMed] [Google Scholar]
- 19.Cohen T, Sommers B, Murray M. The effect of drug resistance on the fitness of Mycobacterium tuberculosis. Lancet Infect. Dis. 2003;3:13–21. doi: 10.1016/s1473-3099(03)00483-3. [DOI] [PubMed] [Google Scholar]
- 20.Khatri GR, Frieden TR. Controlling tuberculosis in India. N. Engl. J. Med. 2002;347:1420–1425. doi: 10.1056/NEJMsa020098. [DOI] [PubMed] [Google Scholar]
- 21.World Health Organization . Guidelines for national programmes. WHO/CDS/TB/97.220; Geneva: 1997. Treatment of tuberculosis. WHO report. [Google Scholar]
- 22.Espinal MA, et al. Standard short-course chemotherapy for drug-resistant tuberculosis: treatment outcomes in 6 countries. JAMA. 2000;283:2537–2545. doi: 10.1001/jama.283.19.2537. [DOI] [PubMed] [Google Scholar]
- 23.Styblo K. Epidemiology of Tuberculosis: Selected Papers. Royal Netherlands Tuberculosis Association; The Hague: 1991. [Google Scholar]
- 24.Dye C, Scheele S, Dolin P, Pathania V, Raviglione MC. Consensus statement. Global burden of tuberculosis: estimated incidence, prevalence, and mortality by country. WHO Global Surveillance and Monitoring Project. JAMA. 1999;282:677–686. doi: 10.1001/jama.282.7.677. [DOI] [PubMed] [Google Scholar]
- 25.Espinal MA, et al. Global trends in resistance to antituberculosis drugs. World Health Organization-International Union against Tuberculosis and Lung Disease Working Group on Anti-Tuberculosis Drug Resistance Surveillance. N. Engl. J. Med. 2001;344:1294–1303. doi: 10.1056/NEJM200104263441706. [DOI] [PubMed] [Google Scholar]
- 26.Verver S, et al. Transmission of tuberculosis in a high incidence urban community in South Africa. Int. J. Epidemiol. 2004;33:351–357. doi: 10.1093/ije/dyh021. [DOI] [PubMed] [Google Scholar]
- 27.Small PM, et al. The epidemiology of tuberculosis in San Francisco: A population-based study using conventional and molecular methods. N. Engl. J. Med. 1994;330:1703–1709. doi: 10.1056/NEJM199406163302402. [DOI] [PubMed] [Google Scholar]
- 28.Murray CJ, Salomon JA. Modeling the impact of global tuberculosis control strategies. Proc. Natl. Acad. Sci. USA. 1998;95:13881–13886. doi: 10.1073/pnas.95.23.13881. [DOI] [PMC free article] [PubMed] [Google Scholar]
- 29.Farmer P, Kim JY. Community based approaches to the control of multidrug resistant tuberculosis: introducing “DOTS-plus”. BMJ. 1998;317:671–674. doi: 10.1136/bmj.317.7159.671. [DOI] [PMC free article] [PubMed] [Google Scholar]
- 30.van Rie A, et al. Exogenous reinfection as a cause of recurrent tuberculosis after curative treatment. N. Engl. J. Med. 1999;341:1174–1179. doi: 10.1056/NEJM199910143411602. [DOI] [PubMed] [Google Scholar]