

Abstract
Objective
To determine the ability of ErbB inhibitors to reduce the growth of vestibular schwannoma (VS) xenografts.
Methods
VS xenografts were established in the interscapular fat pad in nude mice for 4 weeks. Initially, a small cohort of animals was treated with the ErbB2 inhibitor, trastuzumab, or saline for 2 weeks. Animals also received BrdU injections to label proliferating cells. In a longer-term experiment, animals were randomized to receive trastuzumab, erlotinib (an ErbB kinase inhibitor), or placebo for 12 weeks. Tumor growth was monitored by magnetic resonance imaging (MRI) over the treatment period. Cell death was analyzed by terminal dUTP nick end labeling (TUNEL).
Results
Tumors could be distinguished with T2 weighted MRI sequences. Trastuzumab significantly reduced the proliferation of VS cells compared to control (p<0.01) as determined by BrdU uptake. Control tumors demonstrated slight growth over the 12 week treatment period. Both trastuzumab and erlotinib significantly reduced the growth of VS xenografts (p<0.05). Erlotinib, but not trastuzumab, resulted in a significant increase in the percent of TUNEL-positive VS cells (p<0.01).
Conclusions
In this preliminary study, the ErbB inhibitors trastuzumab and erlotinib decreased growth of VS xenografts in nude mice raising the possibility of using ErbB inhibitors in the management of patients with schwannomas, particularly those with neurofibromatosis type 2.
Keywords: acoustic neuroma, apoptosis, cell proliferation, magnetic resonance imaging
INTRODUCTION
Vestibular schwannomas (VS) result from mutations in the tumor suppressor gene, merlin or schwannomin, and occur in two forms; sporadic, isolated tumors and bilateral tumors occurring in patients with the genetic disease neurofibromatosis type 2 (NF2) (1-4). Current management of VSs is limited to observation with serial imaging, stereotactic radiosurgery or radiotherapy (SRS/SRT), and microsurgical removal (5-8). While these therapies are generally well tolerated they occasionally result in deafness, facial paralysis, spinal fluid leak, continued tumor growth, or even malignant transformation (9-14). VSs arising in patients with NF2 are particularly difficult to manage (15). Most patients develop deafness and other cranial and spinal neuropathies and many ultimately succumb to their disease (16). Discovery of alternative therapies that limit the growth of schwannomas may be of particular benefit to patients with NF2 (4,15,17).
Understanding the role of the merlin protein in Schwann cell (SC) homeostasis should help guide the development of alternative therapies for patients with schwannomas (3,4). Merlin mediates contact inhibition of cell growth and in many cells suppresses the activity of intracellular signaling cascades implicated in tumor formation including Ras-mitogen activated protein kinase/extracellular regulated kinase (ERK) kinase (MEK)-ERK, phosphatidylinositol-3-kinase (PI3K)/Akt, and c-Jun N-terminal kinase (JNK) (18-24).
In addition to these intracellular kinases, merlin regulates the subcellular localization and activity of receptor tyrosine kinases (25) including the epidermal growth factor receptor (EGFR), or ErbB, family of tyrosine kinases (26). Like their SC counterparts, VS cells uniformly express ErbB2 and ErbB3, with a subset also expressing EGFR, or ErbB1, and ErbB4 (27-29). A recent study found increased mRNA expression for ErbB1 and ErbB2 in most VSs and that ErbB1 expression levels correlates with tumor size (30). In normal SCs, merlin is implicated in the cytoplasmic sequestration of ErbB2 in response to cell-cell contact (26). However, in VS cells ErbB2 constitutively resides in portions of the cell membrane known as lipid rafts and is active (28,29). This lipid raft localization of ErbB2 in VS cells mirrors the movement of ErbB2 into lipid rafts in proliferating, denervated SCs following axotomy (31). Thus, ErbB receptors represent a potential target for therapies to limit VS growth (27-30,32). Given their involvement in a number of different tumors, several ErbB inhibitors have been developed and are used clinically (33).
Here we tested the efficacy of two ErbB inhibitors on VS growth in a xenograft model of human VSs using nude mice. We report that trastuzumab, a humanized anti-ErbB2 monoclonal antibody, and erlotinib, an inhibitor of ErbB1 and ErbB2 kinase activity (34), both reduce the growth of VS xenografts as measured by magnetic resonance imaging (MRI) over a 3-month interval. Erlotinib, but not trastuzumab, resulted in increased VS cell death in these xenografts. Thus, ErbB inhibitors serve as potential novel therapies for the treatment of schwannomas.
MATERIALS AND METHODS
Vestibular Schwannoma Xenografts
Xenografts were developed in male athymic Ncr Nu/Nu mice (National Cancer Institute, NIH, Bethesda, MD) from VS specimens derived from four separate patients. All patients provided written, informed consent for use of tumor harvested at time of surgery. The institutional review board at the University of Iowa approved the study protocol and the University of Iowa Institutional Animal Care and Use Committee approved all animal protocols. Mice were housed in a barrier room and watered and fed rodent chow freely.
Acutely resected VS specimens were transported to the laboratory in ice cold Hank’s Balanced Salt Solution (Invitrogen, Calsbad, CA), cut into approximately 10 mm3 fragments, and placed into the interscapular fat pad in nude mice anesthetized with ketamine (100 mg/kg, Hospira, Lake Forest, IL) and xylazine (10 mg/kg Phoenix Scientific, St. Joseph, MO). The grafts were allowed to develop for 4 weeks prior to initiating any treatment.
Measurement of tumor volume
Tumor volume was determined by magnetic resonance imaging (MRI). Mice were removed from the barrier facility and imaged in a small animal MRI (Varian Unity/INOVA 4.7 Tesla scanner, Varian Inc., Palo Alto, CA). T2- weighted images were acquired in the axial and sagittal planes by placing an anesthetized mouse inside a 37.5 mm diameter transmit/receive volume coil. Slice thickness was 0.5 mm in each plane. To calculate the tumor volume, the surface area of the tumor on each sequential image was determined using the measurement tool on Image J software (NIH, Bethesda, MD) by drawing a region of interest encompassing the tumor. The reviewer was blinded to the experimental group. The measurements were repeated three times in both the axial and sagittal planes and the average tumor surface area was multiplied by the slice thickness (0.5 mm) to calculate the slice volume. Slice volumes were halved for the initial and final slices of each imaging series. Slice volumes were then summed for total tumor volume. We also calculated total tumor volumes using the entire volume of the initial and final slices for each series. This did not affect the overall results of the experiments. To calculate the relative tumor growth, the initial tumor volume (Vi) was substracted from the final tumor volume (Vf) and the difference was divided by Vi ([Vf-Vi]/Vi) to account for differences in initial xenograft volumes. There was no significant difference in the relative tumor growth rates of the trastuzumab control and erlotinib control animals and the data from these animals were pooled.
Treatment with ErbB inhibitors
A total of 19 mice bearing human VS xenografts derived from 4 separate patients were analyzed in this study. Table 1 presents the distribution of VS specimens used for these studies. In a preliminary experiment, 4 mice were implanted with VSs derived from two patients and were randomly divided into two groups four weeks after tumor implantation. Two mice received trastuzumab (25 mg/kg in 0.25 ml normal saline i.p., Genentech, South San Francisco, CA) three times per week for two weeks while two animals received saline injections. During the final week of treatment, all mice were injected with BrdU (50 mg/kg i.p., Sigma-Aldrich, St. Louis, MO) daily to label dividing cells. After the two-week treatment interval, the xenografts were harvested and fixed in 4% paraformaldehyde (Sigma-Aldrich, St. Louis, MO).
For the longer-term experiment, the xenografts were derived from 2 additional VSs and initial images with MRI were obtained four weeks after tumor implantation. Following the initial MRI, the mice were returned to a quarantine room where they were randomly divided into three groups of 5 animals each (15 total). One group received trastuzumab (25 mg/kg i.p.) three times per week. This is similar to trastuzumab doses shown to inhibit growth of xenografts derived from human carcinomas that overexpress ErbB2 (35,36). The second group was gavage fed erlotinib (50 mg/kg, Genentech, South San Francisco, CA), five days a week. This is similar to erlotinib doses shown to reduce growth of xenografts derived from non-small cell lung cancer and malignant nerve sheath tumors (37,38). Erlotinib was suspended in a solution of 0.5% methyl cellulose (MP Biomedicals, Solon, OH) and 0.4% Tween-80 (Fischer Scientific, Pittsburgh, PA). The final group of mice served as controls. In this group, three animals were gavage fed erlotinib vehicle and two animals received saline injections for trastuzumab control. Treatment continued for 12 weeks. Following completion of the treatment, the mice were once again imaged to determine final tumor volume and the xenografts were harvested and fixed in 4% paraformaldehyde.
Immunofluorescence and TUNEL staining
Following fixation, the xenografts were washed in phosphate buffered saline (PBS) and cryoprotected in 30% sucrose. The samples were then embedded in optimum cutting temperature (OCT) compound (Thermo Fischer Scientific, Waltham, MA) and cryosectioned at 10-15 μm. Frozen sections from the preliminary group of animals were treated with 2N HCl for 30 min, permeabilized with 0.8% Triton-X100 in PBS for 20 min, and then blocked with blocking buffer (5% goat serum, 2% bovine serum albumin, and 0.8% Triton-X100) for 30 min. Next, the samples were incubated in mouse monoclonal anti-BrdU (1:800, Sigma-Aldrich, St. Louis, MO) and rabbit anti-S100 (1:800, Sigma-Aldrich, St. Louis, MO) diluted in blocking buffer for 2h at 37°C. Following several washes in PBS, secondary antibodies (anti-mouse Alexa Fluor 568 and anti-rabbit Alexa Fluor 488, 1:800 each, Invitrogen, Carlsbad, CA) diluted in PBS were applied for 1 h at room temperature. Nuclei were then labeled with Hoechst 3342 (10 μg/ml, Invitrogen, Carlsbad, CA) for 10 min and the slides were mounted and coverslipped. Frozen sections from the longer-term groups of animals were labeled with anti-S100 antibody as above. Following immunostaining, terminal dUTP nick end labeling (TUNEL) was performed as previously described (39) and the nuclei were labeled with Hoechst 3342. Digital images were captured on a Leica DMIRE2 epifluorescence microscope (Bannockburn, IL) equipped with a CCD camera and Leica FW4000 software.
Determination of cell proliferation and cell death
Cell proliferation was determined by assaying BrdU uptake in xenograft frozen sections as previously described (31). The number of BrdU-positive S100-positive cells was determined from digital images from five randomly selected 30x microscopic fields (331±108 VS cell nuclei/30x field, mean±SD) for each of 3 frozen sections/xenograft (fifteen 30x microscopic fields/xenograft). The average percent of BrdU-positive VS cells was determined for each xenograft. The investigator was blinded to treatment conditions.
Cell death was determined using TUNEL to identify apoptotic VS cells as previously described (39). The number of TUNEL-positive S100-positive nuclei was determined from five randomly selected 30x microscopic fields for each of 3 frozen sections/xenograft and the average percent of TUNEL-positive cells was determined for each xenograft. The investigator was blinded to treatment conditions.
Statistical Analysis
Differences in cell proliferation and cell death were analyzed by Student’s two-tailed t-test using Excel software (Microsoft, Redmond, WA). Differences in relative tumor growth were analyzed by one-way analysis of variance (ANOVA) followed by a post-hoc Kruskal-Wallis test using SigmaStat (Systat Incorporated, Richmond, CA).
Reagents
Trastuzumab was a generous gift from Genentech (South San Francisco, CA). Erlotinib, ketamine, and xylazine were obtained from the University of Iowa Hospitals and Clinics pharmacy. All other reagents were from Sigma-Aldrich (St. Louis, MO) unless otherwise specified.
RESULTS
Tumor imaging and cell proliferation
To test the ability of ErbB inhibitors to limit VS growth, we used a xenograft model by transplanting fragments of freshly excised VSs into the interscapular subcutaneous fat of nude mice. Initially, we performed a proof of principle experiment to verify that cells in the xenografts remained viable and were capable of dividing. We also tested the efficacy of trastuzumab to reduce VS cell proliferation in these xenografts since it has already been shown to reduce VS cell proliferation in vitro (29). Xenografts were allowed to establish for 4 weeks in 4 nude mice. Figure 1 shows representative MRI imaging of xenografts 4 weeks after transplantation. Figure 1 also shows a frozen section immunolabeled with the Schwann cell marker anti-S100 antibody and Hoechst (nuclear stain). This section was taken from the edge of the graft to illustrate the specificity of S100 immunolabeling for viable tumor cells compared with the cells comprising the tumor capsule that fail to label with anti-S100 antibody.
Figure 1.
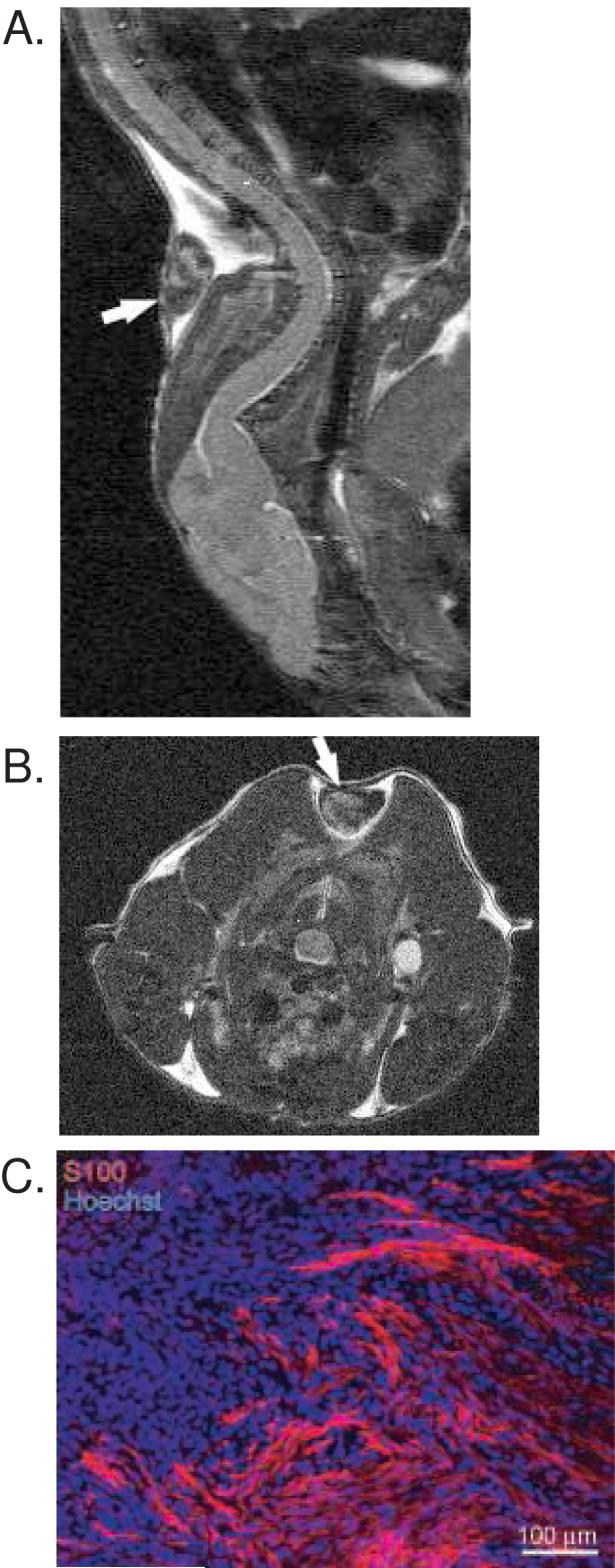
Human vestibular schwannoma xenograft in nude mice. A and B. MRI of xenografts in sagittal (A) and axial (B) planes demonstrating survival of xenografts one month after implantation. Arrows indicate xenografts. C. Immunofluorescent labeling of xenograft frozen section with anti-S100 antibody followed by Alexa 568 (red) secondary antibody. Nuclei are labeled with Hoechst. This section is taken near the capsule, or edge, of the specimen demonstrating the S100 labeling of viable tumor cells and the lack of S100 labeling in the capsule cells.
After 4 weeks, the animals were randomly assigned to receive trastuzumab (25 mg/kg three times/week for 2 weeks) (2 animals) or saline injections (2 control animals). All animals were also injected with BrdU daily for the final 7 days prior to sacrifice to allow identification of dividing cells. Cell proliferation was determined by counting the number of BrdU-positive, S100-positive VS cell nuclei from frozen sections (Fig. 2). The results represent the average percent of BrdU-positive VS cells for each animal. There was a statistically significant reduction in the percent of BrdU-positive VS cells in xenografts from trastuzumab treated animals (0.040%±0.029% mean±SD) compared to those from control animals (0.201%±0.026%, mean±SD) (p<0.028, Student’s two-tailed t-test) in the 2 week trial.
Figure 2.
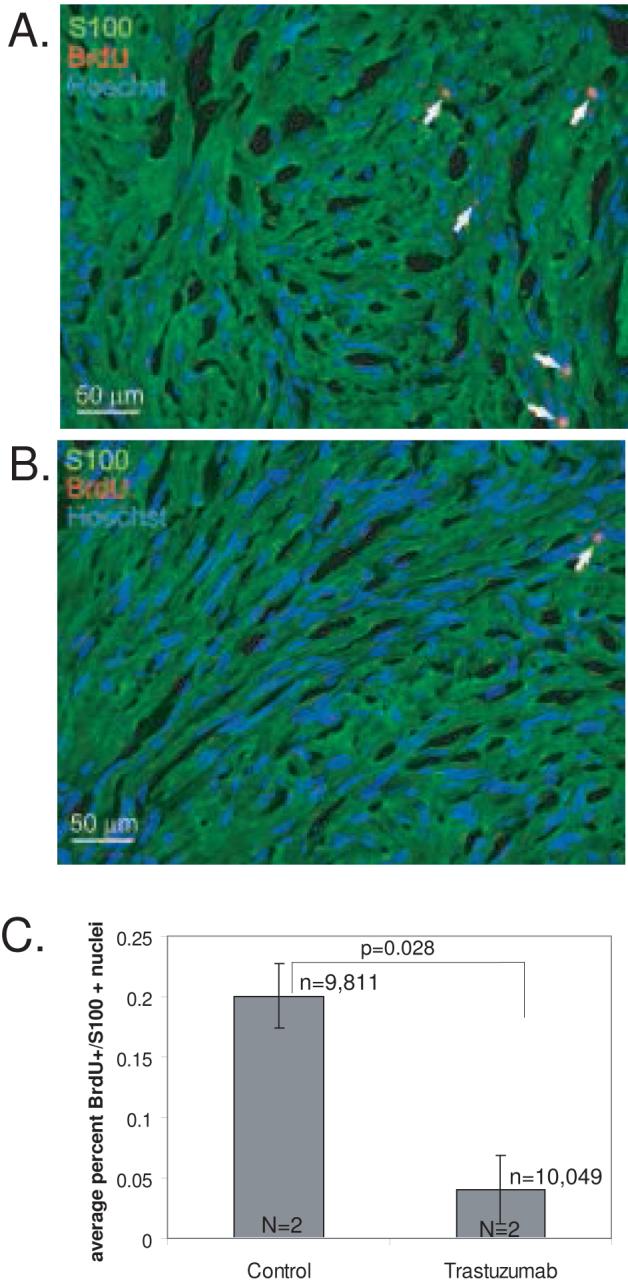
Trastuzumab inhibits cell proliferation in vestibular schwannoma (VS) xenografts. A and B. Nude mice bearing VS xenografts were treated with saline (A, control) or trastuzumab (B) for 2 weeks. The animals received daily injections of BrdU to allow identification of proliferating cells. Representative images of xenograft frozen sections immunolabeled with anti-BrdU and anti-S100 antibodies with Alexa 568 (red, BrdU-positive) and Alexa 488 (green, S100-positive) conjugated secondary antibodies respectively are shown. Nuclei were labeled with Hoechst (blue). Arrows indicate TUNEL-positive nuclei. Scale bar=50 μm. C. The average number of BrdU-positive, S100-positive nuclei was determined for each condition from 5 random selected fields from 3-4 sections/xenograft from 2 separate animals for each group. Trastuzumab significantly reduced BrdU uptake in these xenografts (p<0.01, Student’s two-tailed t-test). Error bars represent standard error. n=total number of VS cells scored for each condition. N=total number of xenografts analyzed for each condition.
Tumor response to ErbB inhibitors
Having demonstrated that the xenografts remained viable 4 weeks after implantation and that we could image them with MRI, we performed a second experiment with a separate group of 15 animals to determine if ErbB inhibition could reduce the growth of the xenografts. Initial MRIs were taken 4 weeks after implantation (Fig. 1). The animals were then randomized to receive trastuzumab, erlotinib, or placebo (the carrier compounds for the pharmaceutical agents) for 12 weeks. Following treatment the animals were re-imaged and the xenografts harvested to evaluate for cell death. One tumor in the erlotinib treated group did not appear on the final MRI.
Relative tumor growth was determined by comparing the difference in tumor volumes between the initial and final MRI images normalized to the initial tumor volume. Control animals demonstrated a slight increase in relative tumor volume (0.23±0.15, mean±SE) while trastuzumab (-0.32±0.09, mean±SE) and erlotinib (-0.50±0.16, mean±SE) resulted in reduction in tumor volume (Fig. 3). The difference in tumor growth was statistically significant between control and trastuzumab (p=0.025, one way ANOVA followed by Kruskal-Wallis) and erlotinib (p=0.017) treated animals, but was not significantly different between either treatment group (p=0.375).
Figure 3.
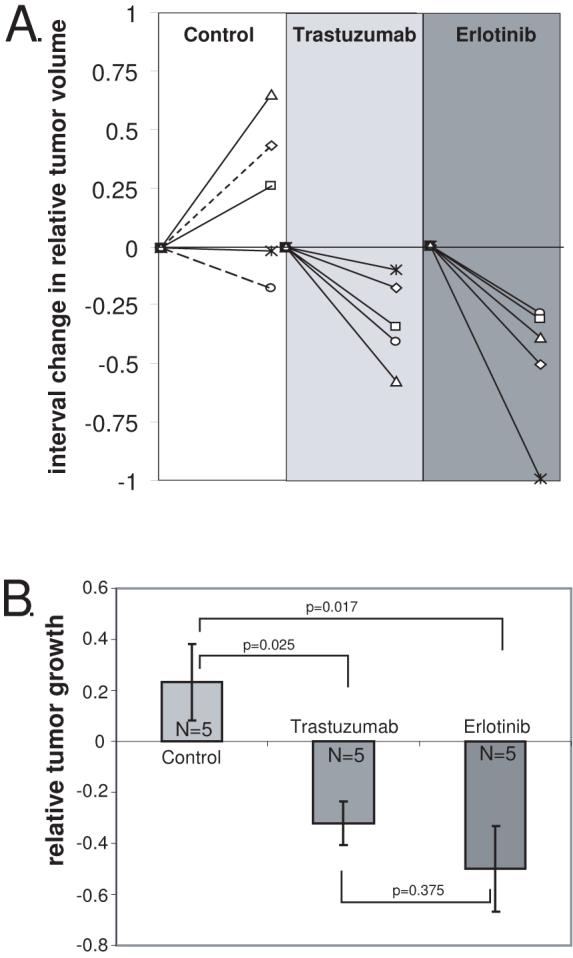
Trastuzumab and Erlotinib reduce the growth of VS xenografts. A. The change in relative tumor volume was determined by subtracting the initial tumor volume (Vi) from the final tumor volume (Vf) and dividing the difference by the initial tumor volume according to the formula: (Vf-Vi)/Vi and is plotted for the 12 week interval for each xenograft. Dashed lines in control group represent animals receiving saline while solid lines represent animals receiving erlotinib vehicle. B. The average relative growth of the xenografts for each condition is plotted.. Differences among the means for the treatment groups were determined by one-way ANOVA followed by a Kruskal-Wallis test. Error bars represent standard error. Both trastuzumab (p=0.025) and erlotinib (p=0.017) reduced the growth of the VS xenografts compared with controls.
In Figure 3, control animals (n=5) receiving saline injections (n=2) or erlotinib vehicle by gavage (n=3) were pooled since there was no known biological effect of either placebo and there was no statistical difference (p=0.65) in relative tumor growth for animals receiving saline (0.13±0.3, mean±SE) or erlotinib vehicle (0.32±0.28, mean±SE). If we analyze the data without pooling the control animals, the mean relative tumor growth in animals receiving erlotinib is statistically less than animals receiving ertoltinib vehicle (p=0.01, Student’s two-tailed t-test). Similarly, the mean relative tumor growth in animals receiving trastuzumab trended less than animals receiving saline injections (p=0.09, Student’s two-tailed t-test).
Erlotinib induces cell death in VS xenografts
Treatment with ErbB inhibitors caused a reduction in the final tumor volume compared with the initial volume raising the possibility that the inhibitors may cause death of the VS cells. To examine this possibility we stained frozen sections of the xenografts with TUNEL which labels apoptotic nuclei. There was no significant difference in the percentage of TUNEL positive cells between xenografts from animals receiving trastuzumab injections (0.24% ± 0.04%, mean ± SE) compared with saline injected animals (0.29% ± 0.09%, mean ± SE). However, tumor sections harvested from animals treated with erlotinib demonstrated a significant increase in the percentage of TUNEL positive cells compared to the placebo controls (p<0.01, Student’s two-tailed t-test). This control group demonstrated 0.36% ± 0.06% (mean ± SE) TUNEL positive VS cells compared with 0.76% ±0.14% (mean ± SE) for the erlotinib treated group.
DISCUSSION
In this preliminary study involving a small cohort of animals we demonstrate that ErbB inhibitors reduce the growth of VS xenografts. These encouraging results need to be replicated with tumors derived from a larger group of patients and in other models of VS disease. Nevertheless, they identify a systemic therapy capable of reducing VS growth in vivo and are particularly relevant to patients with NF2 who often suffer multiple cranial and spinal neuropathies due to schwannoma growth.
In this study we did not screen the tumors for merlin mutations and thus it is not possible to determine if the effects seen here are mutation specific (40-43). Likewise, the expression of ErbB receptors was not determined in these tumors as the entire xenograft specimen was consumed in cell proliferation and death analyses. However, several studies confirm that VSs universally express both ErbB2 and ErbB3, similar to their Schwann cell counterparts (27-30,32). Significantly, ErbB2 is activated in VSs and drives cell proliferation.(27-29,32) The extent of ErbB1 and ErbB4 expression in VSs is less clear yet a recent study suggests that ErbB1 expression correlates with tumor size (30).
Models of vestibular schwannomas and NF2 disease
Representative models to evaluate therapeutic agents for VSs and NF2 are lacking. Several investigators have developed VS xenograft models (44-47). In general, these tumors grow very slowly, mimicking their behavior in patients (7,48). Similarly, in our study, control tumors demonstrated slight growth over a three-month interval. Thus, sophisticated and sensitive imaging modalities are required to detect small differences in tumor growth (44). Here we used T2 weighted MRI sequences which were able to clearly delineate tumor volumes.
Transgenic animals represent an alternative model of NF2 disease. Heterozygous mice carrying germline mutations in merlin (Nf2-/Nf2+) develop osteosarcomas and liver tumors but fail to develop schwannomas (49,50). Mice carrying biallelic targeted deletion of merlin exon 2 in SCs develop SC hyperplasia and peripheral nerve schwannomas that can be imaged with MRI, representing a potential model to evaluate therapies aimed at reducing schwannoma formation or growth (51-53). However, these mice do not appear to develop VSs. Cell cultures allow for higher through put screening and complement animal models. Of particular relevance to the results of these experiments, trastuzumab reduces cell proliferation in primary VS cultures derived from human patients (29).
In addition to tumor imaging, we also analyzed the proliferative capacity of VS cells in these xenografts. Consistent with their slow growth rates, we found that only 0.2% of VS cells incorporated BrdU in control animals treated with daily doses of BrdU for 7 days. By comparison, approximately 0.5% of denervated eighth nerve SCs in rats incorporate BrdU after 4 systemic doses (Provenzano, et. al., unpublished data) suggesting that the proliferative rate of VS cells is somewhat comparable to that of denervated SCs. This low proliferative rate is consistent with the slow tumor growth observed on MRI and with the clinical behavior of most VSs in humans.
Potential therapies for NF2
Understanding the cellular and molecular events contributing to schwannoma formation and growth will help guide the development of novel therapies. Recent studies have identified many of the signaling molecules that are regulated by merlin and are implicated in tumor formation. In particular, several intracellular kinases are inhibited by merlin including ERK, Akt, JNK, PAK (18-24) Since dysregulated activity of these kinases contributes to neoplasia, several inhibitory reagents have been developed and represent potential therapies for VSs (54).
In addition to intracellular kinases, activation of ErbB2, a receptor tyrosine kinase essential for SC development, proliferation, and survival, appears to contribute to Schwann cell neoplasia, including VSs (27-29,32,55-58). The contribution of ErbB family members to neoplasia in general is well established and many molecules that inhibit ErbB family members are used clinically in the management of breast, head and neck, lung, central nervous system, and other malignancies (59). In general, these ErbB inhibitors display fewer side effects than cytotoxic agents and may be more suitable for long-term therapy as would likely be required in NF2 patients (33).
The purpose of this preliminary study was to validate the xenograft model of VS and the general ability of ErbB inhibitors to reduce tumor growth. It was not designed to evaluate the relative efficacy of different ErbB inhibitors, which will require a much larger sample of animals to determine dose response relationships. However, the observation that both ErbB inhibitors reduced tumor growth provides encouragement that targeting these molecules may ultimately prove effective.
Conclusions
In summary, we have shown that trastuzumab and erlotinib reduced the growth of VS xenografts. Although the growth of tumors was very slow, we were able to detect small differences in tumor growth using MRI and complement the imaging studies with assays of cell proliferation and death. These results raise the possibility of using ErbB inhibitors as systemic therapy to limit schwannoma growth in patients with NF2 or those unsuitable for current therapies.
Figure 4.
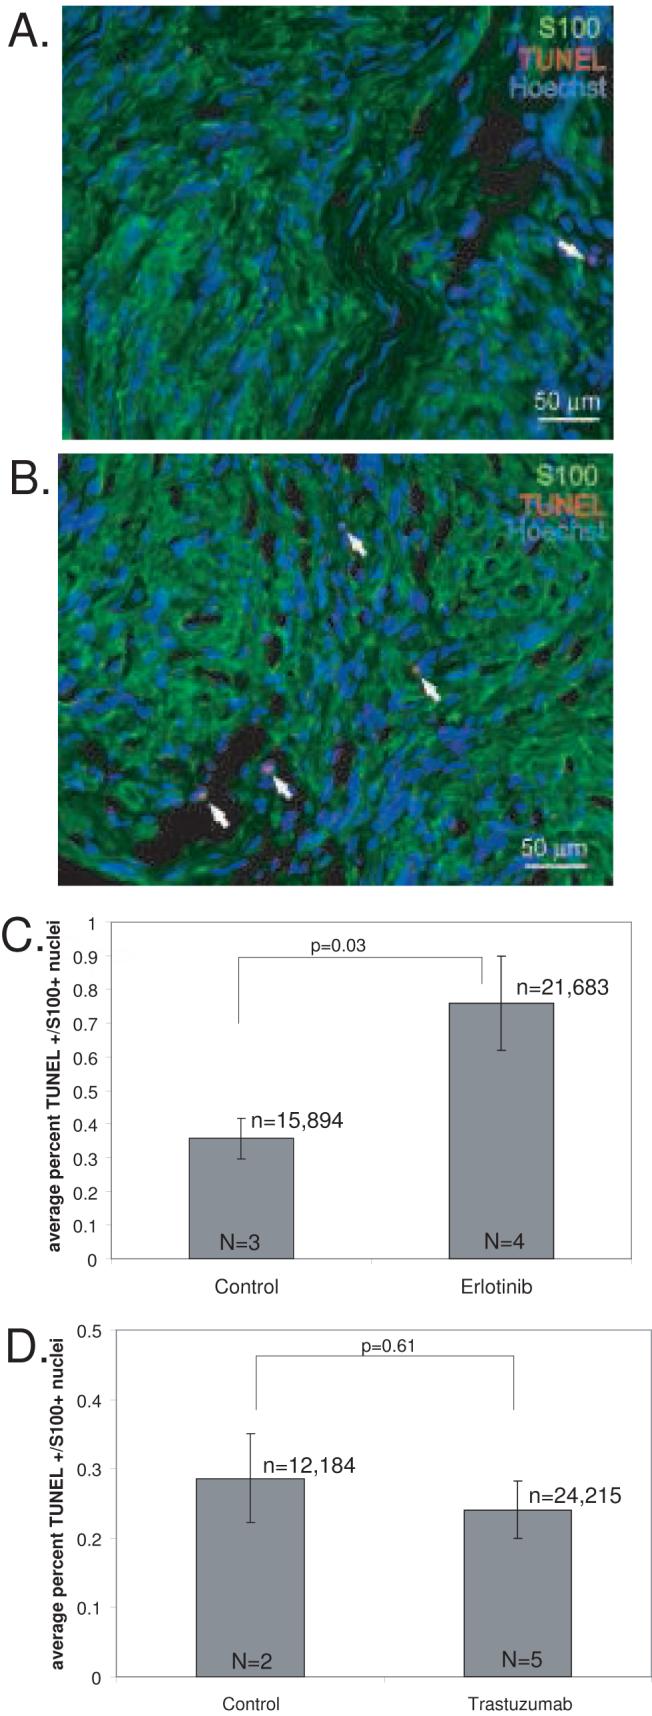
Erlotinib but not trastuzumab induces cell death in vestibular schwannoma (VS) xenografts. A and B. Representative images of xenograft frozen sections from control (A) and erlotinib treated (B) animals immunolabeled with anti- S100 antibody and Alexa 488 (green, S100-positive) conjugated secondary antibody. Apoptotic cells were determined by TUNEL staining using biotin labeled dUTP and detected with Alexa 568 labeled streptavidin (red, TUNEL-positive). Nuclei were labeled with Hoechst (blue). Arrows indicate TUNEL-positive nuclei. Scale bar=50 μm. C and D. The average number of TUNEL-positive, S100-positive nuclei was determined for each condition from 5 random selected fields from 3-4 sections/xenograft from 3 separate animals for each group. Erlotinb significantly increased the percent of TUNEL-positive VS cells in these xenografts (p=0.03, Student’s two-tailed t-test) (C) compared with control animals while trastuzumab did not (p=0.61) (D). Error bars in C and D represent standard error. n=total number of VS cells scored for each condition. N=total number of xenografts analyzed for each condition.
Acknowledgements
We thank Dan Thedens for assistance with MRI. Trastuzumab was a generous gift from Genentech (South San Francisco, CA)
Support for this study was provided by NIDCD KO8 DC006211. Genentech (South San Francisco, CA) provided the trastuzumab used in this study.
References
- 1.Rouleau GA, Merel P, Lutchman M, et al. Alteration in a new gene encoding a putative membrane-organizing protein causes neuro-fibromatosis type 2. Nature. 1993;363:515–21. doi: 10.1038/363515a0. [DOI] [PubMed] [Google Scholar]
- 2.Trofatter JA, MacCollin MM, Rutter JL, et al. A novel moesin-, ezrin-, radixin-like gene is a candidate for the neurofibromatosis 2 tumor suppressor. Cell. 1993;72:791–800. doi: 10.1016/0092-8674(93)90406-g. [DOI] [PubMed] [Google Scholar]
- 3.Neff BA, Welling DB, Arkhmametyeva E, et al. The molecular biology of vestibular schwannomas: dissecting the pathogenic process at the molecular level. Otol Neurotol. 2006;27:197–208. doi: 10.1097/01.mao.0000180484.24242.54. [DOI] [PubMed] [Google Scholar]
- 4.Welling DB, Packer MD, Chang LS. Molecular studies of vestibular schwannomas: a review. Curr Opin Otolaryngol Head Neck Surg. 2007;15:341–6. doi: 10.1097/MOO.0b013e3282b97310. [DOI] [PubMed] [Google Scholar]
- 5.National Institutes of Health Consensus Development Conference Statement on Acoustic Neuroma The Consensus Development Panel. Arch Neurol. 1994 December 11-13;51:201–7. doi: 10.1001/archneur.1994.00540140115021. 1991. [DOI] [PubMed] [Google Scholar]
- 6.Smouha EE, Yoo M, Mohr K, et al. Conservative management of acoustic neuroma: a meta-analysis and proposed treatment algorithm. Laryngoscope. 2005;115:450–4. doi: 10.1097/00005537-200503000-00011. [DOI] [PubMed] [Google Scholar]
- 7.Battaglia A, Mastrodimos B, Cueva R. Comparison of growth patterns of acoustic neuromas with and without radiosurgery. Otol Neurotol. 2006;27:705–12. doi: 10.1097/01.mao.0000226302.59198.87. [DOI] [PubMed] [Google Scholar]
- 8.Wackym PA. Stereotactic radiosurgery, microsurgery, and expectant management of acoustic neuroma: basis for informed consent. Otolaryngol Clin North Am. 2005;38:653–70. doi: 10.1016/j.otc.2005.03.018. [DOI] [PubMed] [Google Scholar]
- 9.Evans DG, Birch JM, Ramsden RT, et al. Malignant transformation and new primary tumours after therapeutic radiation for benign disease: substantial risks in certain tumour prone syndromes. J Med Genet. 2006;43:289–94. doi: 10.1136/jmg.2005.036319. [DOI] [PMC free article] [PubMed] [Google Scholar]
- 10.Bari ME, Forster DM, Kemeny AA, et al. Malignancy in a vestibular schwannoma. Report of a case with central neurofibromatosis, treated by both stereotactic radiosurgery and surgical excision, with a review of the literature. Br J Neurosurg. 2002;16:284–9. doi: 10.1080/02688690220148888. [DOI] [PubMed] [Google Scholar]
- 11.Wilkinson JS, Reid H, Armstrong GR. Malignant transformation of a recurrent vestibular schwannoma. J Clin Pathol. 2004;57:109–10. doi: 10.1136/jcp.57.1.109. [DOI] [PMC free article] [PubMed] [Google Scholar]
- 12.Lanman TH, Brackmann DE, Hitselberger WE, et al. Report of 190 consecutive cases of large acoustic tumors (vestibular schwannoma) removed via the translabyrinthine approach. J Neurosurg. 1999;90:617–23. doi: 10.3171/jns.1999.90.4.0617. [DOI] [PubMed] [Google Scholar]
- 13.Meyer TA, Canty PA, Wilkinson EP, et al. Small acoustic neuromas: surgical outcomes versus observation or radiation. Otol Neurotol. 2006;27:380–92. doi: 10.1097/00129492-200604000-00015. [DOI] [PubMed] [Google Scholar]
- 14.Slattery WH, 3rd, Fisher LM, Iqbal Z, et al. Vestibular schwannoma growth rates in neurofibromatosis type 2 natural history consortium subjects. Otol Neurotol. 2004;25:811–7. doi: 10.1097/00129492-200409000-00027. [DOI] [PubMed] [Google Scholar]
- 15.Baser ME, DG RE, Gutmann DH. Neurofibromatosis 2. Curr Opin Neurol. 2003;16:27–33. doi: 10.1097/01.wco.0000053583.70044.ab. [DOI] [PubMed] [Google Scholar]
- 16.Otsuka G, Saito K, Nagatani T, et al. Age at symptom onset and long-term survival in patients with neurofibromatosis Type 2. J Neurosurg. 2003;99:480–3. doi: 10.3171/jns.2003.99.3.0480. [DOI] [PubMed] [Google Scholar]
- 17.Hanemann CO, Evans DG. News on the genetics, epidemiology, medical care and translational research of Schwannomas. J Neurol. 2006;253:1533–41. doi: 10.1007/s00415-006-0347-0. [DOI] [PubMed] [Google Scholar]
- 18.Lim JY, Kim H, Kim YH, et al. Merlin suppresses the SRE-dependent transcription by inhibiting the activation of Ras-ERK pathway. Biochem Biophys Res Commun. 2003;302:238–45. doi: 10.1016/s0006-291x(03)00124-4. [DOI] [PubMed] [Google Scholar]
- 19.Jung JR, Kim H, Jeun SS, et al. The Phosphorylation status of merlin is important for regulating the Ras-ERK pathway. Mol Cells. 2005;20:196–200. [PubMed] [Google Scholar]
- 20.Lim JY, Kim H, Jeun SS, et al. Merlin inhibits growth hormone-regulated Raf-ERKs pathways by binding to Grb2 protein. Biochem Biophys Res Commun. 2006;340:1151–7. doi: 10.1016/j.bbrc.2005.12.122. [DOI] [PubMed] [Google Scholar]
- 21.Morrison H, Sperka T, Manent J, et al. Merlin/neurofibromatosis type 2 suppresses growth by inhibiting the activation of Ras and Rac. Cancer Res. 2007;67:520–7. doi: 10.1158/0008-5472.CAN-06-1608. [DOI] [PubMed] [Google Scholar]
- 22.Rong R, Tang X, Gutmann DH, et al. Neurofibromatosis 2 (NF2) tumor suppressor merlin inhibits phosphatidylinositol 3-kinase through binding to PIKE-L. Proc Natl Acad Sci U S A. 2004;101:18200–5. doi: 10.1073/pnas.0405971102. [DOI] [PMC free article] [PubMed] [Google Scholar]
- 23.Chadee DN, Xu D, Hung G, et al. Mixed-lineage kinase 3 regulates B-Raf through maintenance of the B-Raf/Raf-1 complex and inhibition by the NF2 tumor suppressor protein. Proc Natl Acad Sci U S A. 2006;103:4463–8. doi: 10.1073/pnas.0510651103. [DOI] [PMC free article] [PubMed] [Google Scholar]
- 24.Kaempchen K, Mielke K, Utermark T, et al. Upregulation of the Rac1/JNK signaling pathway in primary human schwannoma cells. Hum Mol Genet. 2003;12:1211–21. doi: 10.1093/hmg/ddg146. [DOI] [PubMed] [Google Scholar]
- 25.Fraenzer JT, Pan H, Minimo L, Jr, et al. Overexpression of the NF2 gene inhibits schwannoma cell proliferation through promoting PDGFR degradation. Int J Oncol. 2003;23:1493–500. [PubMed] [Google Scholar]
- 26.Fernandez-Valle C, Tang Y, Ricard J, et al. Paxillin binds schwannomin and regulates its density-dependent localization and effect on cell morphology. Nat Genet. 2002;31:354–62. doi: 10.1038/ng930. [DOI] [PubMed] [Google Scholar]
- 27.Hansen MR, Linthicum FH., Jr Expression of neuregulin and activation of erbB receptors in vestibular schwannomas: possible autocrine loop stimulation. Otol Neurotol. 2004;25:155–9. doi: 10.1097/00129492-200403000-00013. [DOI] [PubMed] [Google Scholar]
- 28.Stonecypher MS, Chaudhury AR, Byer SJ, et al. Neuregulin growth factors and their ErbB receptors form a potential signaling network for schwannoma tumorigenesis. J Neuropathol Exp Neurol. 2006;65:162–75. doi: 10.1097/01.jnen.0000199575.93794.2f. [DOI] [PubMed] [Google Scholar]
- 29.Hansen MR, Roehm PC, Chatterjee P, et al. Constitutive neuregulin-1/ErbB signaling contributes to human vestibular schwannoma proliferation. Glia. 2006;53:593–600. doi: 10.1002/glia.20316. [DOI] [PubMed] [Google Scholar]
- 30.Doherty JK, Ongkeko W, Crawley B, et al. ErbB and Nrg: Potential Molecular Targets for Vestibular Schwannoma Pharmacotherapy. Otol Neurotol. 2008;29:50–7. doi: 10.1097/mao.0b013e31815d4429. [DOI] [PubMed] [Google Scholar]
- 31.Brown KD, Hansen MR. Lipid raft localization of erbB2 in vestibular schwannoma and Schwann cells. Otol Neurotol. 2008;29:79–85. doi: 10.1097/mao.0b013e31815dbb11. [DOI] [PubMed] [Google Scholar]
- 32.Wickremesekera A, Hovens CM, Kaye AH. Expression of ErbB-1 and 2 in vestibular schwannomas. J Clin Neurosci. 2007;14:1199–206. doi: 10.1016/j.jocn.2007.05.009. [DOI] [PubMed] [Google Scholar]
- 33.Herbst RS. Review of epidermal growth factor receptor biology. Int J Radiat Oncol Biol Phys. 2004;59:21–6. doi: 10.1016/j.ijrobp.2003.11.041. [DOI] [PubMed] [Google Scholar]
- 34.Schaefer G, Shao L, Totpal K, et al. Erlotinib directly inhibits HER2 kinase activation and downstream signaling events in intact cells lacking epidermal growth factor receptor expression. Cancer Res. 2007;67:1228–38. doi: 10.1158/0008-5472.CAN-06-3493. [DOI] [PubMed] [Google Scholar]
- 35.Wang CX, Koay DC, Edwards A, et al. In vitro and in vivo effects of combination of Trastuzumab (Herceptin) and Tamoxifen in breast cancer. Breast Cancer Res Treat. 2005;92:251–63. doi: 10.1007/s10549-005-3375-z. [DOI] [PubMed] [Google Scholar]
- 36.Kimura K, Sawada T, Komatsu M, et al. Antitumor effect of trastuzumab for pancreatic cancer with high HER-2 expression and enhancement of effect by combined therapy with gemcitabine. Clin Cancer Res. 2006;12:4925–32. doi: 10.1158/1078-0432.CCR-06-0544. [DOI] [PubMed] [Google Scholar]
- 37.Friess T, Scheuer W, Hasmann M. Erlotinib antitumor activity in non-small cell lung cancer models is independent of HER1 and HER2 overexpression. Anticancer Res. 2006;26:3505–12. [PubMed] [Google Scholar]
- 38.Mahller YY, Vaikunth SS, Currier MA, et al. Oncolytic HSV and erlotinib inhibit tumor growth and angiogenesis in a novel malignant peripheral nerve sheath tumor xenograft model. Mol Ther. 2007;15:279–86. doi: 10.1038/sj.mt.6300038. [DOI] [PubMed] [Google Scholar]
- 39.Provenzano MJ, Xu N, Ver Meer MR, et al. p75NTR and Sortilin Increase After Facial Nerve Injury. Laryngoscope. 2008;118:87–93. doi: 10.1097/MLG.0b013e31814b8d9f. [DOI] [PubMed] [Google Scholar]
- 40.Stemmer-Rachamimov AO, Xu L, Gonzalez-Agosti C, et al. Universal absence of merlin, but not other ERM family members, in schwannomas. Am J Pathol. 1997;151:1649–54. [PMC free article] [PubMed] [Google Scholar]
- 41.Zucman-Rossi J, Legoix P, Der Sarkissian H, et al. NF2 gene in neurofibromatosis type 2 patients. Hum Mol Genet. 1998;7:2095–101. doi: 10.1093/hmg/7.13.2095. [DOI] [PubMed] [Google Scholar]
- 42.Mautner VF, Baser ME, Kluwe L. Phenotypic variability in two families with novel splice-site and frameshift NF2 mutations. Hum Genet. 1996;98:203–6. doi: 10.1007/s004390050191. [DOI] [PubMed] [Google Scholar]
- 43.Bruder CE, Hirvela C, Tapia-Paez I, et al. High resolution deletion analysis of constitutional DNA from neurofibromatosis type 2 (NF2) patients using microarray-CGH. Hum Mol Genet. 2001;10:271–82. doi: 10.1093/hmg/10.3.271. [DOI] [PubMed] [Google Scholar]
- 44.Chang LS, Jacob A, Lorenz M, et al. Growth of benign and malignant schwannoma xenografts in severe combined immunodeficiency mice. Laryngoscope. 2006;116:2018–26. doi: 10.1097/01.mlg.0000240185.14224.7d. [DOI] [PubMed] [Google Scholar]
- 45.Charabi S, Rygaard J, Klinken L, et al. Subcutaneous growth of human acoustic schwannomas in athymic nude mice. Acta Otolaryngol. 1994;114:399–405. doi: 10.3109/00016489409126077. [DOI] [PubMed] [Google Scholar]
- 46.Lee JK, Kim TS, Chiocca EA, et al. Growth of human schwannomas in the subrenal capsule of the nude mouse. Neurosurgery. 1990;26:598–605. doi: 10.1097/00006123-199004000-00007. [DOI] [PubMed] [Google Scholar]
- 47.Lee JK, Sobel RA, Chiocca EA, et al. Growth of human acoustic neuromas, neurofibromas and schwannomas in the subrenal capsule and sciatic nerve of the nude mouse. J Neurooncol. 1992;14:101–12. doi: 10.1007/BF00177613. [DOI] [PubMed] [Google Scholar]
- 48.Roehm PC, Gantz BJ. Management of Acoustic Neuromas in Patients 65 Years or Older. Otol Neurotol. 2007 doi: 10.1097/01.mao.0000281805.44197.ec. [DOI] [PubMed] [Google Scholar]
- 49.McClatchey AI, Saotome I, Mercer K, et al. Mice heterozygous for a mutation at the Nf2 tumor suppressor locus develop a range of highly metastatic tumors. Genes Dev. 1998;12:1121–33. doi: 10.1101/gad.12.8.1121. [DOI] [PMC free article] [PubMed] [Google Scholar]
- 50.Gutmann DH, Giovannini M. Mouse models of neurofibromatosis 1 and 2. Neoplasia. 2002;4:279–90. doi: 10.1038/sj.neo.7900249. [DOI] [PMC free article] [PubMed] [Google Scholar]
- 51.Giovannini M, Robanus-Maandag E, van der Valk M, et al. Conditional biallelic Nf2 mutation in the mouse promotes manifestations of human neurofibromatosis type 2. Genes Dev. 2000;14:1617–30. [PMC free article] [PubMed] [Google Scholar]
- 52.Messerli SM, Tang Y, Giovannini M, et al. Detection of spontaneous schwannomas by MRI in a transgenic murine model of neurofibromatosis type 2. Neoplasia. 2002;4:501–9. doi: 10.1038/sj.neo.7900265. [DOI] [PMC free article] [PubMed] [Google Scholar]
- 53.Messerli SM, Prabhakar S, Tang Y, et al. Treatment of schwannomas with an oncolytic recombinant herpes simplex virus in murine models of neurofibromatosis type 2. Hum Gene Ther. 2006;17:20–30. doi: 10.1089/hum.2006.17.20. [DOI] [PubMed] [Google Scholar]
- 54.Hirokawa Y, Tikoo A, Huynh J, et al. A clue to the therapy of neurofibromatosis type 2: NF2/merlin is a PAK1 inhibitor. Cancer J. 2004;10:20–6. doi: 10.1097/00130404-200401000-00006. [DOI] [PubMed] [Google Scholar]
- 55.Adlkofer K, Lai C. Role of neuregulins in glial cell development. Glia. 2000;29:104–11. doi: 10.1002/(sici)1098-1136(20000115)29:2<104::aid-glia2>3.0.co;2-2. [DOI] [PubMed] [Google Scholar]
- 56.Stonecypher MS, Byer SJ, Grizzle WE, et al. Activation of the neuregulin-1/ErbB signaling pathway promotes the proliferation of neoplastic Schwann cells in human malignant peripheral nerve sheath tumors. Oncogene. 2005 doi: 10.1038/sj.onc.1208730. [DOI] [PubMed] [Google Scholar]
- 57.Huijbregts RP, Roth KA, Schmidt RE, et al. Hypertrophic neuropathies and malignant peripheral nerve sheath tumors in transgenic mice overexpressing glial growth factor beta3 in myelinating Schwann cells. J Neurosci. 2003;23:7269–80. doi: 10.1523/JNEUROSCI.23-19-07269.2003. [DOI] [PMC free article] [PubMed] [Google Scholar]
- 58.Frohnert PW, Stonecypher MS, Carroll SL. Constitutive activation of the neuregulin-1/ErbB receptor signaling pathway is essential for the proliferation of a neoplastic Schwann cell line. Glia. 2003;43:104–18. doi: 10.1002/glia.10232. [DOI] [PubMed] [Google Scholar]
- 59.Hsieh AC, Moasser MM. Targeting HER proteins in cancer therapy and the role of the non-target HER3. Br J Cancer. 2007;97:453–7. doi: 10.1038/sj.bjc.6603910. [DOI] [PMC free article] [PubMed] [Google Scholar]